4228
Navigator-free Metabolite-Cycled Cardiac Proton Spectroscopy1Institute for Biomedical Engineering, University and ETH Zurich, Zurich, Switzerland
Synopsis
Respiratory gating is a burden of conventional cardiac water-suppressed proton spectroscopy and averages are typically phase corrected based on the low-SNR triglyceride signal. Metabolite cycling allows to perform frequency and phase correction on the high-SNR water signal, which might alleviate the necessity for respiratory gating. In this work navigator-free metabolite-cycled cardiac proton spectroscopy was compared with navigator-free water-suppressed and navigator-gated water-suppressed measurements. Analyses based on relative Cramér-Rao lower bounds, creatine-to-water and triglyceride-to-water ratios were performed. Navigator-free metabolite-cycled scans were 3-4 times faster compared to conventional navigator-gated water-suppressed scans while improving signal quality.
Introduction
Motion leads to phase and frequency fluctuations of consecutively acquired averages in cardiac proton spectroscopy. When using water suppression (WS), respiratory gating is necessary and averages are typically phase corrected based on the low-SNR triglyceride signal. Metabolite cycling (MC) allows to perform frequency and phase correction on the high-SNR water signal1,2, which might alleviate the necessity for respiratory gating. This would especially be advantageous in clinical settings, where breathing patterns can be irregular and time is a restricting factor. In this work, navigator-free metabolite-cycled cardiac proton spectroscopy was implemented and compared with navigator-free water-suppressed and navigator-gated water-suppressed measurements, respectively.Methods
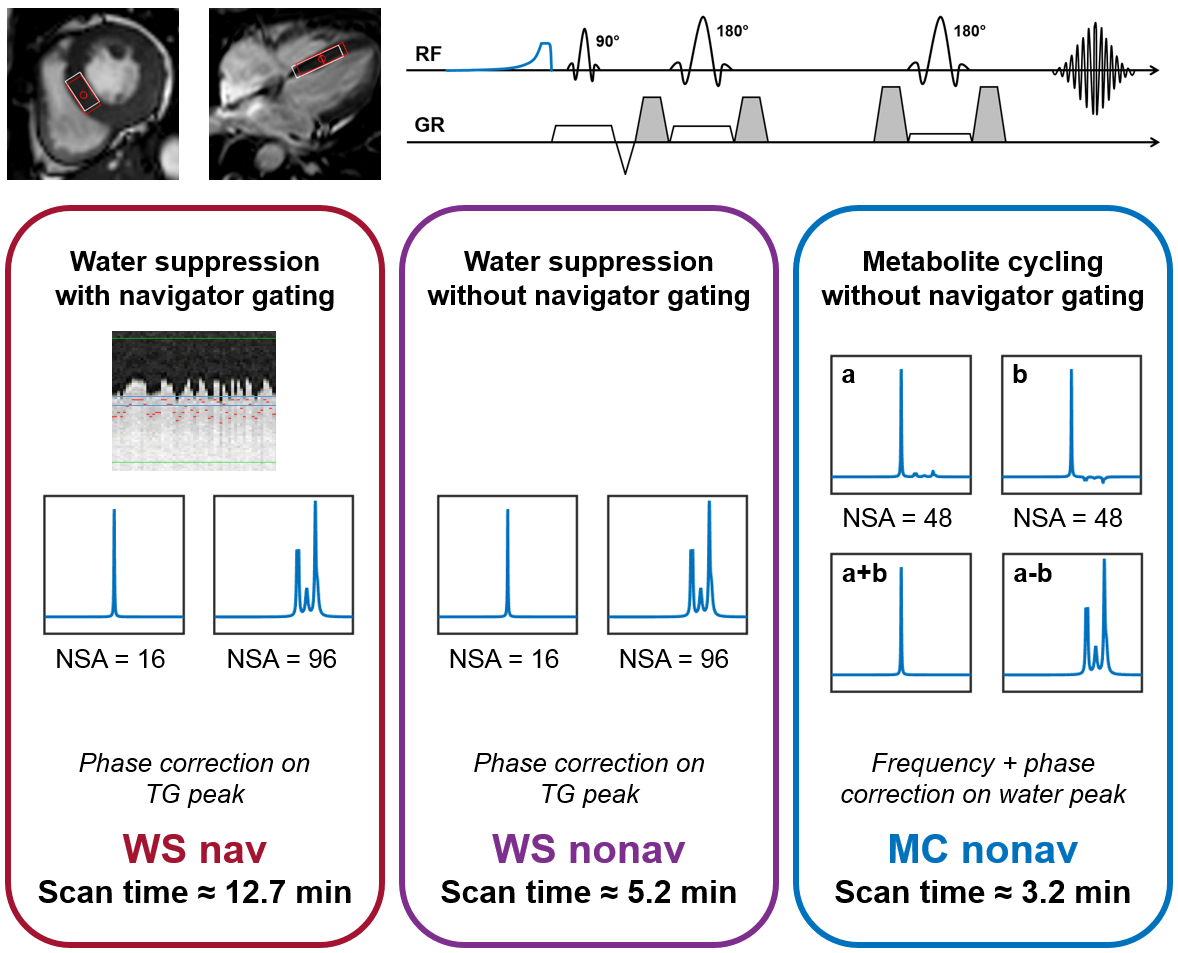
Metabolite cycling was implemented on a clinical 1.5T Achieva scanner (Philips Healthcare) using a Hwang3 asymmetric inversion pulse. Pulse parameters were numerically optimized: B1 = 9μT, Tp = 50ms, frequency offset = -130Hz and frequency factor = 1.4. In vivo measurements were performed on 10 healthy volunteers (age 21-34, 6 male). Navigator-gated water-suppressed (WS nav), navigator-free water-suppressed (WS nonav) and navigator-free metabolite-cycled (MC nonav) spectra were acquired in all subjects using a five-channel cardiac receiver array (Fig-1). All spectra were acquired in the interventricular septum using a PRESS sequence with reduced spoiler areas4 and the following sequence parameters: voxel size = 10×20×40mm3, TR = 2s, TE = 20ms, pencil-beam volume shimming and ECG-triggering to end systole. A respiratory navigator positioned on the liver was employed for WS nav (gating window = 4mm). The navigator signal was measured as well for MC nonav for further data analyses, but no gating was applied. CHESS based water suppression (100Hz) was performed for WS nav and WS nonav scans. For WS scans 96 water-suppressed and 16 water-unsuppressed averages were acquired, while the total amount of averages for MC nonav was 96.
Total scan time was 12.7 min, 5.2 min and 3.2 min for WS nav, WS nonav and MC nonav, respectively. This includes the water suppression optimization preparation phase and assumes 30% navigator efficiency (WS nav) and a heart rate of 60 bpm. It excludes other preparation phases, but those were similar for all three methods.
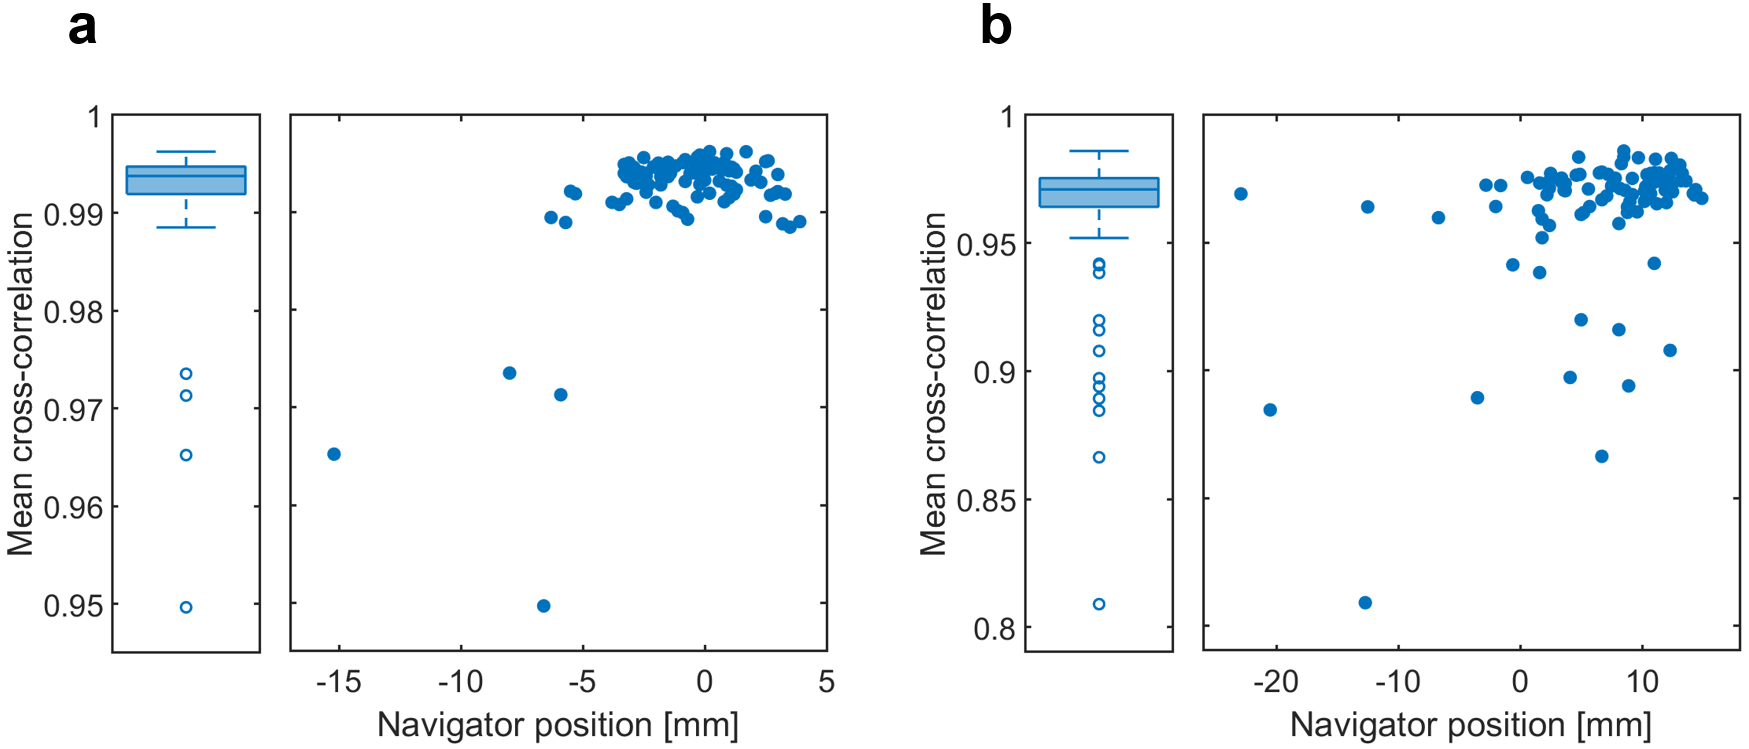
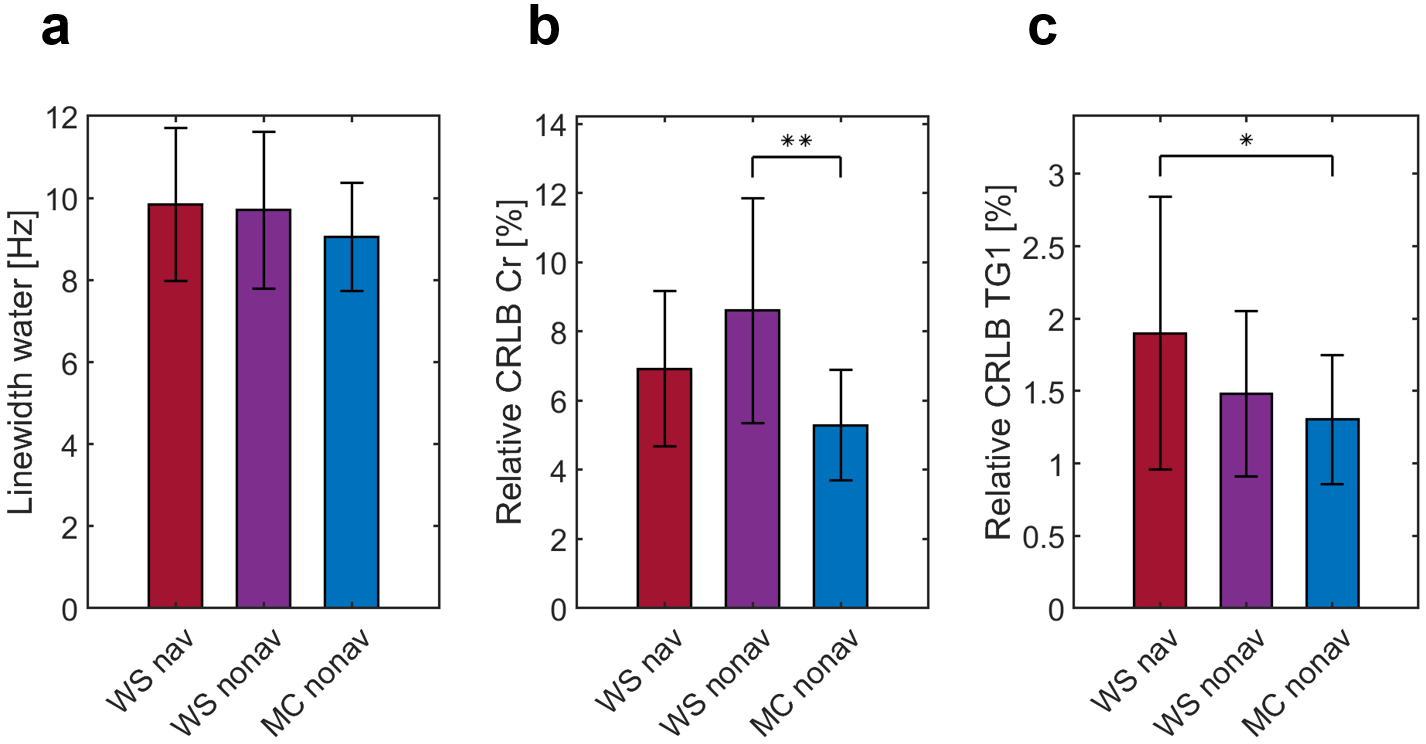
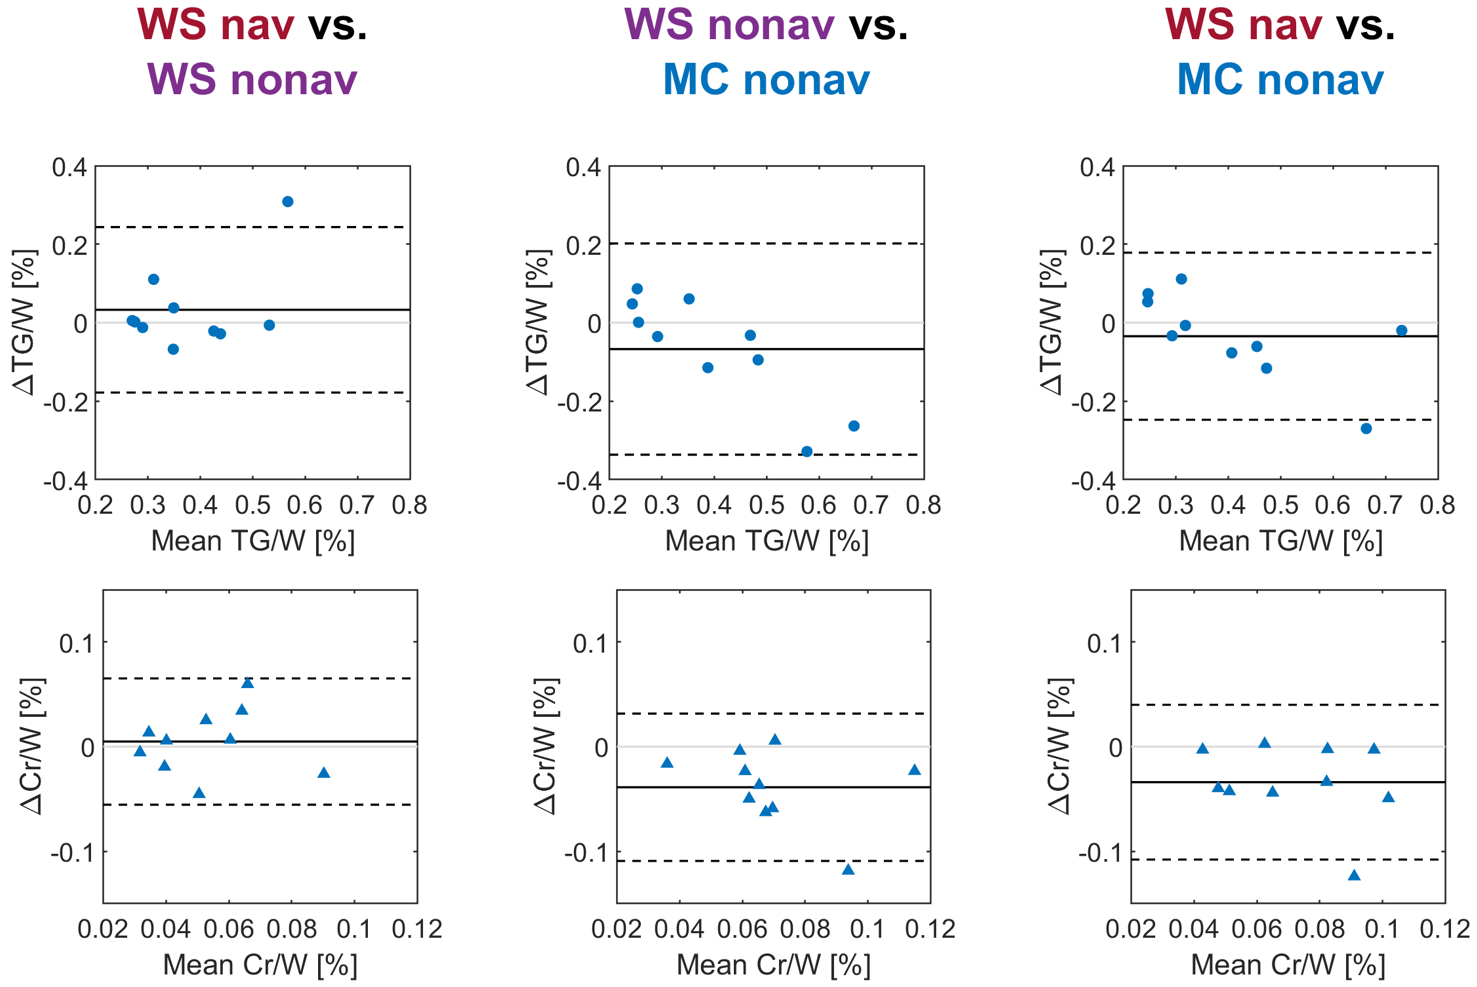
Spectra were reconstructed in MATLAB using a customized reconstruction pipeline. The water-suppressed spectra were phased on the main TG resonance at 1.3 ppm before averaging, whereas the metabolite-cycled spectra were both phased and frequency corrected on the water peak before further analyses. Cross-correlation between single averages was calculated for MC nonav and the relationship between navigator position and mean cross-correlation was examined. The reconstructed spectra were fitted in the time-domain using AMARES (jMRUI) assuming Lorentzian line shapes. Relative Cramér-Rao lower bounds (CRLB) were calculated for the creatine signal at 3.01 ppm and the main triglyceride peak (TG1) at 1.3 ppm. Paired t-tests were used for statistical analysis. Triglyceride-to-water (TG/W) and creatine-to-water (Cr/W) ratios were calculated and a correction was made for T1 and T2 relaxation. Bland-Altman analyses were performed on these ratios for comparison between the different methods.
Results
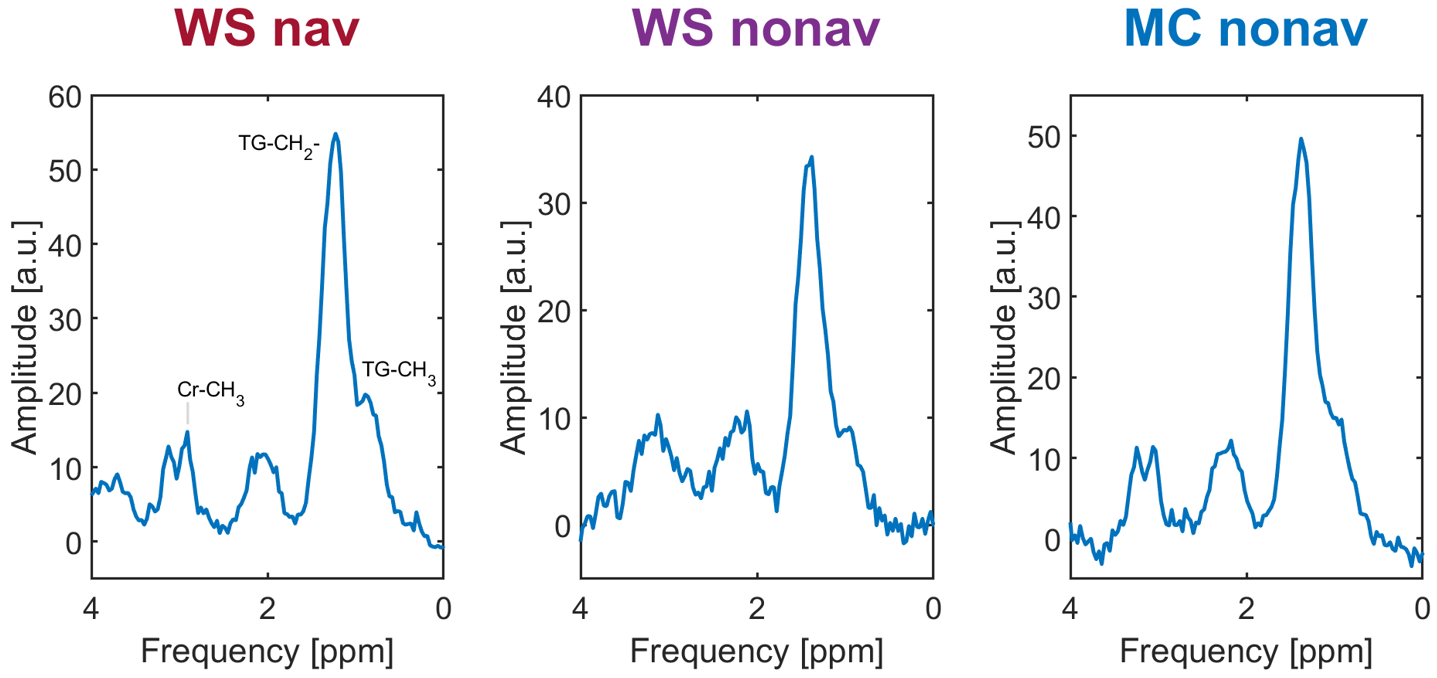
Correlation between the mean cross-correlation of metabolite-cycled averages and navigator position is shown in Fig-2. A high mean cross-correlation is observed for a relatively broad range of navigator positions. Exemplary spectra are shown in Fig-3. WS nav and MC nonav spectra look similar, but signal quality is degraded for WS nonav. Fig-4 shows mean and standard deviation for the linewidth of the water peak, relative CRLB for creatine and for triglyceride for all three methods. The linewidth of the water peak doesn’t differ significantly between the three methods. Relative CRLB of the creatine peak is significantly smaller for MC nonav compared to WS nonav, and relative CRLB for triglyceride is significantly smaller for MC nonav compared to WS nav. Bland-Altman analyses of TG/W and Cr/W ratios are shown in Fig-5. Cr/W ratio is higher for MC nonav compared to both WS nav and WS nonav.Discussion
For successful reconstruction of metabolite-cycled spectra, single averages should have a high agreement to allow correct addition and subtraction. The observed relationship between mean cross-correlation and navigator position might indicate that a navigator is not necessary for metabolite cycling. Navigator gating is however necessary for water-suppressed scans, because there no frequency correction before averaging is performed.
In this study relatively large voxels were measured. Because metabolite cycling does not rely on low-SNR TG signal for post-processing, it would be suited to measure smaller voxels compared to conventional water-suppressed methods. This can be advantageous when comparing metabolism in an infarcted region with healthy myocardium.
Conclusion
Navigator-free metabolite-cycled cardiac proton spectroscopy leads to better signal quality and shorter scan times than navigator-free water-suppressed and conventional navigator-gated water-suppressed scans.Acknowledgements
No acknowledgement found.References
1. Hock A et al. Non-water-suppressed proton MR spectroscopy improves spectral quality in the human spinal cord. Magn Reson Med. 2013;69(5):1253-1260.
2. Fillmer A et al. Non-Water-Suppressed 1H MR Spectroscopy with Orientational Prior Knowledge Shows Potential for Separating Intra- and Extramyocellular Lipid Signals in Human Myocardium. Sci Rep. 2017;7(1):16898.
3. Hwang TL et al. Asymmetric adiabatic pulses for NH selection. J Magn Reson. 1999;138(1):173-177.
4. Weiss K et al. Compensation of signal loss due to cardiac motion in point-resolved spectroscopy of the heart. Magn Reson Med. 2014;72(5):1201-1207.
Figures