4225
Glucose metabolism in the brain of an Alzheimer mouse model by deuterium MRS1Radiology and Nuclear Medicine, Radboud university medical center, Nijmegen, Netherlands, 2Department of Anatomy, Radboud university medical center, Nijmegen, Netherlands, 3Department of Pediatrics of Radboud Center for Mitochondrial Medicine, Radboud university medical center, Nijmegen, Netherlands
Synopsis
In this study we show that Deuterium Magnetic Resonance Spectroscopy (DMRS) of the mouse brain after a bolus application of [6,6’-2H2]glucose is feasible at a high SNR and time resolution. We demonstrate that this can be applied to a transgenic mouse model of Alzheimer disease showing clear differences in the glucose uptake and metabolism with a WT mouse. In Deuterium Metabolic Imaging (DMI) mode this could be an alternative approach for FDG PET in Alzheimer disease.
Introduction
Deuterium MR imaging (DMI) and spectroscopy (DMRS) have recently been introduced for studies of energy metabolism in the brain of rats1, 2 and also of humans1 with potential for clinical applications. With substrates such as [6,6’-2H2]glucose and [2H3]acetate it is possible to follow conversions of these compounds by transfer of 2H into water and metabolites like lactate and glutamate/glutamine. As mouse models of disease are widely used for mechanistic studies of brain metabolism it is of interest also to develop a setup for DMI and DMRS of the mouse brain. Here we describe such a setup and demonstrate its application to a mouse model for Alzheimer disease.
Methods
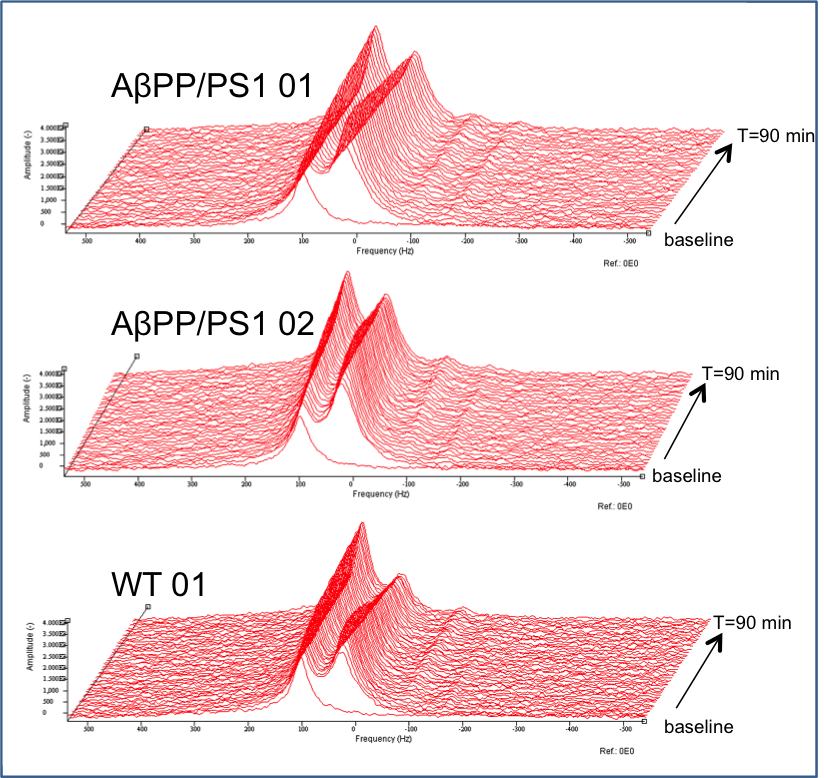
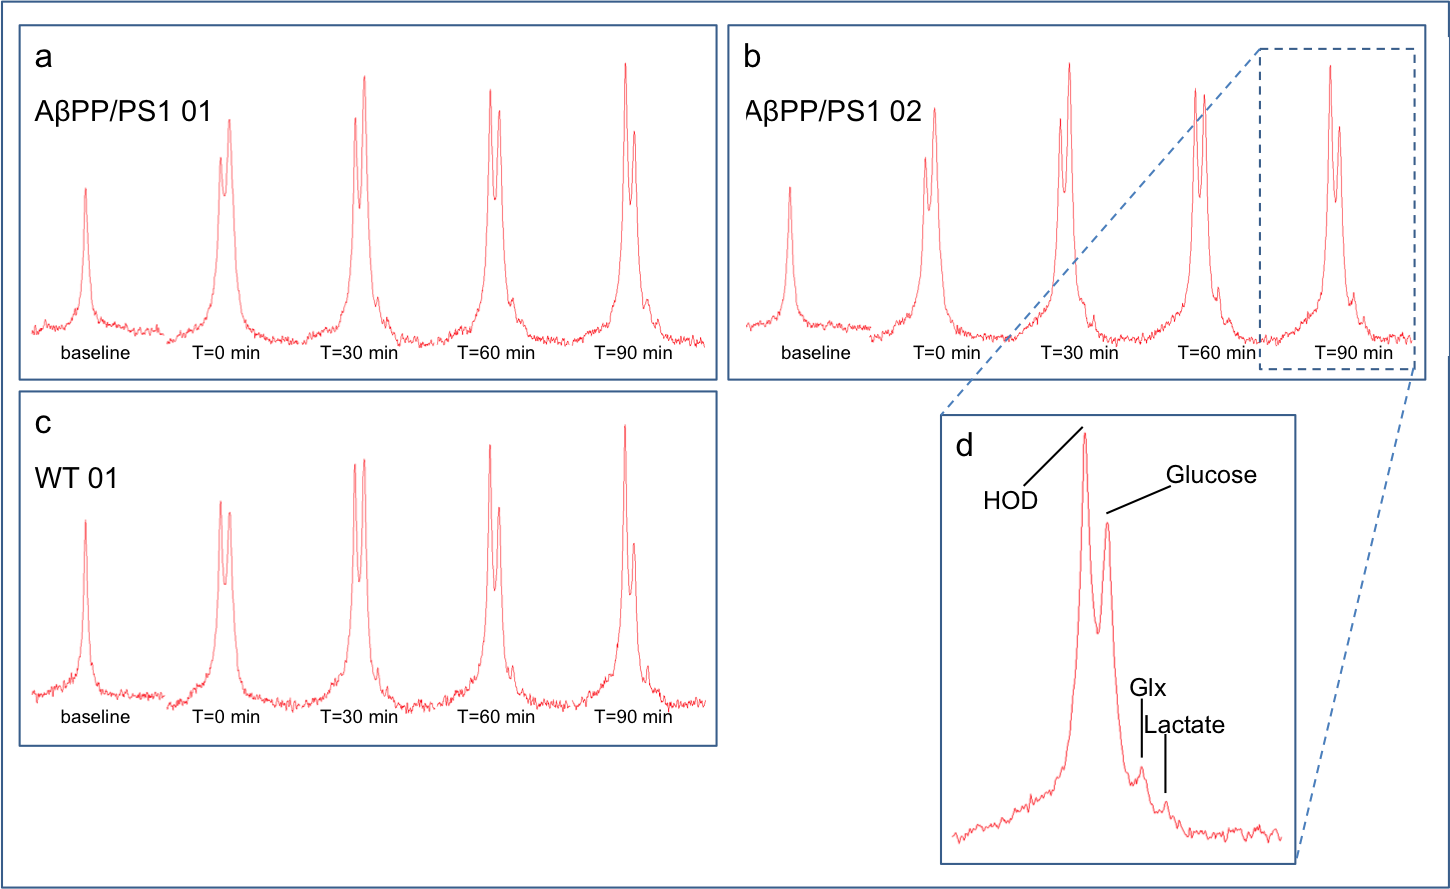
We used adult transgenic male mice resembling familial AD by carrying the Swedish amyloid precursor protein (APP) aberration and mutated presenilin 1 (PS1) AβPPswe/PS1dE9 (AβPP/PS1) and wild type littermates (WT) (C57BL6/J). MR measurement were performed on an 11.7 T BioSpec Avance III small animal MR system (Bruker BioSpin, Ettlingen, Germany) equipped with actively shielded gradient set of 600 mT/m. Mice were anesthetized with 1.5-2% Isoflurane in a mixture of O2 and air (1:2) and positioned in prone position in a dedicated mouse brain setup. Breathing was kept at 60-80 breaths/min and body temperature at 37±1°C, using a warm water bed. A homebuilt 2H surface coil (12mm diameter) was positioned on the head of the mouse for DMRS acquisition and a 1H Helmholtz coil was used for imaging and shimming. After anatomical imaging and shimming a 2H baseline spectrum was acquired with the following parameters: free induction decay, bandwidth=14ppm, 512 points, repetition time=0.5s, 300 averages, total acquisition time=2:30min. Then a bolus injection of [6,6’-2H2]glucose (2mg/kg) dissolved in water was administered intravenously and directly thereafter a series of 36 consecutive spectra was acquired with the same settings as the baseline spectrum for a total time of 90 minutes (figure 1 and 2). After applying a line broadening filter of 5Hz, the acquired 2H time course spectra were fitted with AMARES3. Signals of water (HOD), glucose (Gluc), Glx and lactate (Lac) were fitted with a Lorentian line shape and evaluated over time. The prior knowledge of the fitting parameters was minimized to fixing the line widths of Glx and lactate to the water signal and to soft constrain the chemical shift frequencies of glucose, Glx and lactate with +/- 0.02ppm. A natural abundance of 2H concentration of 13.7 mM for brain tissue water was used to express metabolite content in mM.Results
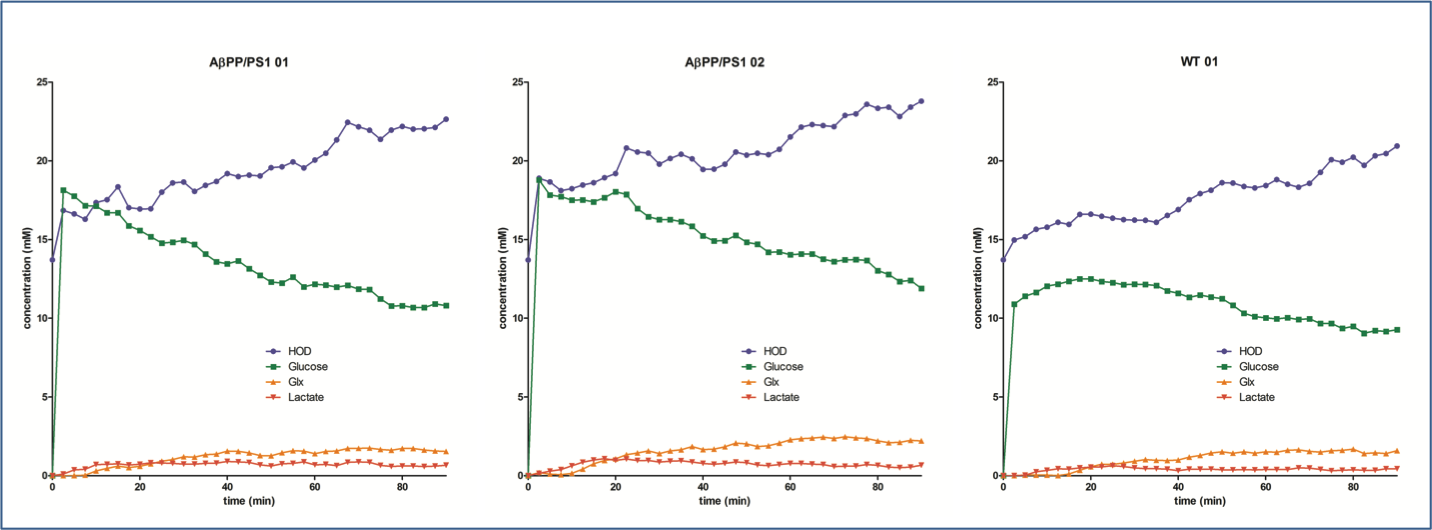
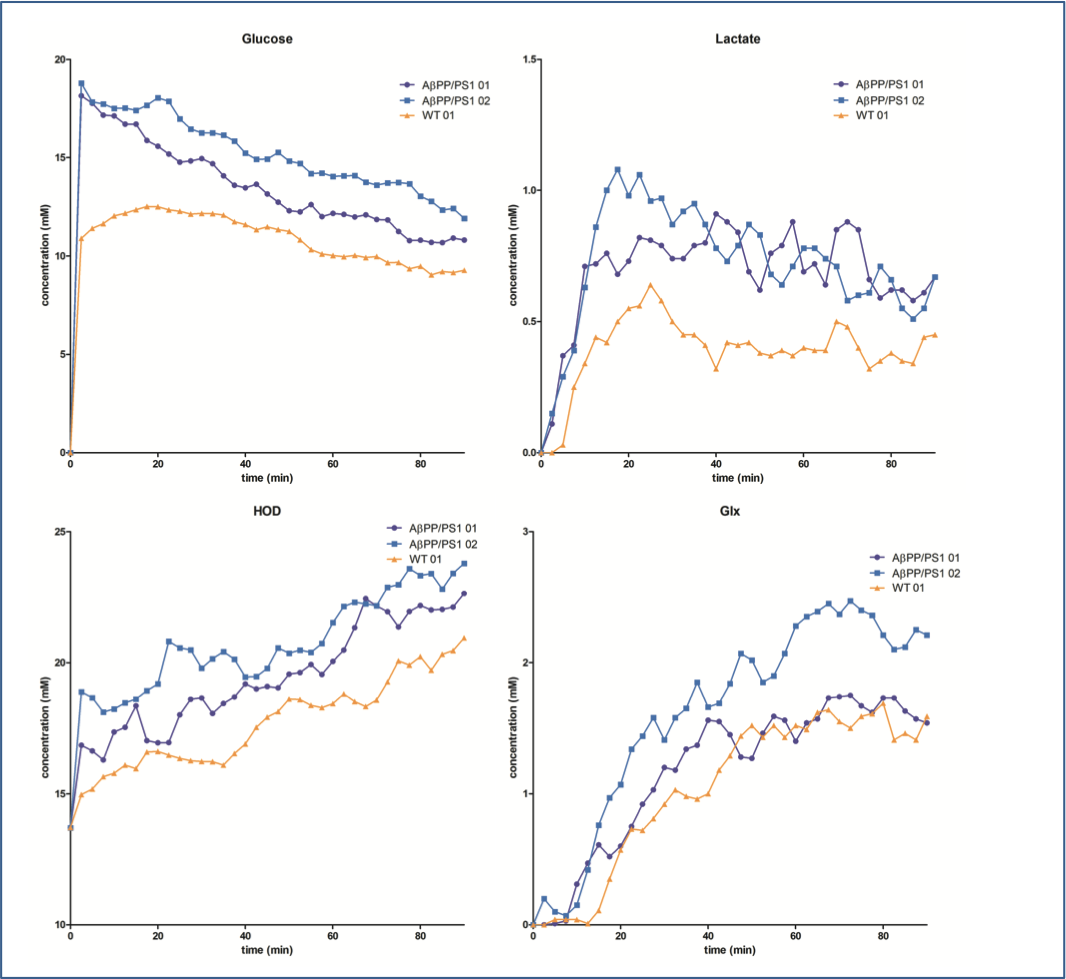
Examples for time series spectra before and after the application of [6,6’-2H2]glucose are shown in Figures 1 and 2. In spectra of both the WT and AβPP/PS1 mice we observed signals for HOD, glucose, Glx and lactate with excellent SNR. Data fits showed an increase of the HOD signal and a decrease in the glucose signal over time in the WT mouse (figure 3), somewhat slower than has been reported before2. The AβPP/PS1 mice showed a higher initial glucose content than the WT, which however declined faster (Figures 3 and 4). In the brain of the AβPP/PS1 mice the signal for Glx and lactate increased faster over time than that in the brain of the WT (Figure 4).Discussion
In this study we demonstrate that 2H DMRS of the mouse brain is feasible at a good SNR and at a sufficient time resolution to obtain kinetic information. In the WT mouse the decrease of the glucose signal seems to be somewhat slower than has been reported for rat brain under similar anaesthesia conditions2. Although our data are preliminary we do observe differences in the time series between WT and AβPP/PS1 mice. The higher initial glucose content in the Alzheimer model mouse might indicate a higher blood glucose level, which could be due to the general condition of these mice. However, the faster decrease of glucose and increase of Glx and lactate indicates a more active brain metabolism. This is remarkable as PET studies usually indicate a decrease in FDG uptake in Alzheimer models. However, FDG uptake has been demonstrated to increase with age in these mice4 and the WT mouse was much younger than the AβPP/PS1 mice. Also of influence could be the presence of inflammation, the applied anaesthesia or the rather high glucose levels administered to the mice. Future studies should apply more physiological amounts of 2H glucose and less deep anaesthesia. In addition it is possible to determine CMRglc and VTCA from the kinetic data2.Acknowledgements
No acknowledgement found.References
1 De Feyter et al., Sci Adv vol 4, 2018;
2 Lu et al., J Cereb Blood Flow Metab vol 37, 2017;
3 Vanhamme et al., Journal of Magnetic Resonance vol 129, 1997;
4 Takkinnen et al., J Cereb Blood Flow Metab. Vol 37, 2017;
Figures