4222
Limitation of glucose consumption in rat head detected by labeled glucose-17O1Florida State University/NHMFL, Tallahassee, FL, United States, 2MSR, Florida State University/NHMFL, Tallahassee, FL, United States
Synopsis
In animal experiments using 17O labeled glucose, questions arose regarding the relatively stable rate of glucose metabolism, compared with a simultaneous variation in glucose concentration after bolus injection. Bolus Glucose-6-17O administration with doses 3-15 μmol/g for normal rats revealed the same glucose consumption with CMRglc = 0.43 ± 0.06 μmol/g tissue/min. After bolus injection, the rate of glucose metabolism was consistent in each dose regardless of the large variation in glucose concentration. The results correlate with the observations of others, indicating that glucose-6-phosphate (G-6-P) does not accumulate in hyperglycemia and can limit glucose consumption.
Introduction
Glucose metabolism has a major role in energy metabolism in vivo. The rate of glucose metabolism can be determined by oxygen or glucose consumption. For example, one can have both components labeled by 17O nuclei, which is suitable for MR detection. Either approach examines the same reaction of glucose metabolism, but from different points of view and provides different information, which exceeds the well-known metabolic association between oxygen and glucose 1. In animal experiments using 17O labeled glucose, questions arose regarding the relatively stable rate of glucose metabolism over an hour during simultaneous variation in glucose concentration after bolus injection. This contrasting situation was observed in a mouse brain 2 with a glucose injection dose of 13.8 μmol/g. In the current study, experiments with rats were conducted using a range of doses for injected glucose to confirm and analyze such observations.Methods
Intravenous tail administrations of glucose-6-17O (abundance 38-47%) were investigated by detecting 17O MR signal from a rat head at 21.1 T. The MR experiments were performed using Bruker MRI Avance III console (PV 5.1 software). The in vivo RF probe has a double tuned 17O/1H volume RF coil with an internal diameter of 33 mm, covering the whole rat head. The MR frequency for 17O was 121.65 MHz. The time course of the MR 17O signal changes was detected using 90 degree RF pulse of 160 μs, TR time of 90 ms and NA = 166; thus, the time course resolution was 15 s/point. The MR signal allowed us to follow the changes of 17O labeled glucose and 17O metabolized water content at the same time. The injection of 1.5 mL PBS solution containing D-glucose-6-17O in the rat tail had duration of 1.5 min. Glucose injection doses were in the range of 3 - 15 μmol/g of animal weight. The in vivo experiments were performed using 6 male Fisher 344 rats (~ 200 g) anesthetized by isoflurane 1.5%. All animal experiments were conducted according to the protocols approved by The Florida State University ACUC.Results and Discussion
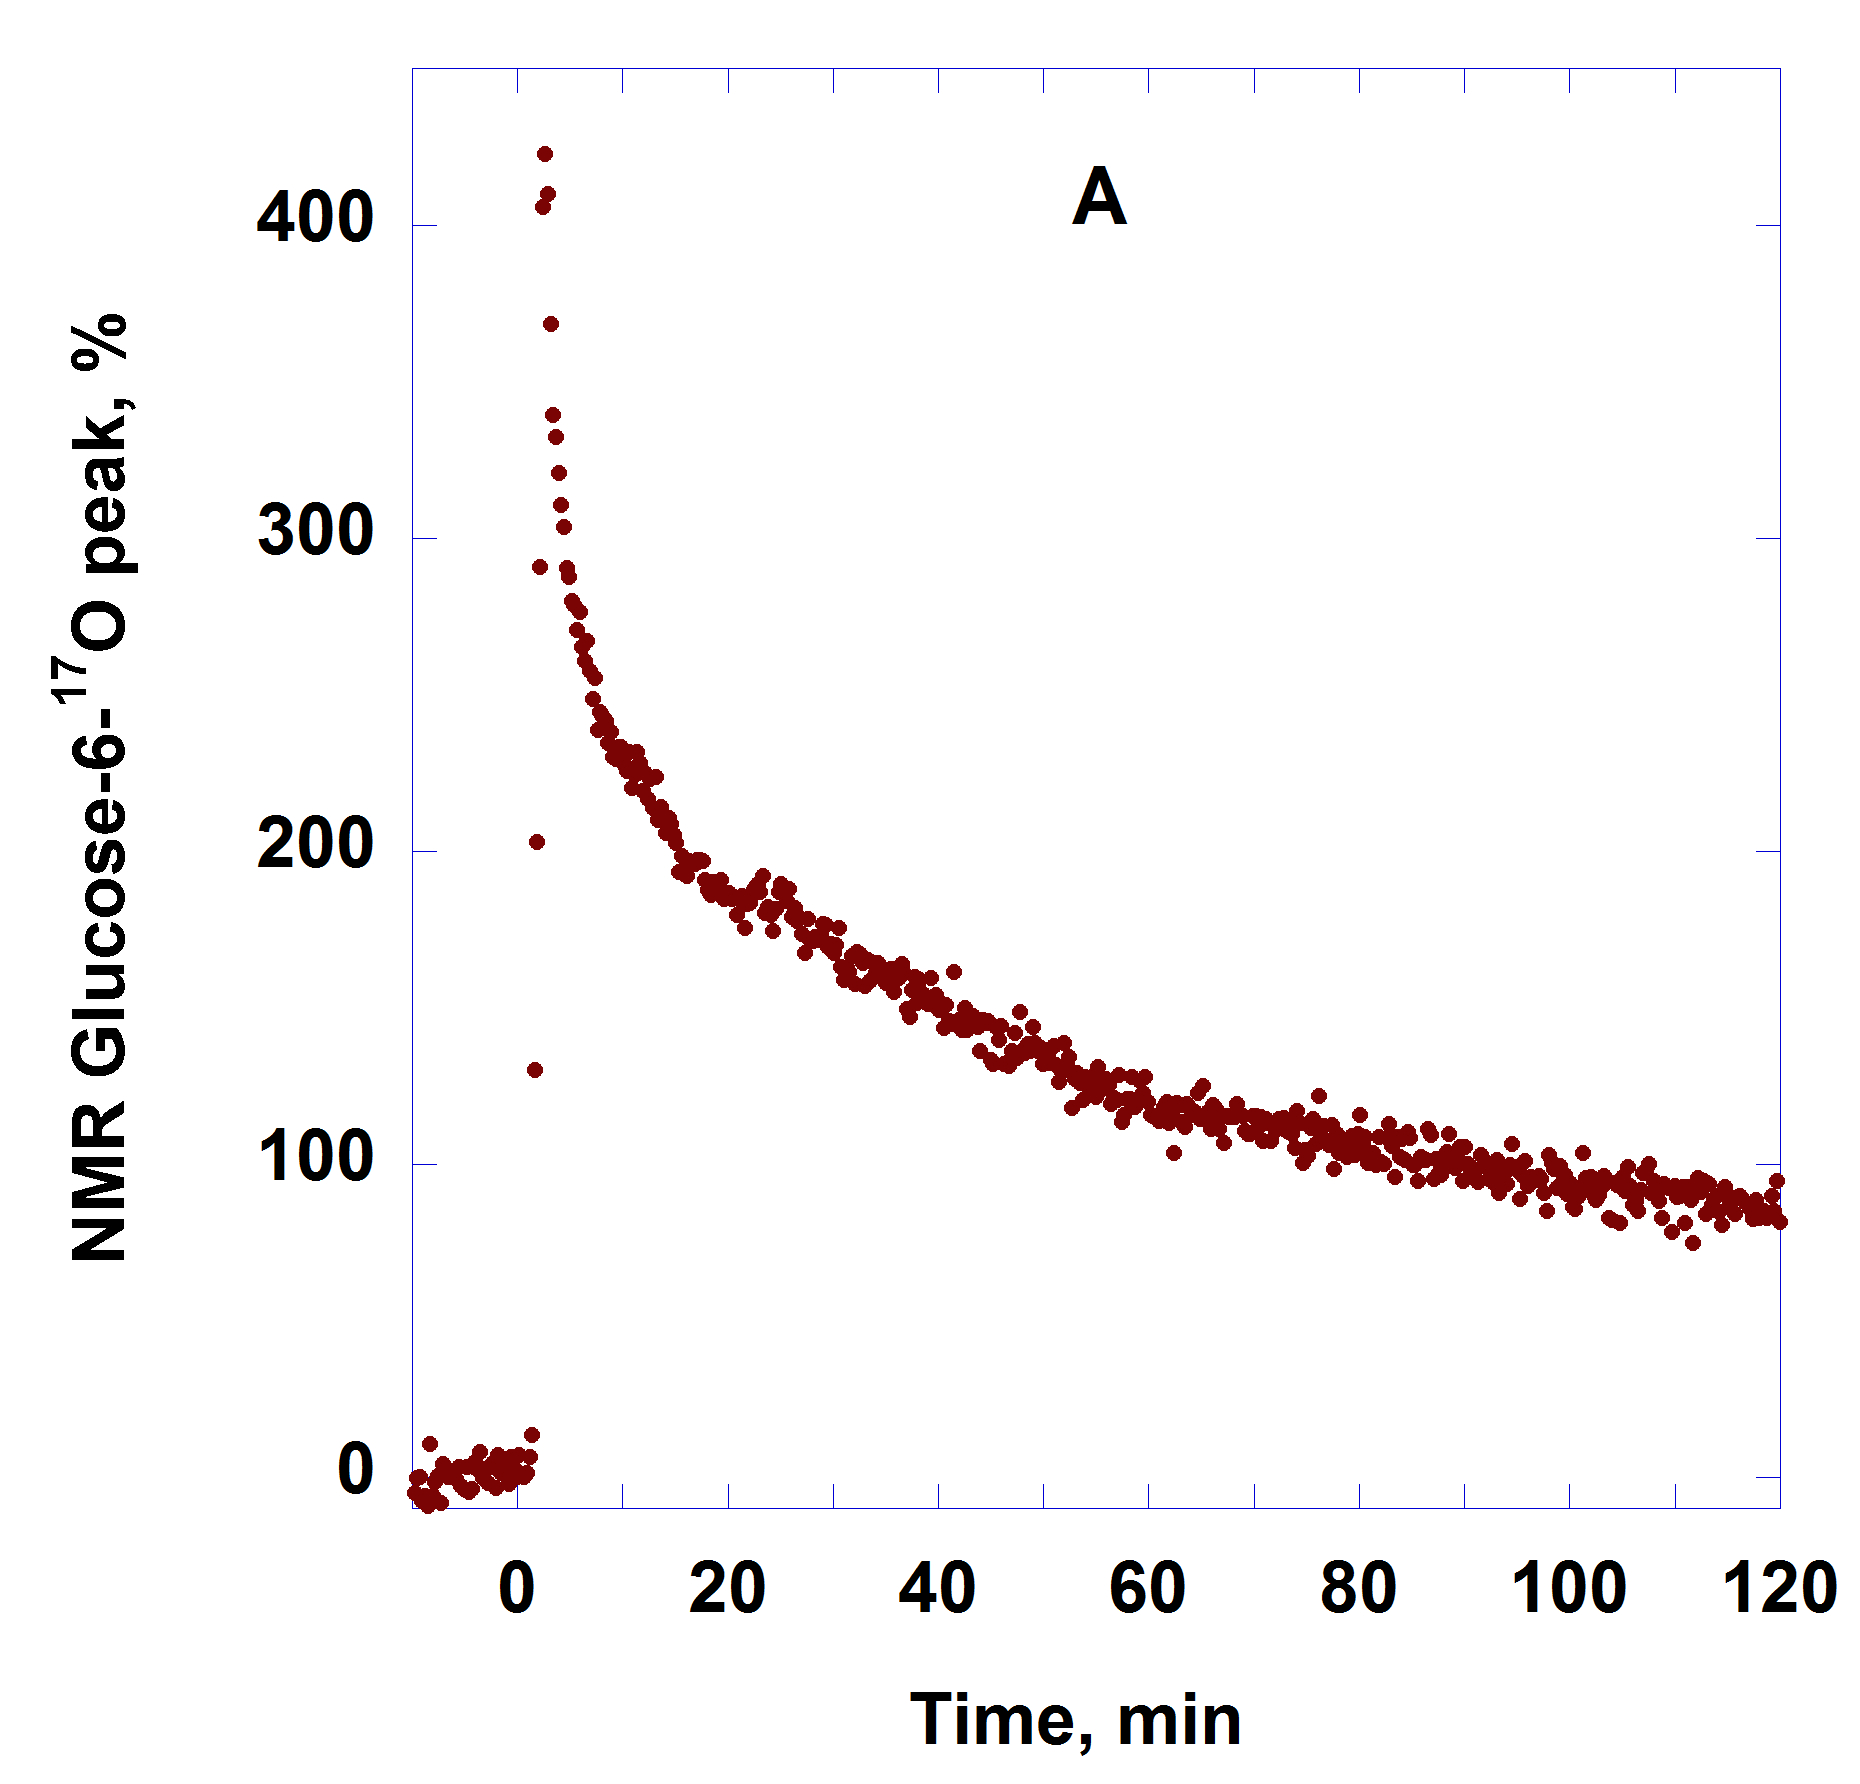
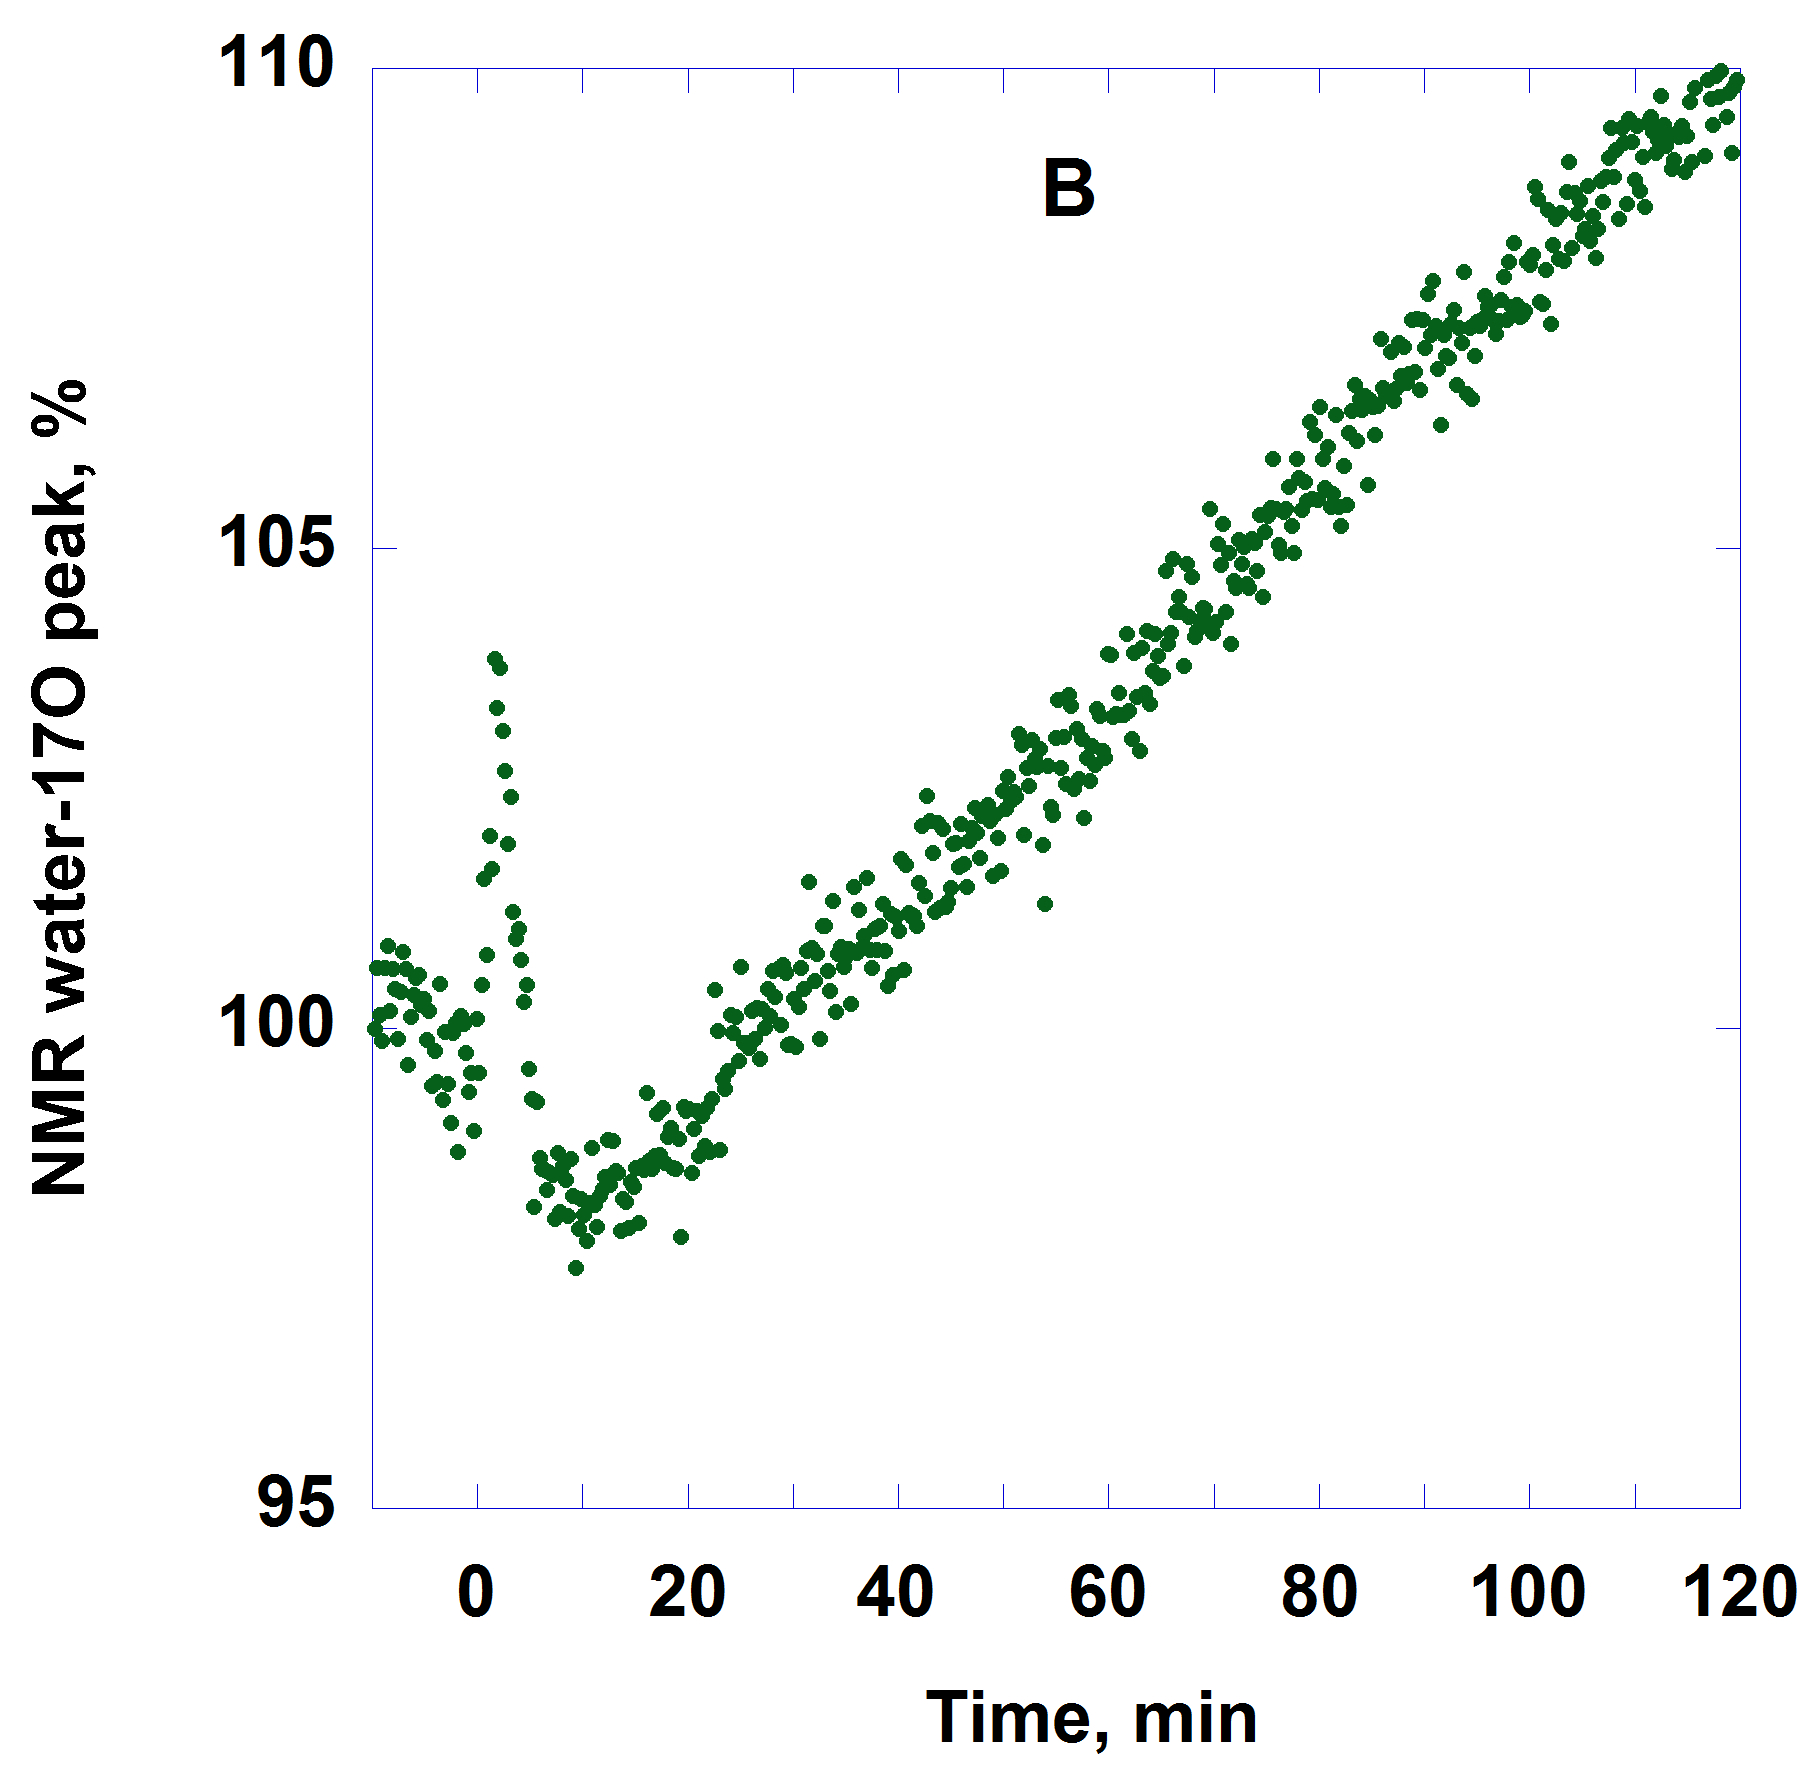
Experiments with glucose-6-17O labeled glucose were conducted allowing measurements of glucose consumption without prior determination of CBF 3. Glucose consumption was determined by changes of the 17O-water signal. The same MR experiments permitted monitoring changes in the concentration of glucose through direct observation of the glucose-6-17O MR signal peak positioned separately at -12.3 ppm relative to the 17O water peak. The direct detection of glucose-17O in rat head demonstrates a large change of glucose concentration during the first hour after the bolus injection (Fig. 1, 2). These changes could be up to four times or more when glucose is distributed evenly around the rat body. At the same time, the level of the metabolized 17O-water was steadily increasing almost linear with the rate of (0.14 ± 0.02 %/min) relative to the natural concentration of 17O water (20.7 mM). This rate of metabolized water increase is represents the rate of glucose consumption CMRglc = 0.43 ± 0.06 mmol/g tissue/min. The observed steady rate of CMRglc during the alteration of the glucose dose and the concentration in each experiment correlate with the observations of others specifying that glucose-6-phosphate (G-6-P) does not accumulate in hyperglycemia 1. The hexokinase that drives glucose phosphorylation only in one direction can serve as a gate. It can be inhibited by the excess amount of G-6-P, which eventually can limit glucose consumption. Additional note: a complex calculation of the CMRglc performed for mice 2 of 0.07 μmol/g tissue/min looks incorrect. Our calculations by using a simple model 3 and the data from the mice experiments 2 gives CMRglc = 0.62 μmol/g tissue/min.Conclusion
The rate of glucose metabolism in normal rats is consistent during dose variations of the injected glucose and alterations of glucose concentration after bolus injection. The phosphorylation of glucose by hexokinase could be a limiting factor for glucose availability during hyperglycemia or during application of the excessive amount of glucose.Acknowledgements
The study was performed at the National High Magnetic Field Laboratory (Tallahassee) supported by NSF, grant No. DMR-115490. Many thanks to Richard Desilets, Ashley Blue, Jason Kitchen, Steven Ranner, Peter Gor’kov and William Brey for their valuable help with RF probes.References
1. Siesjo BK, Brain Energy Metabolism, 1978, John Wiley & Sons, Ltd.
2. Borowiak R, Reichardt W, Kurzhunov D, et al. Initial investigation of glucose metabolism in mouse brain using enriched 17O-glucose and dynamic 17O-MRS. NMR in Biomedicine, 2017; 30(8): e3724.
3. Fiat D, Kang S. Determination of the rate of cerebral oxygen consumption and regional cerebral blood flow by non-invasive 17O in vivo NMR spectroscopy and magnetic resonance imaging. Neurological Research, 1993; 15(7): 7-22.
Figures