4220
Separation of Intracellular and Extracellular Metabolites during Glucose Fermentation using Diffusion-Weighted Deuterium (2H) Spectroscopy1Medical Biophysics, University of Toronto, Toronto, ON, Canada, 2Physical Sciences Platform, Sunnybrook Research Institute, Toronto, ON, Canada, 3GE Healthcare, Toronto, ON, Canada
Synopsis
In cancer, high extracellular lactate concentrations are associated with tumour aggressiveness, immune evasion and metastatic potential. We show that diffusion-weighted STEAM 2H-MRS of deuterium-enriched substrates can differentiate between intracellular and extracellular metabolites. Experiments in a model yeast system show the feasibility of detection of intracellular ethanol accumulation, produced via anaerobic fermentation of deuterium enriched glucose. These studies show potential to improve the capability of 2H-MRS for assessment of tumour aggressiveness.
Introduction
A hallmark of cancer is aberrant glucose metabolism and an acidic extracellular environment, caused in part due to high glycolytic rates and lactate efflux. Elevated extracellular lactate concentrations are associated with tumour aggressiveness, immune evasion and metastatic potential. Detection of lactate within different microscopic environments would be useful for characterizing tumour aggressiveness.
Recently, the feasibility of in vivo metabolic imaging of [3-2H]lactate produced from glycolysis of [6,6’]2H2 glucose has been demonstrated [1,2]. In this abstract, we investigate the feasibility of using diffusion-weighted 2H-MRS to differentiate between intracellular and extracellular ethanol, produced via anaerobic fermentation of deuterium enriched glucose, in a model yeast system [3].
Methods
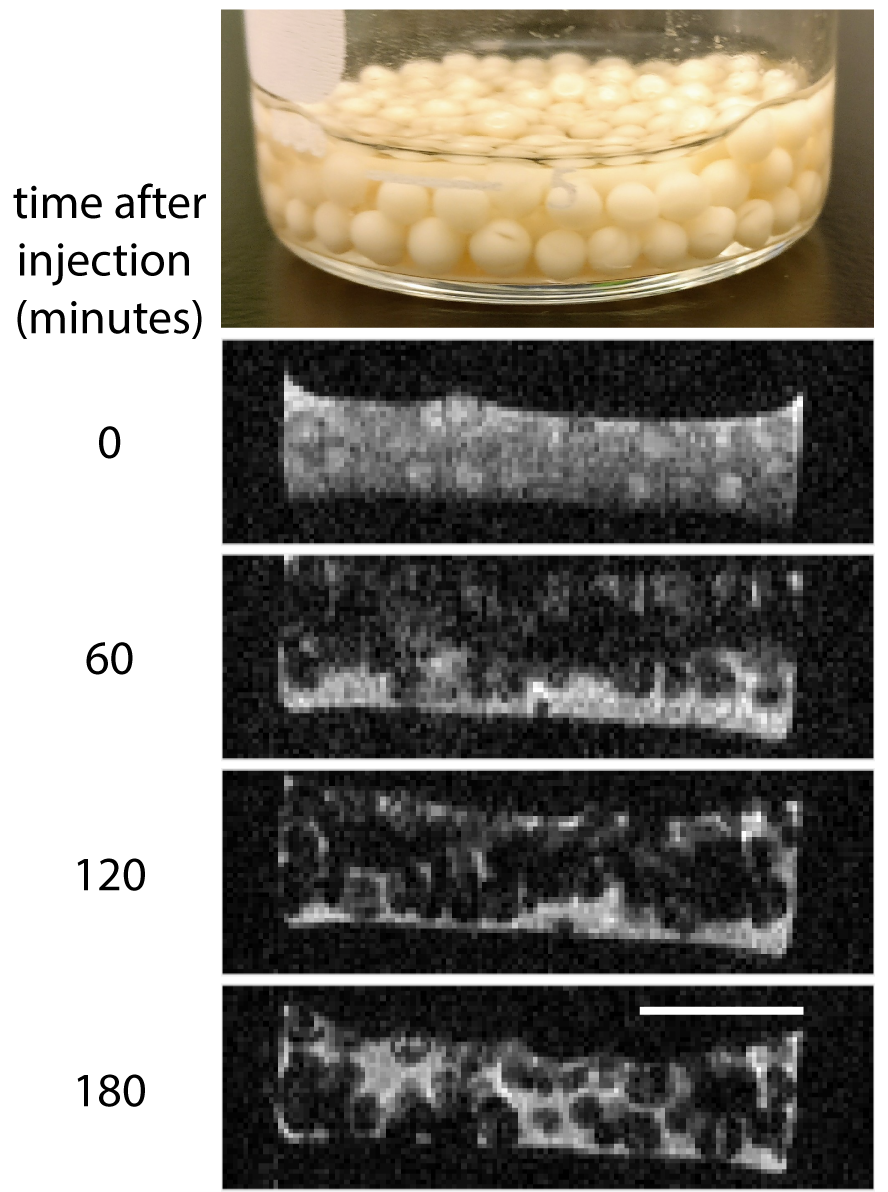
Cell preparation. Baker’s yeast cells (S. cerevisiae) were immobilized using alginate encapsulation (Figure 1) [4]. A yeast suspension was prepared by mixing 4 g dry yeast into 20 mL of warm deionized water. 0.4 g of sodium alginate was then dissolved into 20 mL deionized water (concentration 90 mM), allowed to cool to room temperature, and mixed with the yeast suspension. Uniform spheres of alginate encapsulated yeast (mean diameter 2.65±0.08 mm) were formed by extrusion through a 22 gauge needle into 0.15 M CaCl2. After rinsing the spheres in water, 3 g of spheres (containing 300 mg yeast dry weight) were suspended in water. 500 mg [6,6’]2H2-glucose (CIL) was dissolved in 1 mL of deionized water and added to the suspension. The final suspension volume was 5 mL with an initial deuterium enriched glucose concentration of 500 mM.
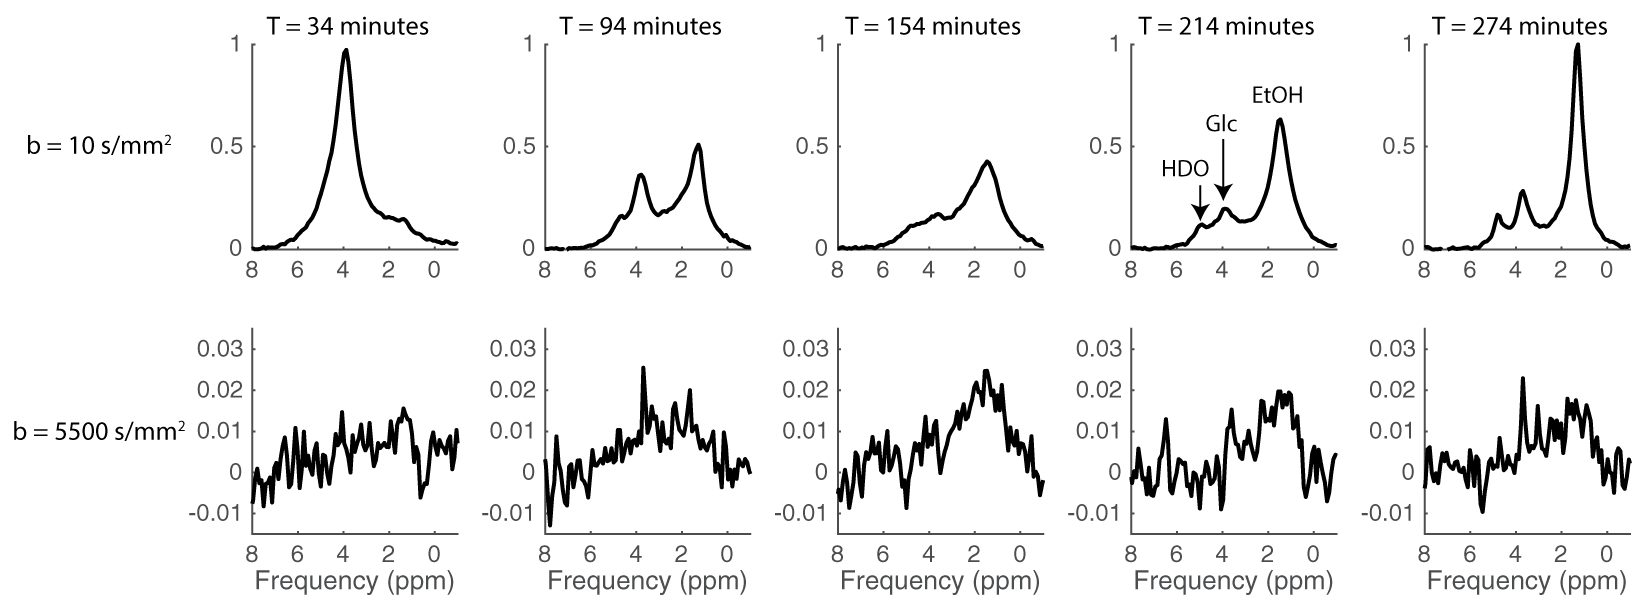
MR scans. All MR experiments were performed at 7T (Bruker). A home-built 2H transmit/receive surface coil (46.1 MHz, 20 mm diameter) with proton blocking was used for acquiring the 2H signal. A diffusion-weighted STEAM sequence was used to obtain dynamic spectra over 8 hours (480 repetitions, TE=26 ms, TR=300 ms, 768 spectral points, 3 kHz spectral width, 200 averages, diffusion gradients δ=11ms, Δ=72ms, b-values 10, 200, 400, 600, 1000, 2000, 3000, 4000, 5000, 5500 s/mm2) [5]. Adiabatic BIR-4 90° pulses were used for excitation and refocusing (a=8, tan(b)=10, pw=1.504ms). The scan was started 10 minutes after glucose addition after B0 shimming and receiver gain adjustment. Sample temperature was measured in a separate session using a fibre optic probe while the 2H scan was running.
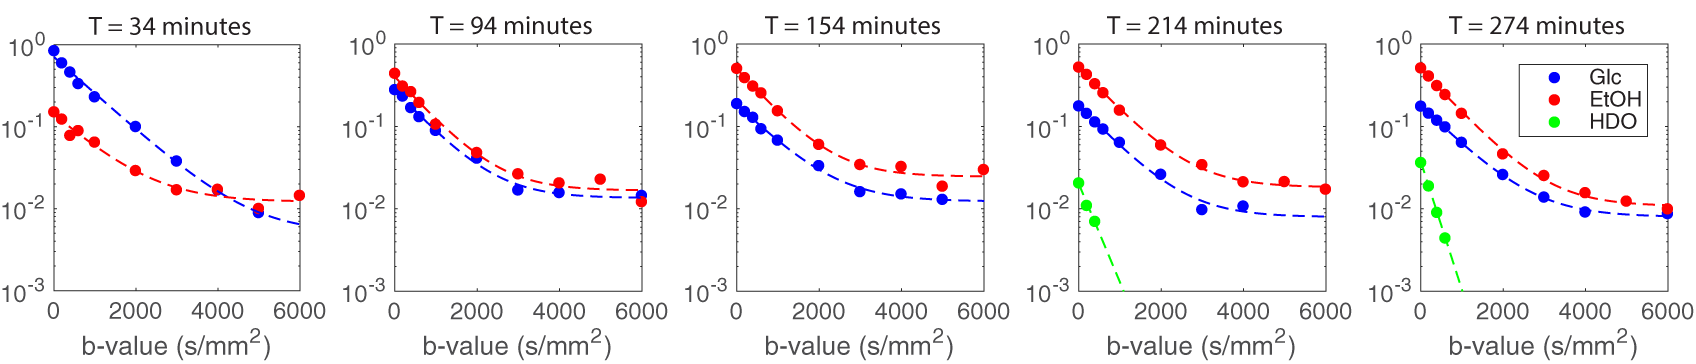
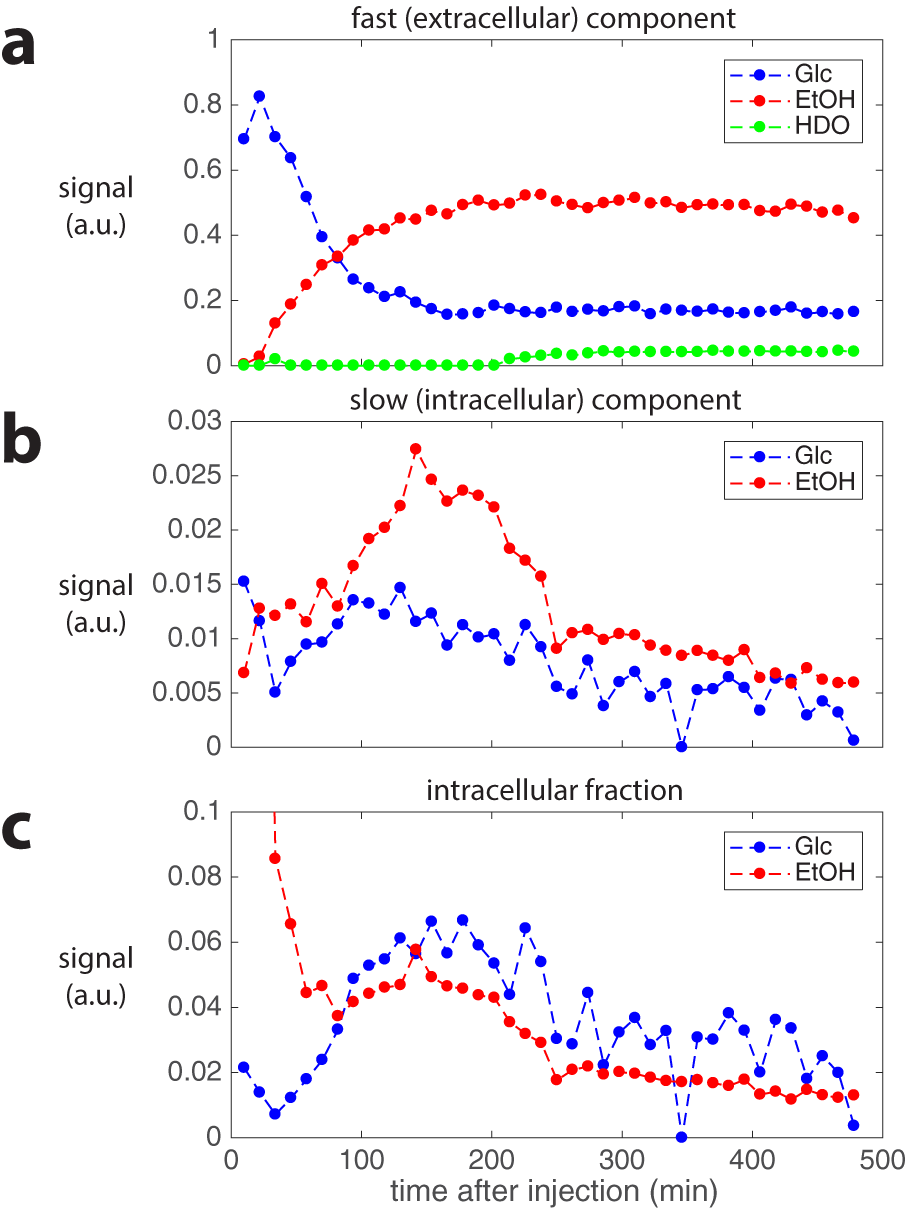
Analysis. Time domain fitting was performed using AMARES implemented in the OXSA Matlab toolbox [6,7]. The fitted peaks were deuterium-enriched glucose (3.8 ppm), ethanol (1.2 ppm), and water (4.7 ppm). A Cramer-Rao lower bound (CRLB) %SD of greater than 30% was used to reject noisy signals. Diffusion parameters were fitted using a signal model describing slow and fast diffusion (S = veexp(-bDe) + vi), fitted with data at 12 minute temporal resolution. Mono-exponential decay was used to model 2H-water diffusion. The intracellular fraction was defined as vi/(vi+ve).
Results and Discussion
Figure 2 shows dynamic diffusion-weighted 2H spectra obtained following addition of [6,6’]2H2 glucose to the yeast-sphere suspension. Increased linewidth corresponding to CO2 production is seen after 2 hours of fermentation.
Figure 3 shows diffusion parameter fits for glucose, ethanol, and water. The model agreement is consistent with restricted intracellular diffusion of glucose and ethanol during the long 72 ms mixing time (mean displacement Δx = (2Dt)0.5 = 13 μm, average yeast cell diameter 5-10 μm).
Figure 4 shows the dynamic time course for the fermentation of 2H-glucose into 2H-ethanol. The accumulation of intracellular ethanol during the early stages of fermentation, and subsequent equilibration is in agreement with previous reports [3].
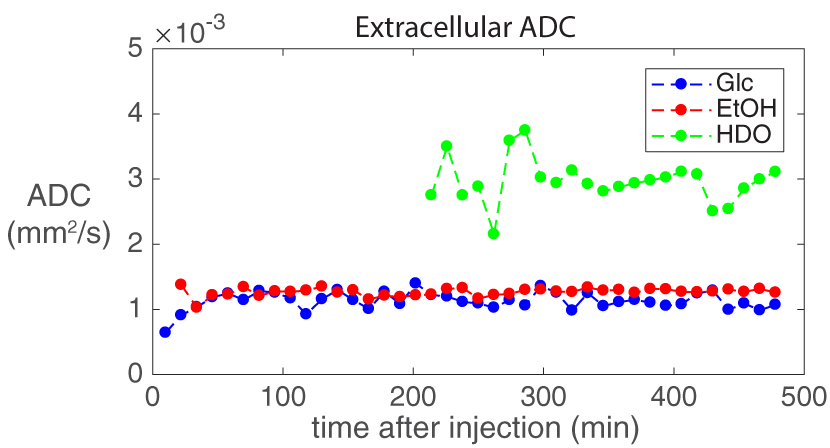
Figure 5 shows the fitted extracellular ADCs (x10-3 mm2/s) over the entire 8 hour measurement (glucose: 1.13±0.14, ethanol: 1.26±0.06, water: 2.97±0.35). The steady state temperature was 41°C, resulting from RF heating of the 5 mL sample. The measured extracellular ADC of water in the alginate-yeast encapsulates is consistent with the restricted alginate environment and diffusion of free water at this temperature (ADC at 40°C = 3.222 x 10⁻³ mm2/s) [8].
Conclusions
A 2H diffusion-weighted STEAM acquisition is used to distinguish between intra- and extracellular 2H-ethanol produced by anaerobic fermentation in yeast. We anticipate that this strategy will be useful in monitoring lactate efflux from highly aggressive tumours using 2H metabolic imaging.Acknowledgements
The authors acknowledge funding support from NSERC.References
- Lu, M., Zhu, X.-H., Zhang, Y., Mateescu, G. & Chen, W. Quantitative assessment of brain glucose metabolic rates using in vivo deuterium magnetic resonance spectroscopy. J. Cereb. Blood Flow Metab. 37, 3518–3530 (2017).
- De Feyter, H. M. et al. Deuterium metabolic imaging (DMI) for MRI-based 3D mapping of metabolism in vivo. Sci. Adv. 4, eaat7314 (2018).
- D’Amore, T., Panchal, C. J. & Stewart, G. G. Intracellular ethanol accumulation in Saccharomyces cerevisiae during fermentation. Appl. Environ. Microbiol. 54, 110–4 (1988).
- Bryer, P. J. Exploring Catalase and Invertase Activity Using Sodium Alginate-Encapsulated Yeast (Yeast Spheres). J. Microbiol. Biol. Educ. 17, 490–491 (2016).
- Van Zijl, P. C. et al. Complete separation of intracellular and extracellular information in NMR spectra of perfused cells by diffusion-weighted spectroscopy. Proc. Natl. Acad. Sci. U. S. A. 88, 3228–32 (1991).
- Vanhamme, van den Boogaart A & Van Huffel S. Improved method for accurate and efficient quantification of MRS data with use of prior knowledge. J. Magn. Reson. 129, 35–43 (1997).
- Purvis, L. A. B. et al. OXSA: An open-source magnetic resonance spectroscopy analysis toolbox in MATLAB. PLoS One 12, e0185356 (2017).
- Holz, M., Heil, S. R. & Sacco, A. Temperature-dependent self-diffusion coefficients of water and six selected molecular liquids for calibration in accurate 1H NMR PFG measurements. Phys. Chem. Chem. Phys. 2, 4740–4742 (2000).
Figures