4217
Novel chemosensory application of 1H and 13C NMR metabolomics in medicinal plants of nutritional value1Department of NMR, All India Institute of Medical Sciences, New Delhi, India
Synopsis
With increasing incidences of diet and nutrition related diseases, objective evaluation of the chemosensory property of taste has gained significance. In this study, aqueous extracts of select medicinal plants of nutritional value (n=72) from five chemosensory groups were studied using proton and carbon NMR spectroscopy. Partial Least Square Discriminant Analysis of 1H and 13C spectral data have shown chemosensory based differentiation. Examples of targeted metabolomics aided identification of chemosensory markers are: β-glucose (sweet), phenylalanine (bitter), gallic acid (astringent) and citric acid (sour). NMR phytometabolomics can be used as a magnetic tongue in deciphering the role chemosensory phytomarkers in nutrition science.
Introduction
Chemosensory property such as taste is widely studied and yet poorly understood. Given the importance of taste in nutrition science and its interesting role in pharmacology, there is increasing interest in its objective evaluation.1,2 Although the scope of nutritional science generally remains limited to dietary plants, attention is now drawn to nutritional values of medicinal plants as well. This has great relevance in the context of increasing diet and nutrition related diseases such as obesity, diabetes and hypertension. This study has explored the use of proton and carbon NMR metabolomics as a magnetic tongue in medicinal plants with nutritional value. Polar compounds being key contributors in the chemosensory property of taste, aqueous extracts of medicinal plants were studied.Materials and Methods
Sample preparation: Seventy two authentic medicinal plants from five chemosensory categories (sweet, astringent, bitter, pungent and sour) were selected for the study. For example, sweet - Phoenix sylvestris, Musa paradisiaca; bitter - Andrographis paniculata, Gymnema sylvestris; pungent - Brassica juncea, Cuminum cyminum; astringent - Terminalia bellerica, Ficus bengalensis; sour - Citrus medica, Tamarindus indica. Aqueous extracts of plant samples were prepared using the method of cold maceration, filtered and lyophilized.
NMR studies: The lyophilized powder was dissolved in D2O and 1D proton NMR spectra were acquired at 700 MHz (Agilent, USA): relaxation delay - 14 sec; scans - 64; spectral width - 12 ppm; data points - 32 K. Acquisition parameters for 13C NMR: relaxation delay - 1 sec; scans - 20,000; spectral width - 250 ppm; data points - 32 K. Deuterated TSP in a coaxial insert served as the reference.
Data analysis: NMR spectra were binned and bucketed at intervals of 0.04 ppm (Mnova 10.0, Mestrelab Research) for both targeted and untargeted metabolomics (Metaboanalyst 4.0). Partial Least Square Discriminant Analysis (PLS-DA) was used for untargeted analysis. For the targeted study, peaks influencing the variability between the groups (p value < 0.05) were identified from the loading plots and Variable Importance in Projection (VIP) scores analysis. Peak assignments were carried out using NMR data libraries.3,4
Results
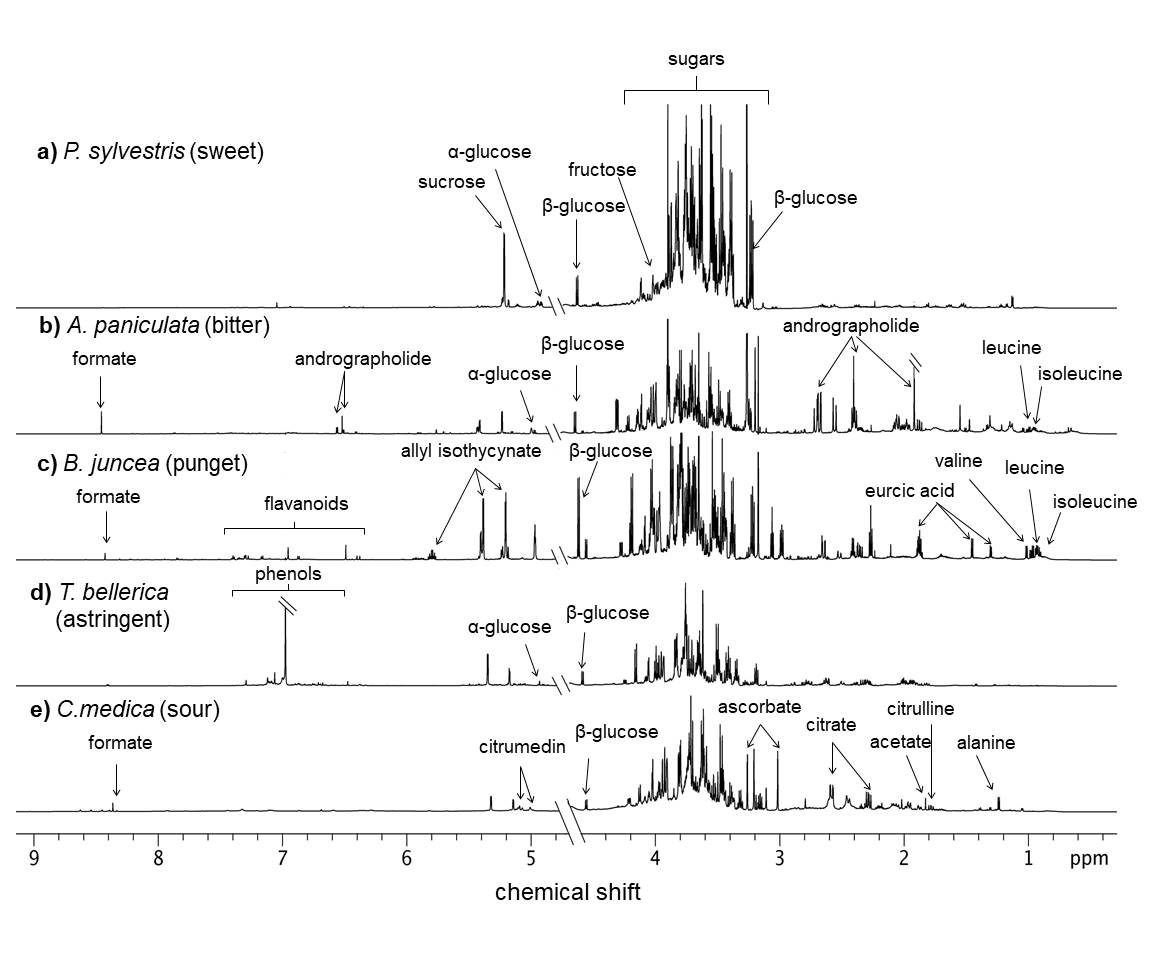
Figures 1a-1e show representative 1H spectra of plants from different chemosensory categories. The peaks can be broadly classified under primary [amino acids (0.9-3.5 ppm), sugars (3.5-5.5 ppm)] and secondary metabolites (6-9 ppm).
Untargeted metabolomics:
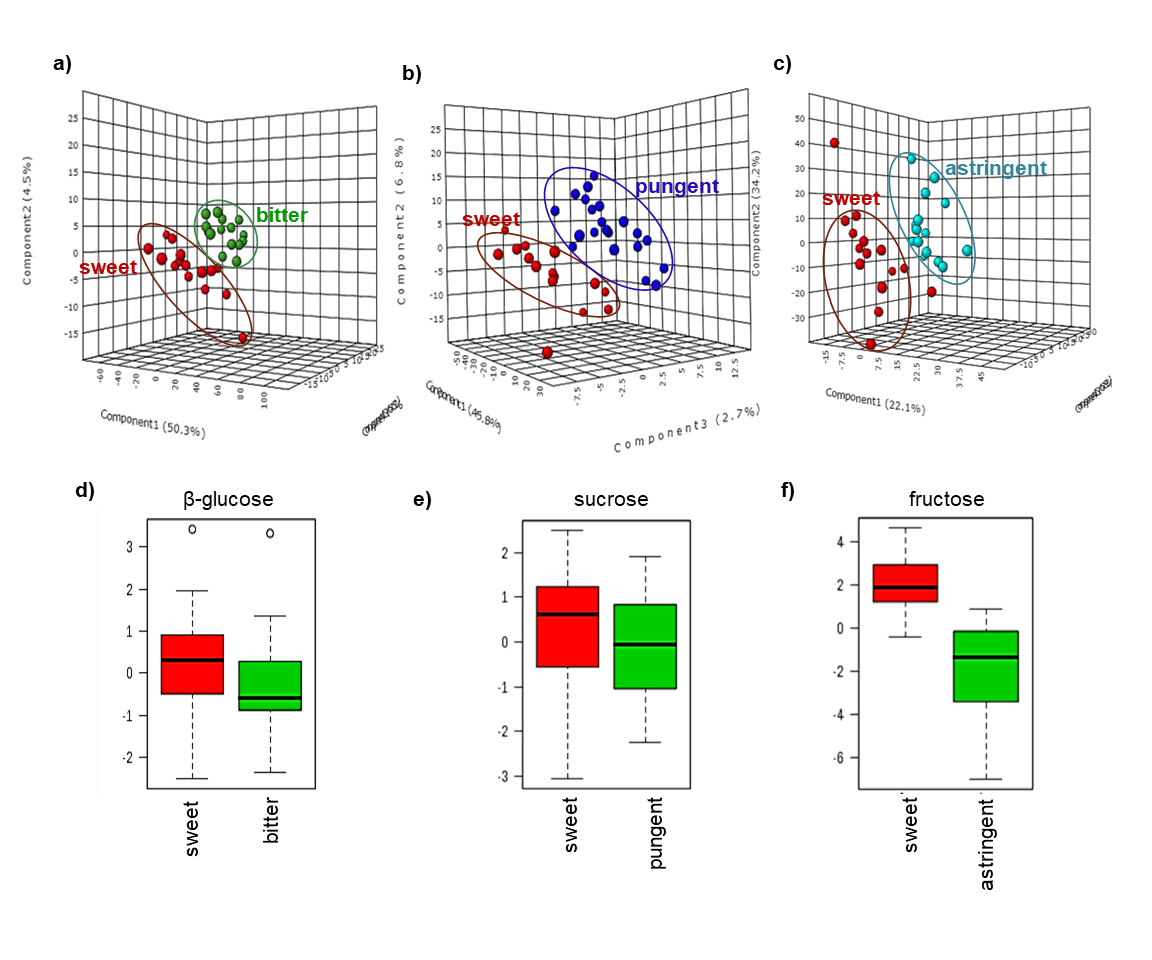
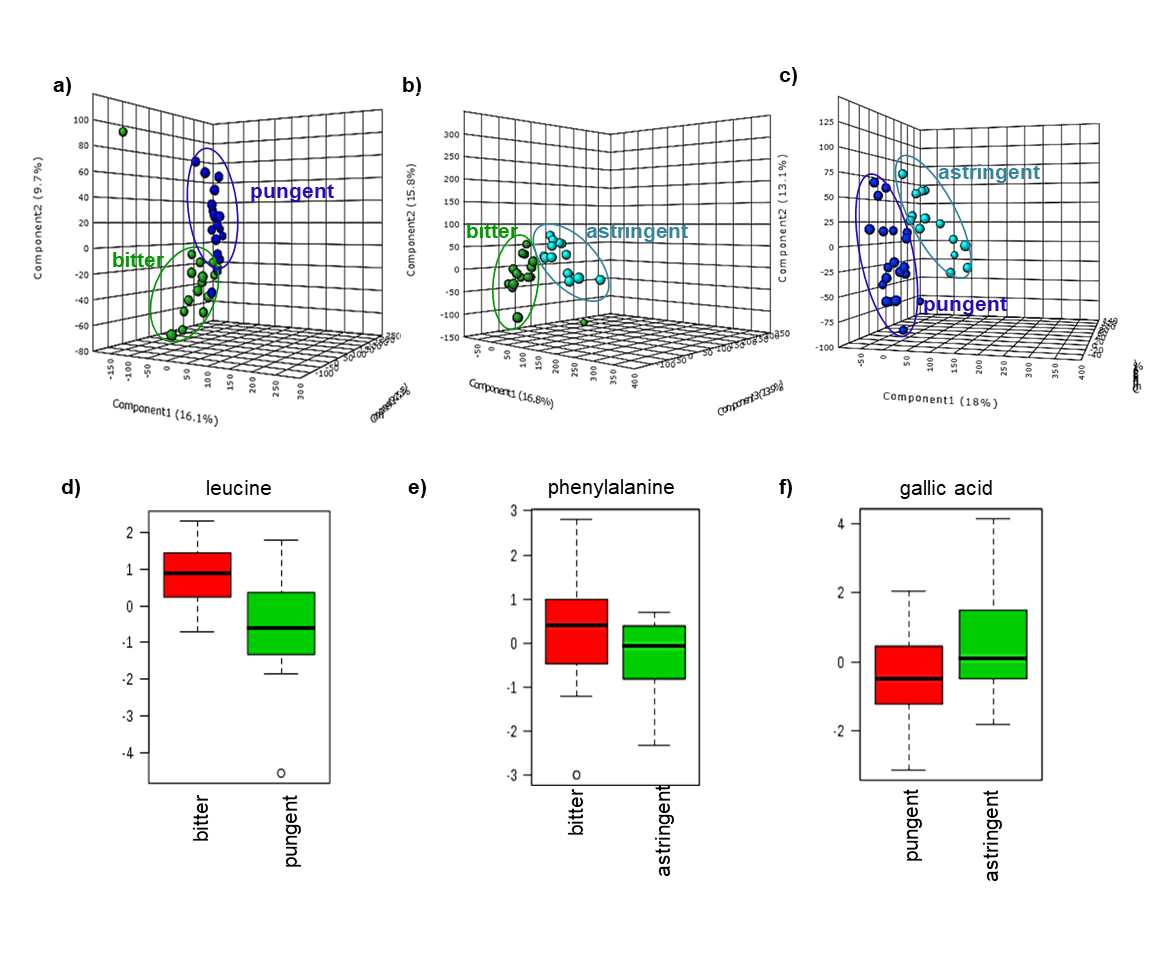
i) PLS-DA differentiated between plants based on their chemosensory property: sweet and other groups (Figs. 2a-2c); bitter and pungent (Fig. 3a); bitter and astringent (Fig. 3b); pungent and astringent (Fig. 3c), and also sour and other groups.
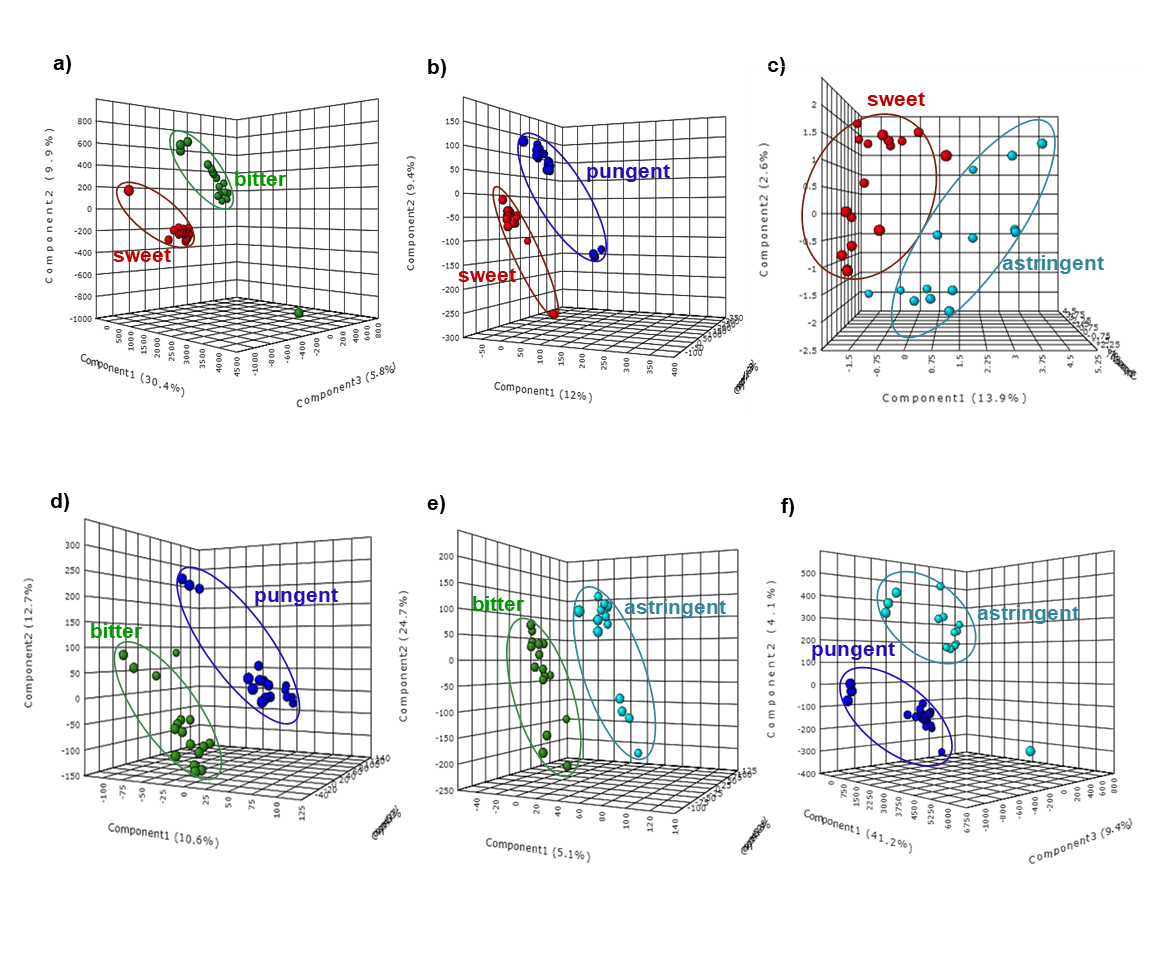
ii) 13C NMR data (Figs 4a-4f) not only supported the chemosensory differentiation by 1H NMR but also showed better clustering due to variations in the carbon skeleton of phytocompounds and significantly less signal overlap.
Targeted metabolomics - chemosensory phytomarkers:
Representative examples of chemosensory phytomarkers identified from loading and VIP score plots are shown as box-cum-whisker plots in Figs. 2(d-f) and 3(d-f). The following are some of the identified phytomarkers:
i) Sweet vs bitter: β-glucose (Fig. 2d); Sweet vs pungent: sucrose (Fig. 2e); Sweet vs astringent: fructose (Fig. 2f)
ii) Bitter vs pungent: leucine, isoleucine and phenylalanine (Fig 3d)
iii) Bitter vs astringent: phenylalanine, leucine and isoleucine (Fig 3e)
iv) Pungent vs astringent: gallic acid, ellagic acid and tannic acid (Fig 3f)
v) Sour vs other taste groups: citric, acetic and ascorbic acids
Conclusion
Chemosensory properties are associated with diet and nutrition, and known to play a key role in nutrition science. Growing awareness about diet and nutrition related diseases underlines the need to study the chemosensory properties objectively. This study has shown that both proton and carbon NMR metabolomics can differentiate medicinal and nutritional plants based on their chemosensory property of taste. Identification of key chemosensory phytomarkers like β-glucose (sweet), phenylalanine (bitter), gallic acid (astringent) and citric acid (sour) can throw more light on this well-known but little understood parameter of taste. Both targeted and untargeted NMR phytometabolomics can play an important role in unraveling the role of phytochemicals in chemosensory property and nutrition scienceAcknowledgements
No acknowledgement found.References
1. van Dongen MV, van den Berg MC, Vink N, et al. Taste-nutrient relationships in commonly consumed foods. Br J Nutr. 2012, 108: 140-147.
2. Kakeda T, Ogino Y, Moriya F, et al. Sweet taste-induced analgesia: an fMRI study. Neuroreport. 2010, 21: 427-431.
3. Wishart DS, Jewison T, Guo AC, et al. HMDB 3.0 - The Human Metabolome Database in 2013. Nucleic Acids Res. 2013, 41: D801-D807.
4. Deborde C, Jacob D. MeRy-B, a metabolomic database and knowledge base for exploring plant primary metabolism. Methods Mol Biol. 2014, 1083: 3-16.
Figures