4213
Sodium MRI allows detecting an enhanced sodium concentration in muscles of volunteers following a high salt diet1Service of Nephrology and Hypertension, Lausanne University Hospital (CHUV), Lausanne, Switzerland, 2Center for Biomedical Imaging (CIBM), Lausanne, Switzerland
Synopsis
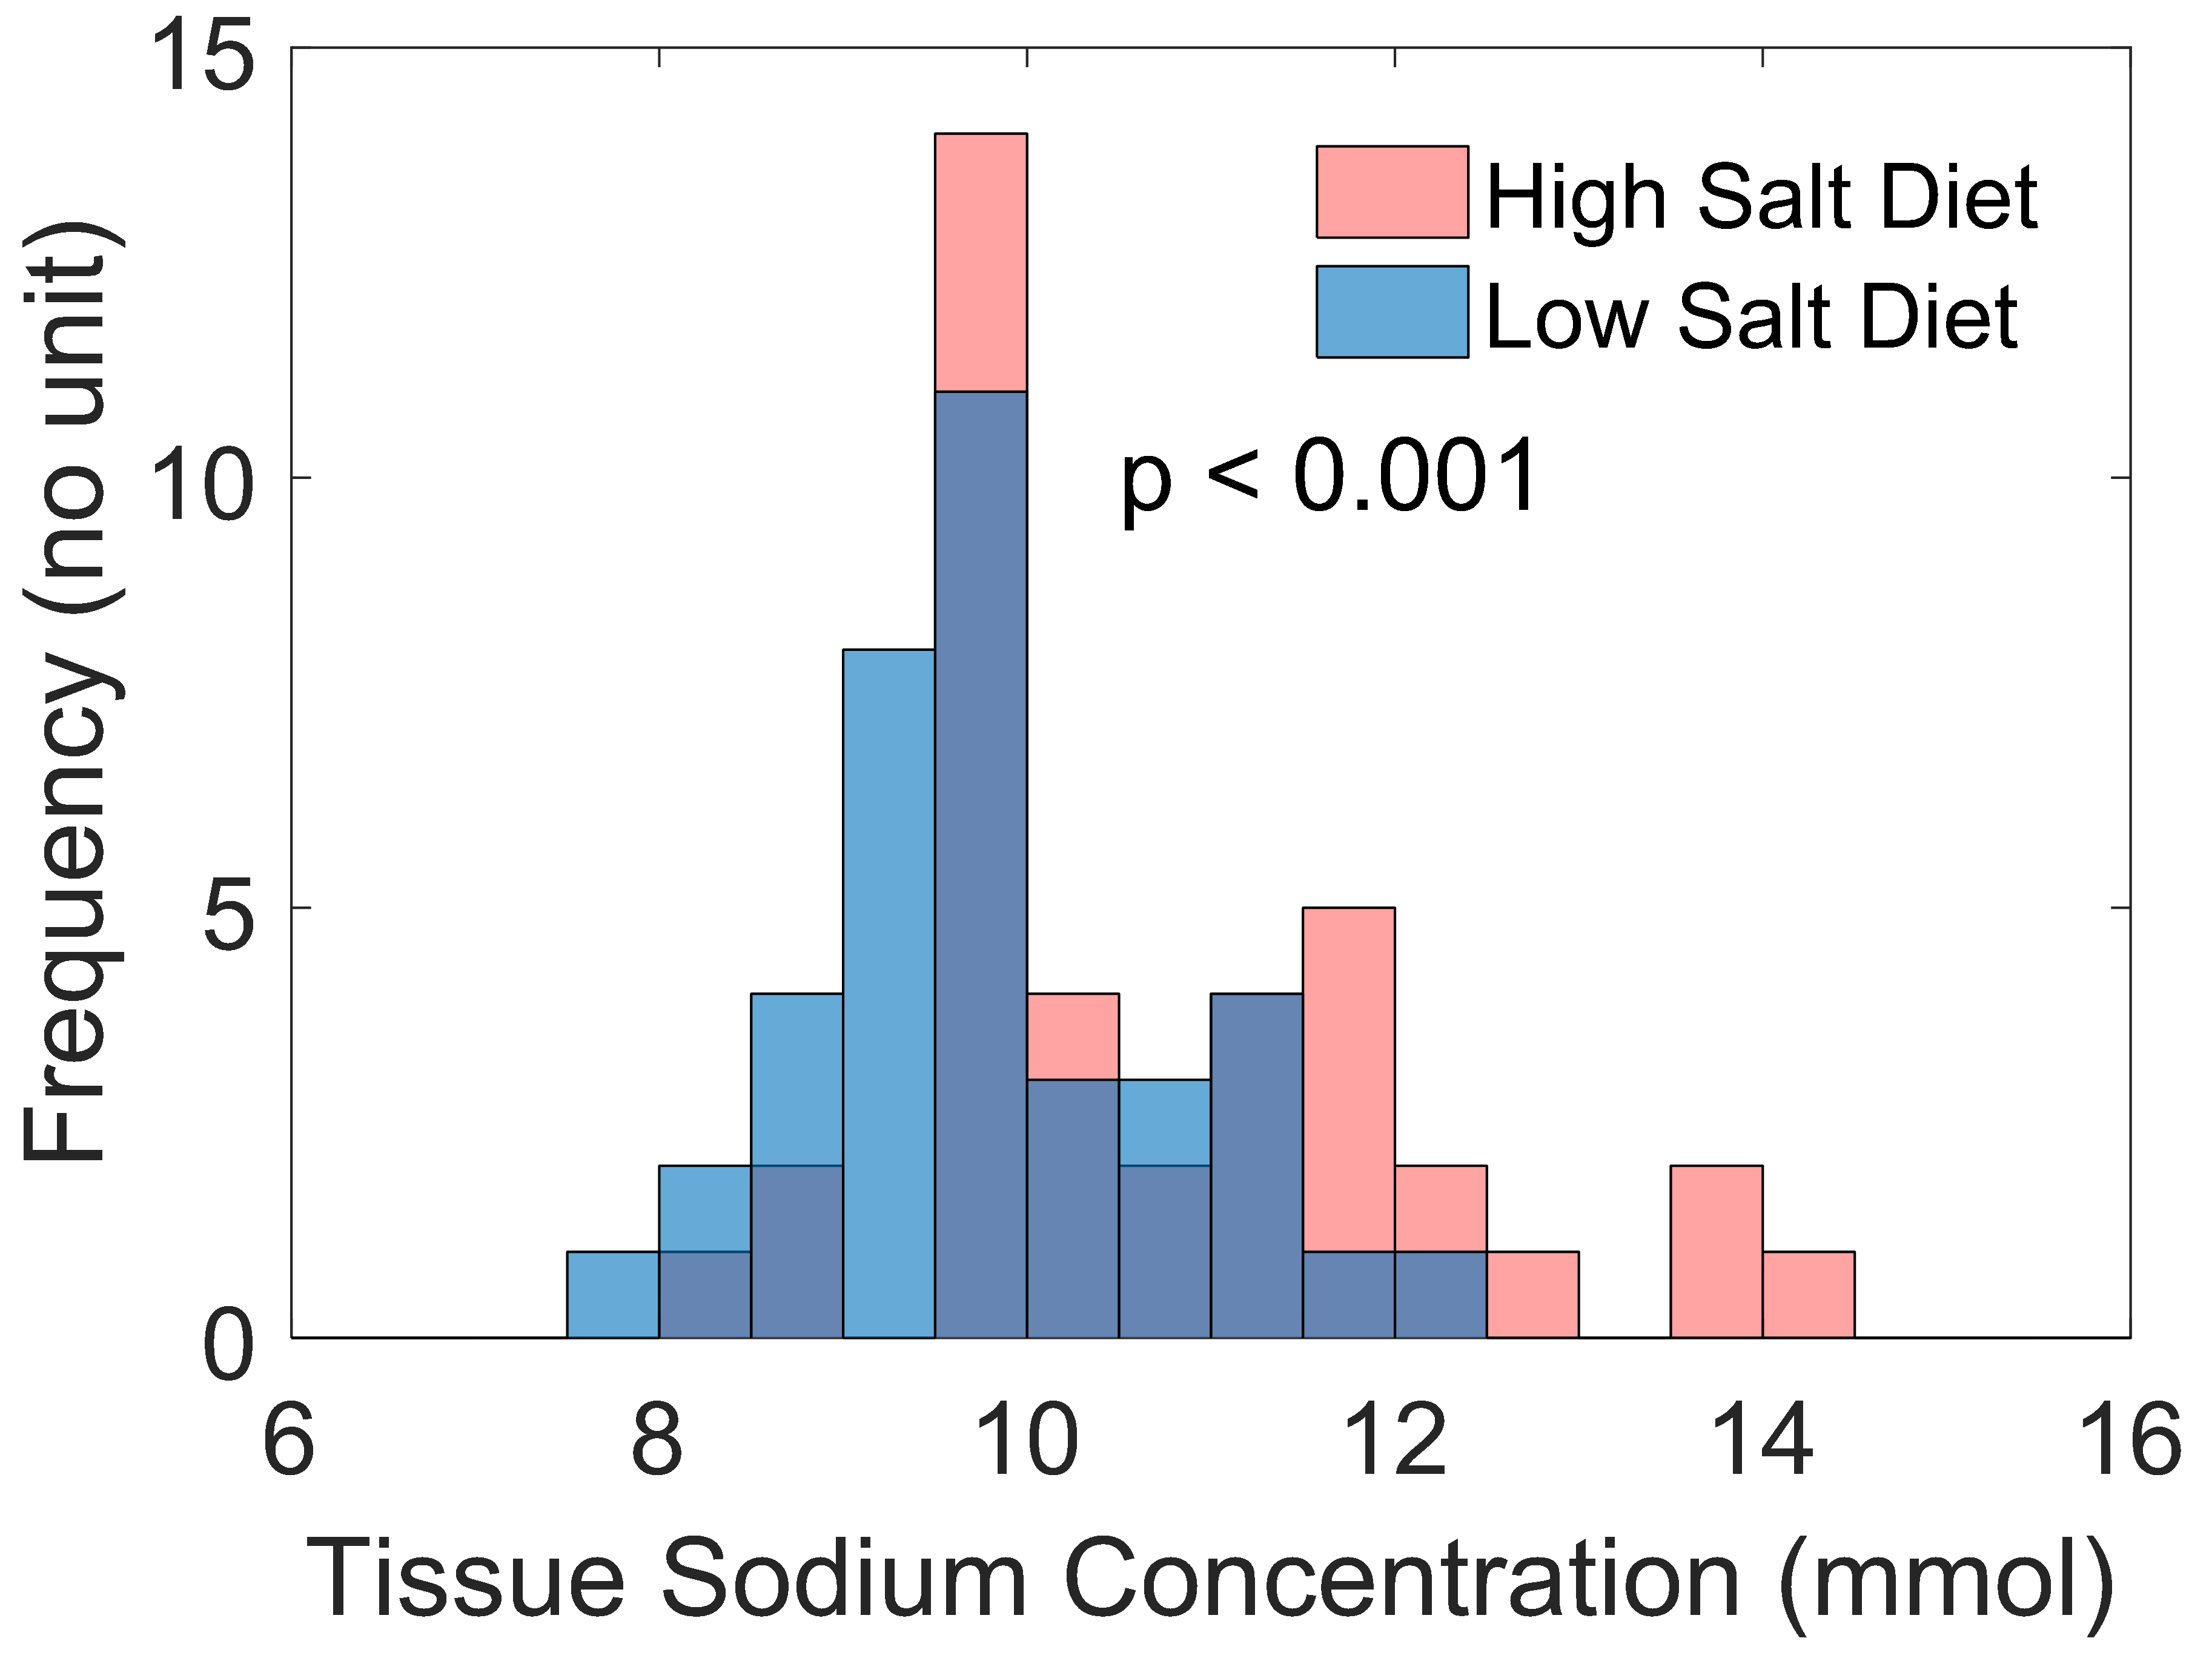
The presented study shows by the mean of sodium MRI that the sodium content of the leg muscles of healthy volunteers is higher when following a high salt diet than when following a low salt diet. To our knowledge, this is the first study reporting that fact.
Introduction
The interest in sodium-23 magnetic resonance imaging (NA-MRI) is quickly growing as a way to assess sodium storage in skin and muscles in different disease states1-5. It has however never been investigated if these sodium stores are influenced by diet. We assessed whether healthy volunteers following a high salt diet (HSD) present a higher tissue sodium concentration (TSC) in muscles as compared to a low salt diet (LSD).Methods
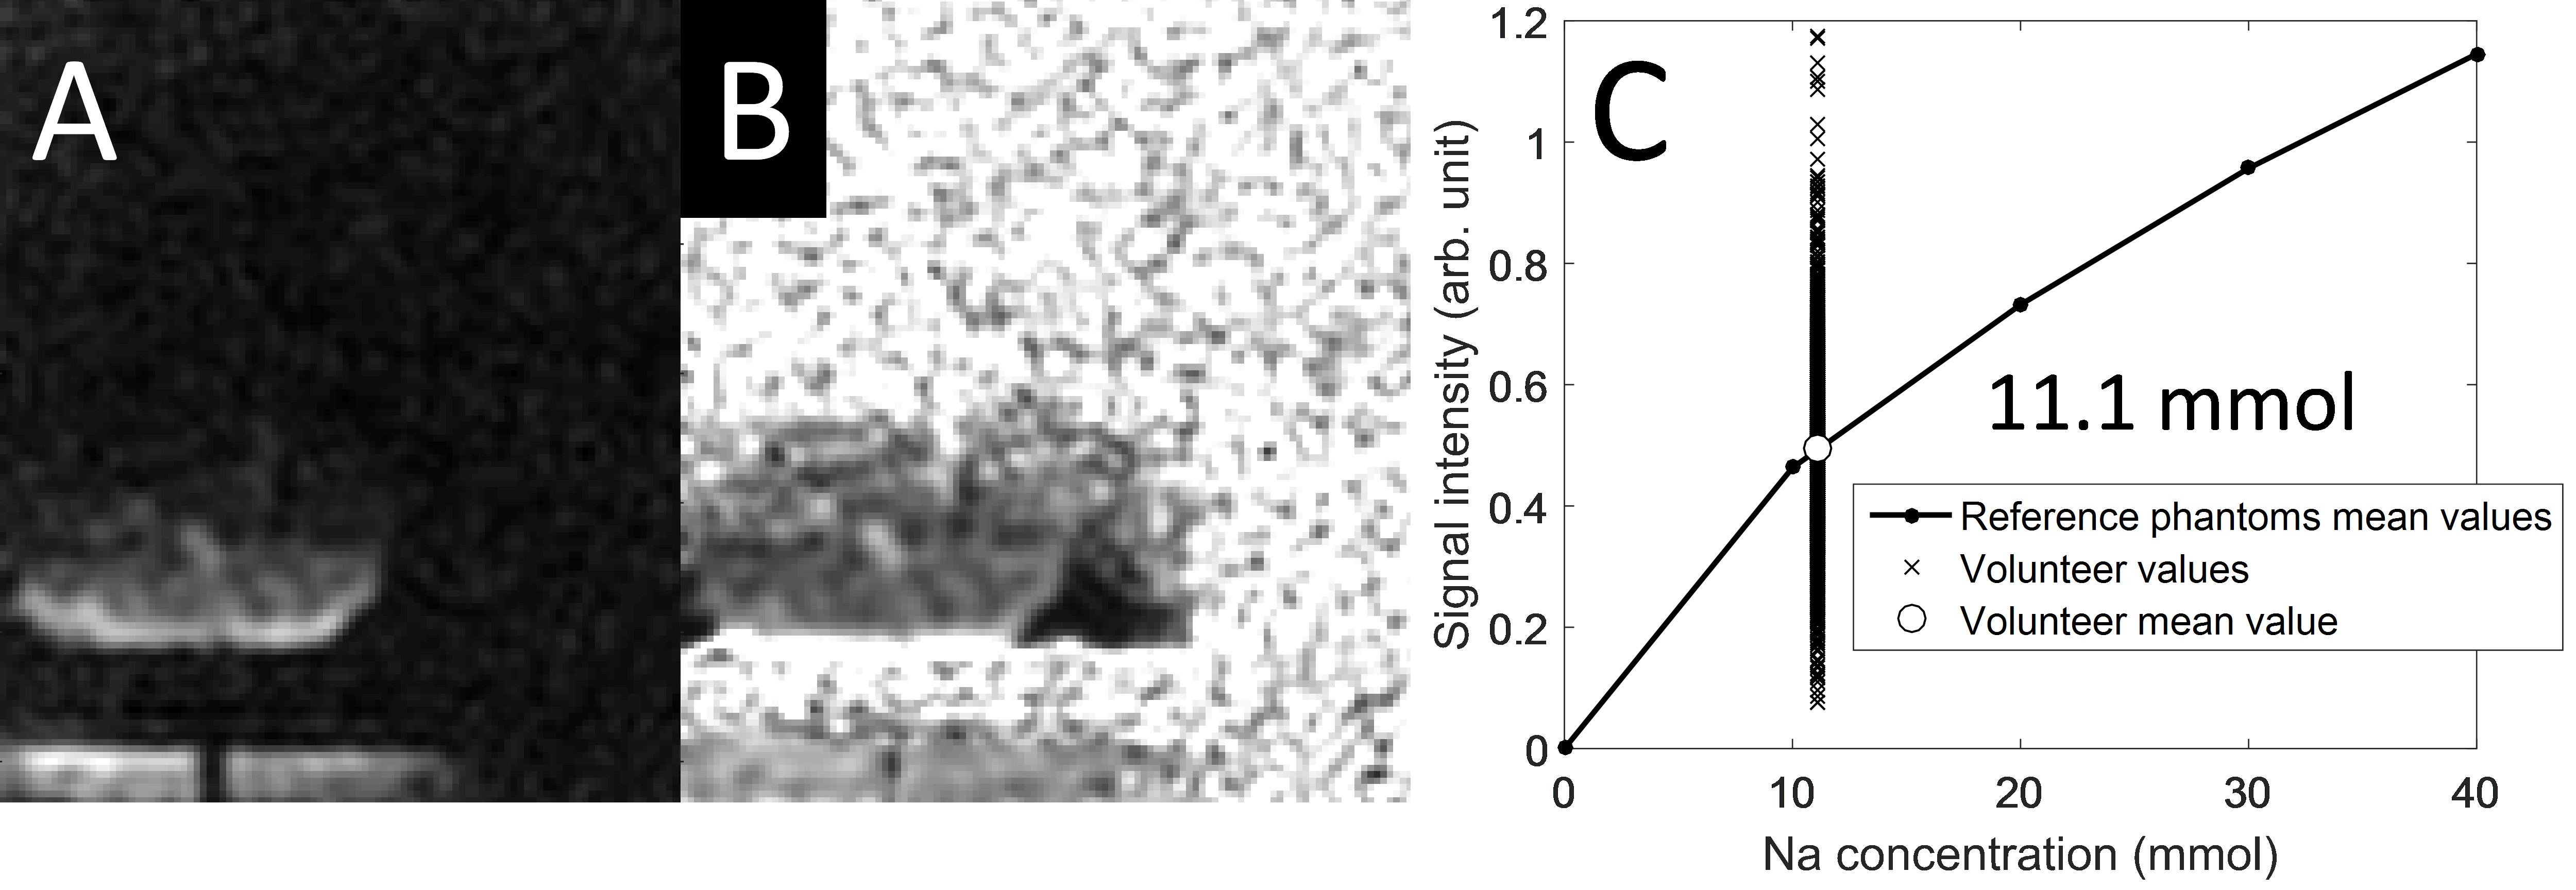
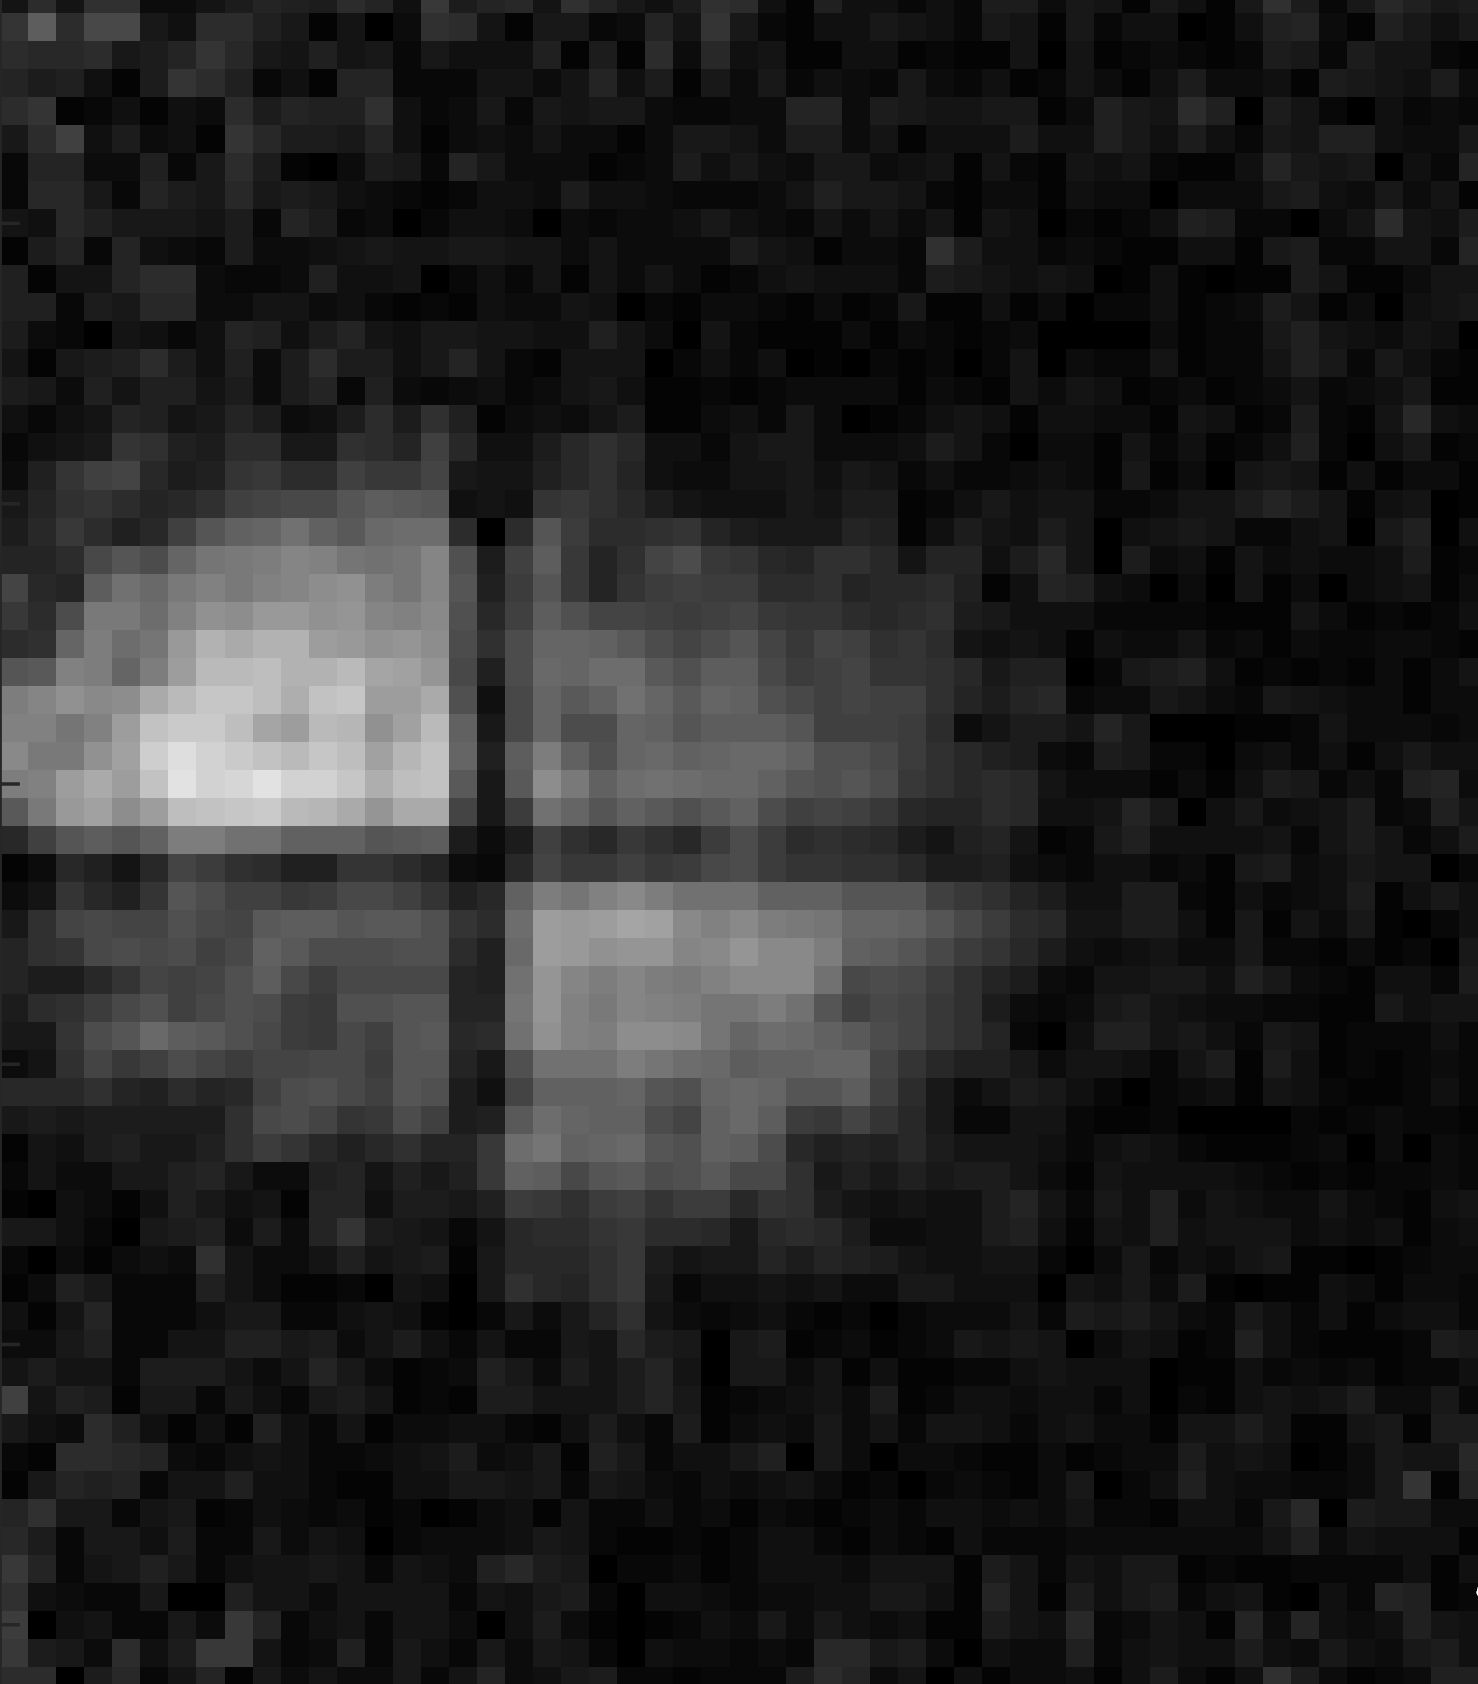
TSC of the right leg muscles of 38 healthy volunteers (aged 33.5 ± 11.1 years) was assessed with NA-MRI two times: first after 5 days HSD (6 g of salt added to the normal diet) and second after 5 days LSD (obtained by dietary instructions). Magnetic resonance imaging was performed with a sodium tuned surface coil and with a set of four square, symmetrically arranged reference phantoms. The MRI session consisted of a turbo spin echo sequence to acquire anatomical images, followed by a 3-dimensional radial sequence adapted for sodium with an ultra short echo time (TE = 0.197 ms).Results
Muscle TSC was significantly higher after HSD than after LSD (mean ± SD equal to 10.7 ± 1.3 mmol vs. 9.8 ± 1.0, p < 0.001). Figure 1 displays two histograms: the TSC values after HSD (red) and those after the LSD (blue). Figure 2A displays a sodium image of a leg without correction of the transmit field inhomogeneities and without correction of the coil sensitivity. Figure 2B displays the same image with the corrections. Figure 2C illustrates the transformation of the signal intensity into a sodium concentration using the reference phantoms. Figure 3 is a coronal plan of a 3-dimensional sodium image which displays the four reference phantoms.Conclusions
This is the first study that demonstrates with non-invasive NA-MRI that the tissue sodium concentration of muscles is higher after a high salt diet than after a low salt diet.Acknowledgements
No acknowledgement found.References
1. Kopp C, Linz P, Wachsmuth L, et al. (23)Na magnetic resonance imaging of tissue sodium. Hypertension. 2012;59(1):167-72.
2. Kopp C, Linz P, Dahlmann A, et al. 23Na magnetic resonance imaging-determined tissue sodium in healthy subjects and hypertensive patients. Hypertension. 2013;61(3):635-40.
3. Dahlmann A, Dorfelt K, Eicher F, et al. Magnetic resonance-determined sodium removal from tissue stores in hemodialysis patients. Kidney Int. 2015;87(2):434-41.
4. Hammon M, Grossmann S, Linz P, et al. 3 Tesla (23)Na magnetic resonance imaging during aerobic and anaerobic exercise. Acad Radiol. 2015;22(9):1181-90.
5. Linz P, Santoro D, Renz W, et al. Skin sodium measured with (2)(3)Na MRI at 7.0 T. NMR Biomed. 2015;28(1):54-62.
Figures