4210
Neuronal energy metabolism in the mouse brain measured by 1H-[13C] MRS at 14.1T under [3-13C]-Lactate infusion: a feasibility study1Laboratory of Functional and Metabolic Imaging, Ecole Polytechnique Fédérale de Lausanne (EPFL), Lausanne, Switzerland, 2Center for Biomedical Imaging (CIBM), Ecole Polytechnique Fédérale de Lausanne (EPFL), Lausanne, Switzerland, 3Faculty of Medicine, University of Geneva, Geneva, Switzerland
Synopsis
In this study, the feasibility of studying neuronal energy metabolism in the mouse brain in vivo under [3-13C]-Lactate infusion, measured by 1H-[13C] MRS at high magnetic field was evaluated. Brain tissue [3-13C]-Lactate enrichment and the turnover of its metabolic products were measured dynamically. Glutamate and glutamine C4 as well as glutamate+glutamine C3 were used as input to a one-compartment metabolic model of the neuronal TCA cycle and glutamate-glutamine cycle, enabling a comparison with previously reported values of metabolic fluxes in the mouse brain under infusion of other labeled substrates.
Introduction
In vivo 13C Magnetic Resonance spectroscopy (MRS) in conjunction with the administration of 13C labeled substrates provides a unique tool to assess cerebral metabolism non-invasively. Lactate is a molecule of particular interest for its potential role as neuronal energy substrate. The aim of this study was to demonstrate the feasibility of indirect 1H-[13C]-MRS to characterize13C turnover curves of cerebral lactate C3, alanine C3, glutamate and glutamine carbon positions and other labeled amino acids in the mouse brain at 14.1T following brain uptake and metabolism of infused [3-13C]-lactate (Lac) and subsequently determine brain metabolic rates.Methods
All adult C57/BL6 (4 males and 2 females, 25.5±2.2g) were studied according to the local animal experimental guidelines and approved by the federal authorities.
MRS experiments were performed on a 14.1T magnet with a 26cm horizontal bore (Varian/Magnex) using a home-built 1H surface coil in quadrature (two 9mm inner diameter loops) combined with a linear 13C coil (9mm diameter) as transceiver. In order to increase 13C measurement sensitivity, a localized proton-detecting carbon-editing sequence, i.e. BISEP-SPECIAL (1 and references therein) was used. B0 homogeneity was optimized using first- and second-order shimming with FAST(EST)MAP (2), resulting in water linewidth of 25-30 Hz for a detection volume of 96µL (5.5×3.5×5 mm3). 13C-edited and non-edited spectra were acquired with 8-scan blocks in an interleaved mode (TE/TR=2.8/4000ms) during the entire infusion experiment.
[3-13C]lactate injection bolus dosage was calculated to reach 10% fraction enrichment (FE)
based on the brain lactate level measured from the baseline acquisition
without 13C-editing. A step-wise
exponential decaying
bolus
was given in 15 minutes with five consecutive rate steps of 3 minutes and thereafter
followed by a continuous administration of a [3-13C]-lactate
solution (10% w/v 99% isotopic enrichment) mixed with 20% w/v unlabeled glucose and pH
adjusted to 7. Thereafter, lactate infusion rate was continuously adjusted by visual estimation of the Lac C3 enrichment.
After frequency correction, every ten blocks (80 averages) of 13C-inverted and non-13C-inverted spectra were processed and quantified with LCModel (3), as previously described (1). Fractional enrichment (FE) was estimated from the resulting edited (13C) and non-edited (13C+12C) measurements, i.e. 13C/(13C+12C).
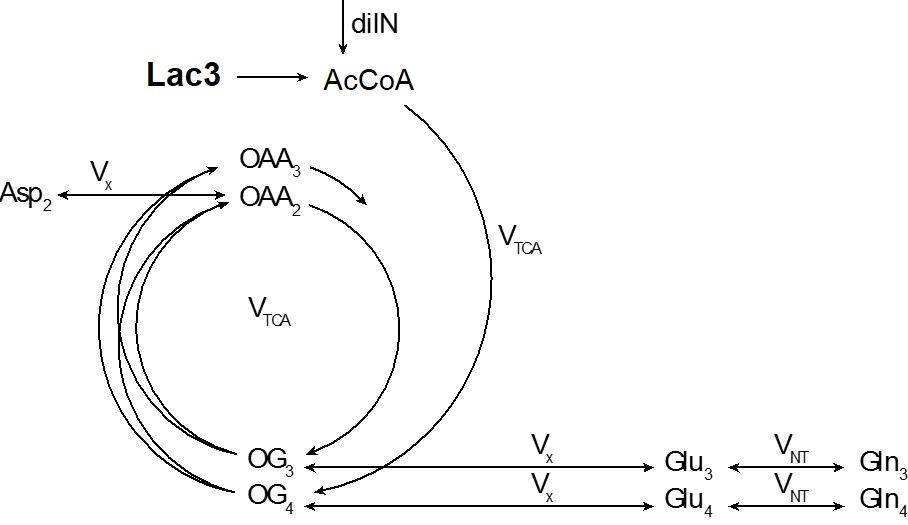
A one compartment model of
brain energy metabolism was adapted from a previous study (1), as shown in Figure1. More specifically, through
pyruvate dehydrogenase 13C label enters the tricarboxylic acid (TCA) cycle and
labels C4 position of 2-oxoglutarate (OG) in the first TCA cycle turn. Via
transmitochondrial transport OG exchanges with cytosolic glutamate (Glu) which
gets labeled at position C4. In the second turn of TCA cycle, OG C3 receives
the label from OG C4 and Glu C3 gets further labeled. Aspartate (Asp) gets
labeled via the transmitochondrial exchange with TCA cycle intermediate oxaloacetate
(OAA). C4 and C3 positions of glutamine (Gln) exchange 13C
label with Glu C4 and
C3 through Glu-Gln cycle. VTCA, the TCA cycle rate; Vx,
exchange flux between mitochondrial TCA cycle intermediates and cytosolic
glutamate; VNT, glutamate-glutamine exchange rate; dilN,
the dilution factor of AcCoA pool induced by uptake of
unlabeled plasma energy substrates.
Results and Discussion
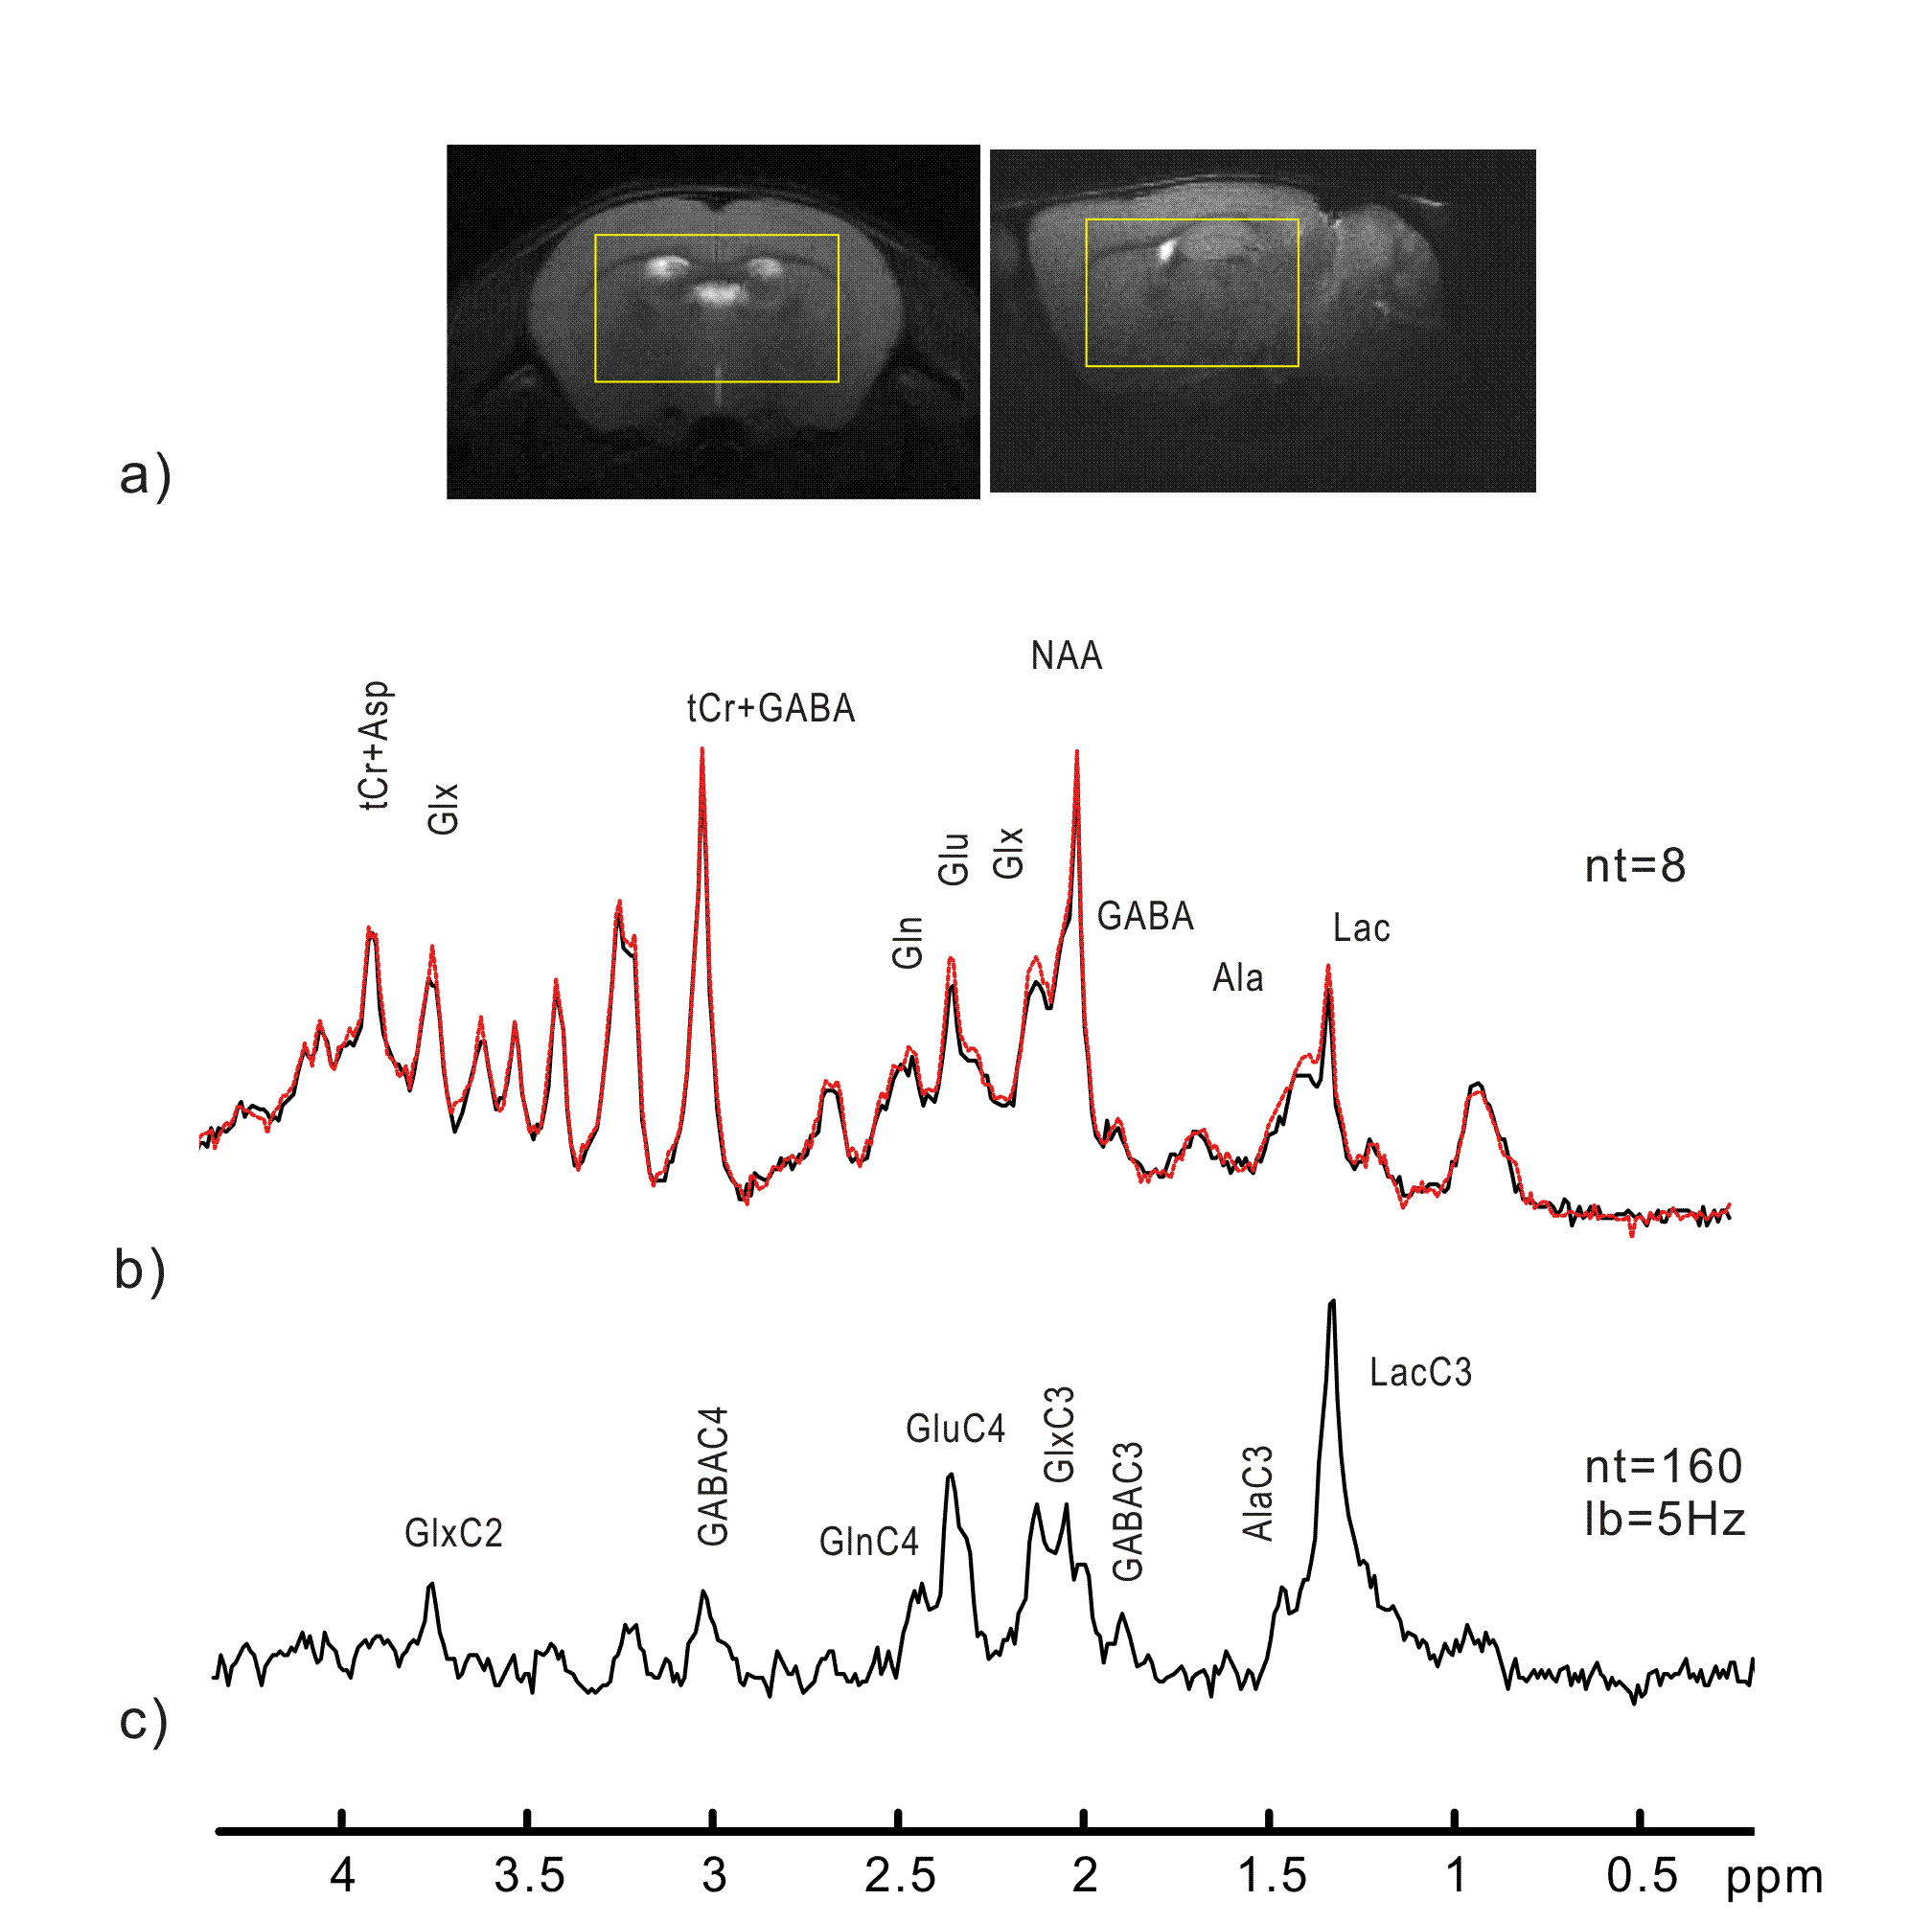
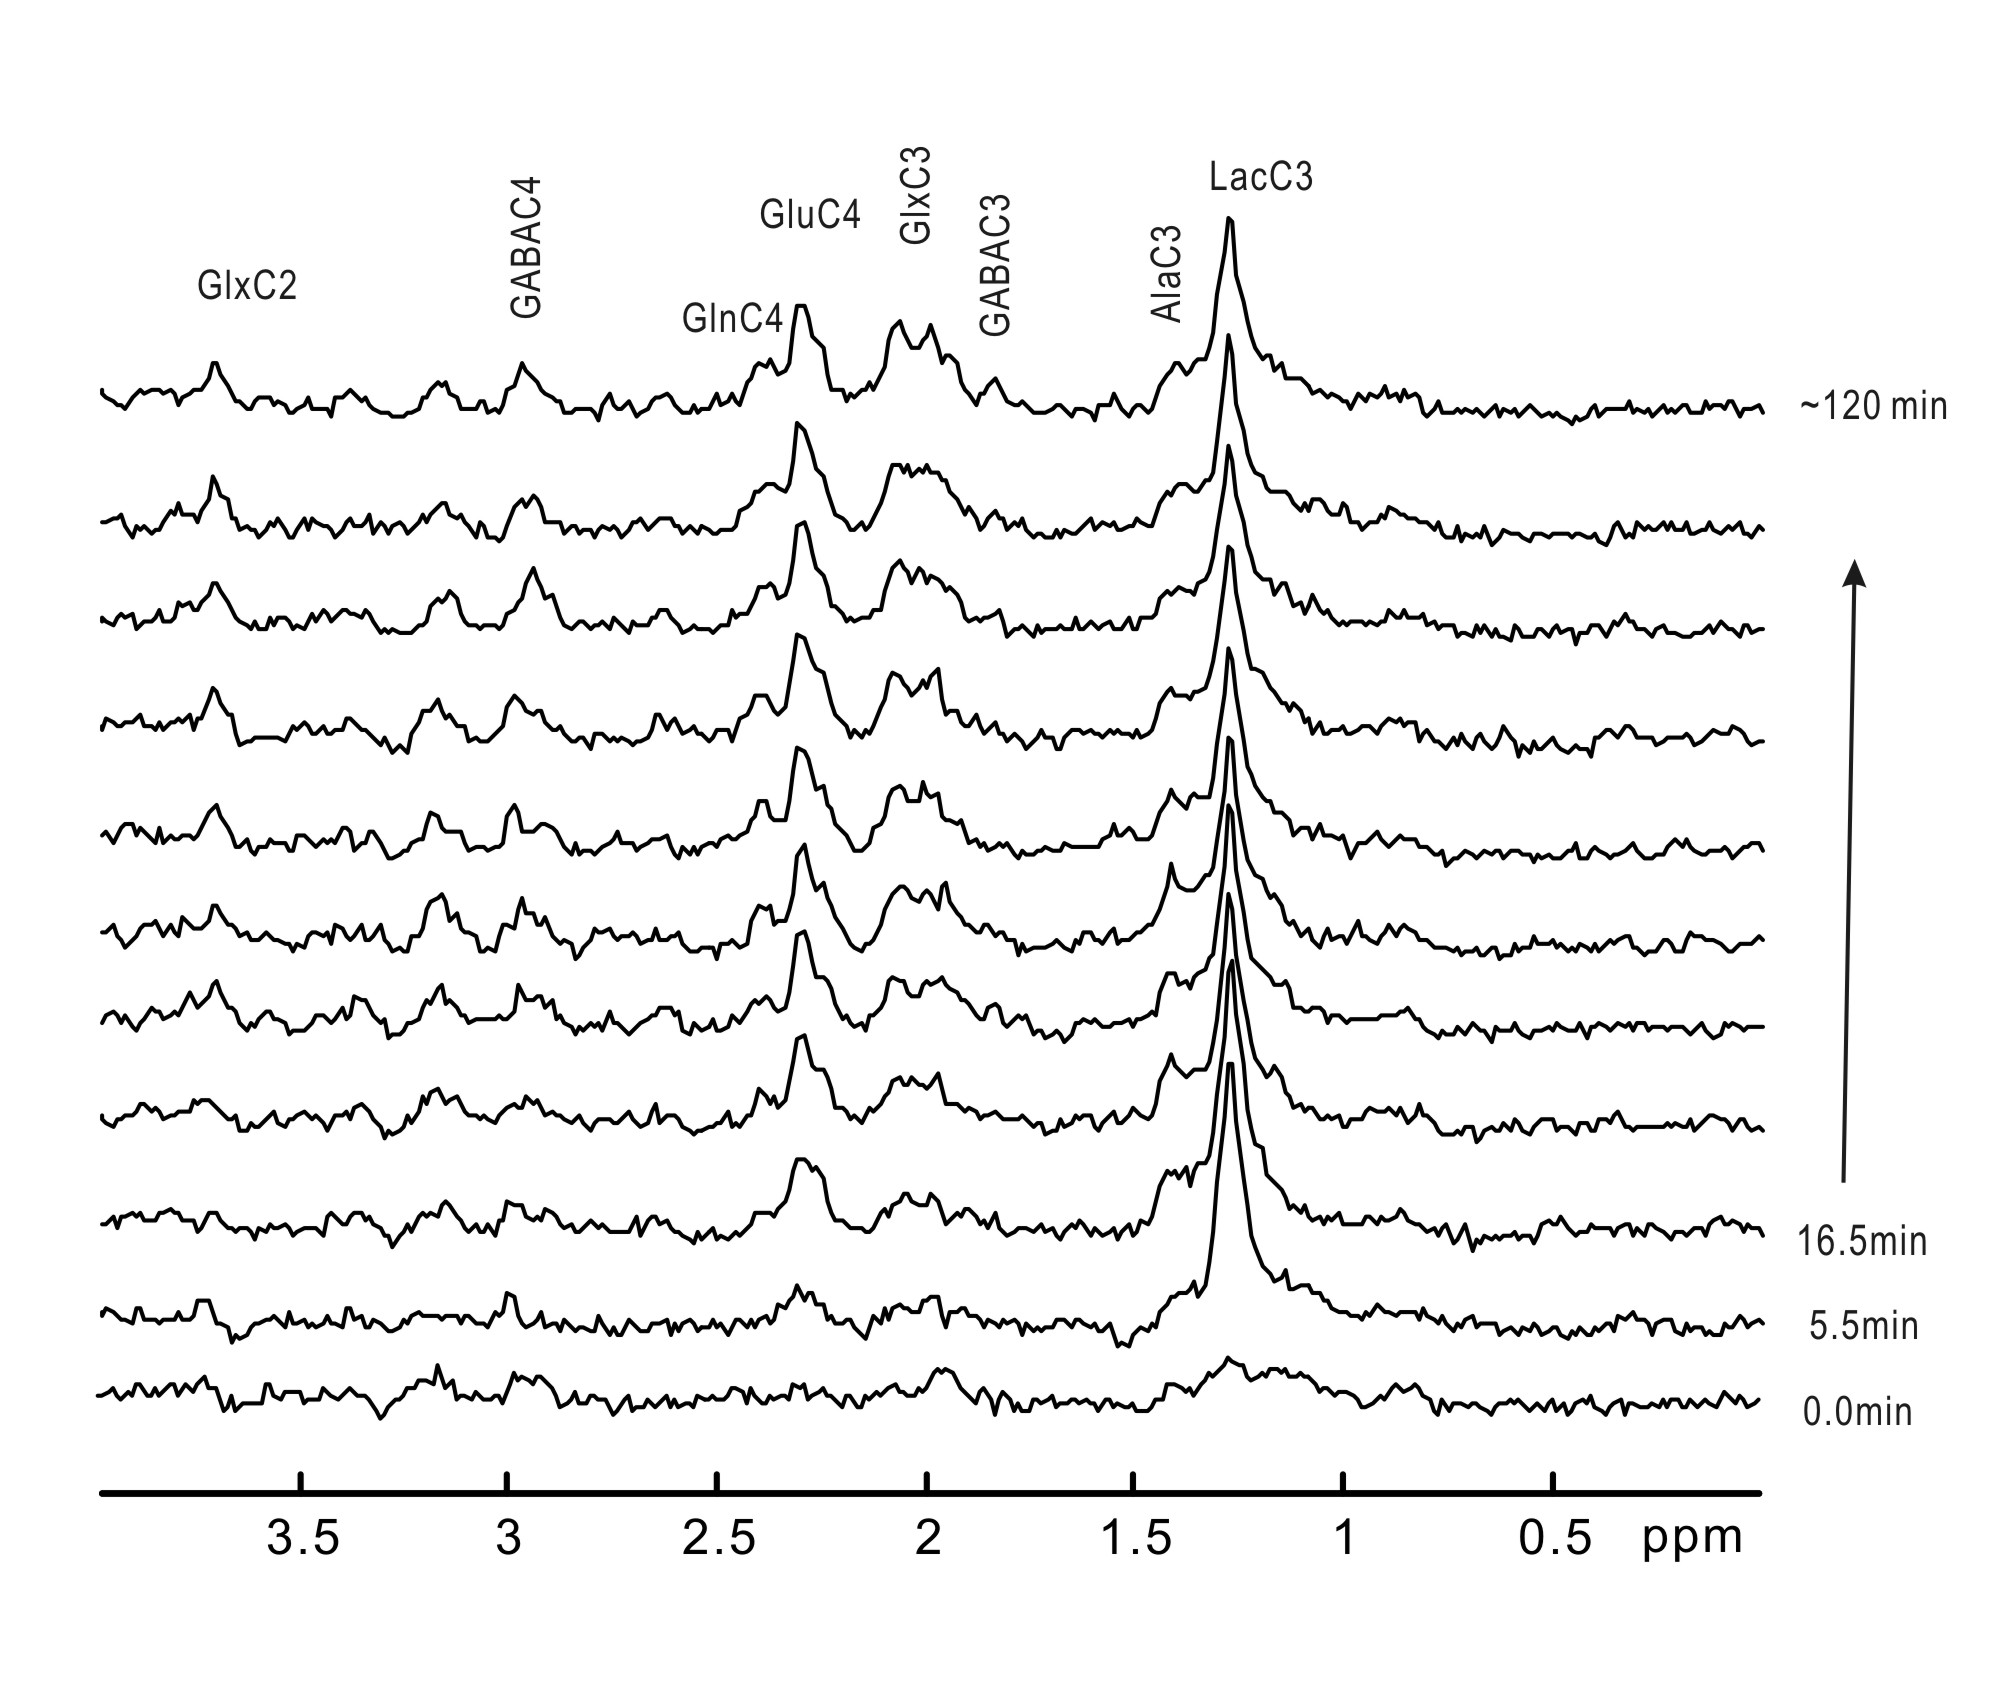
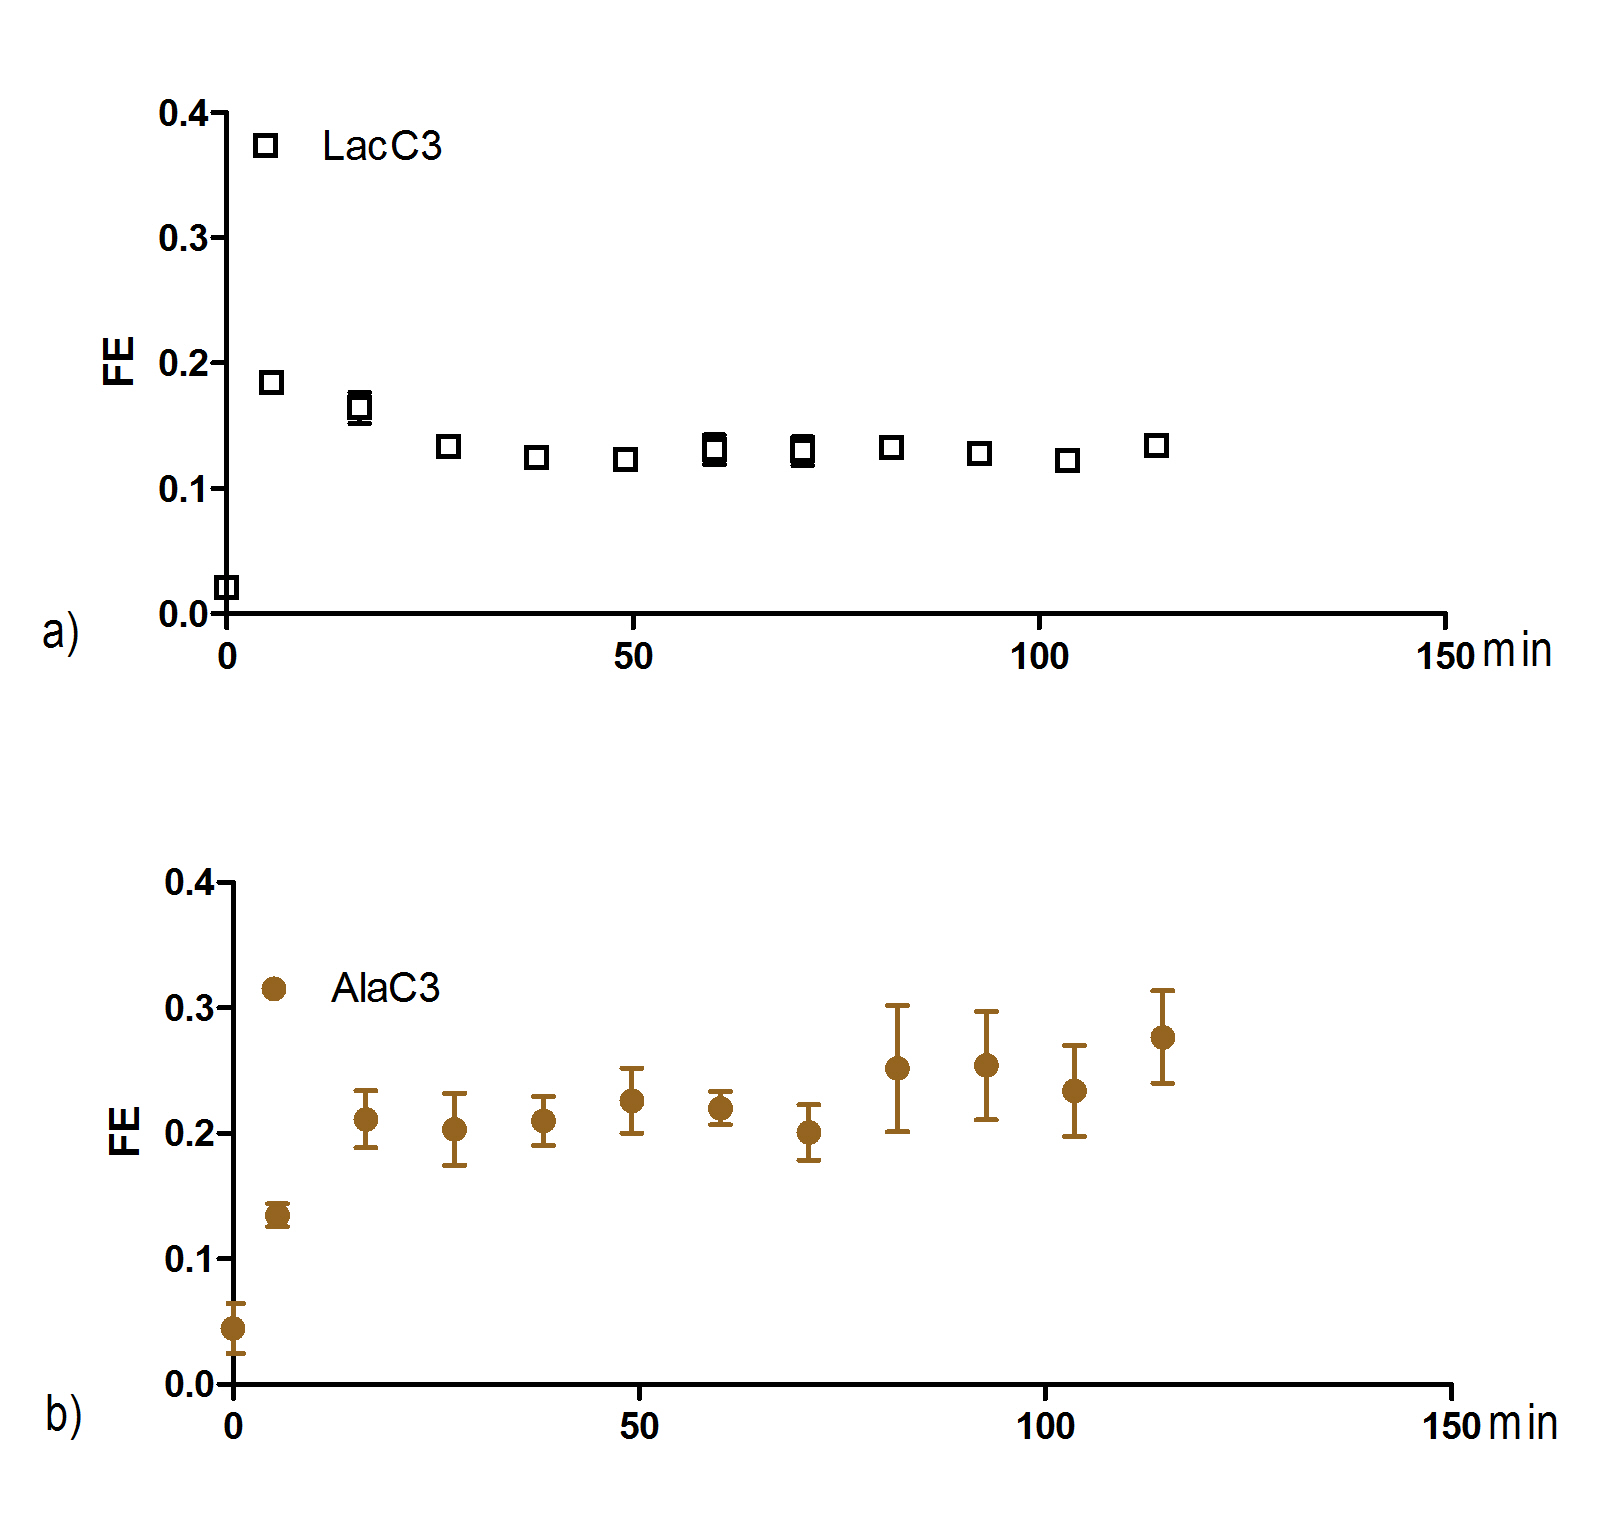
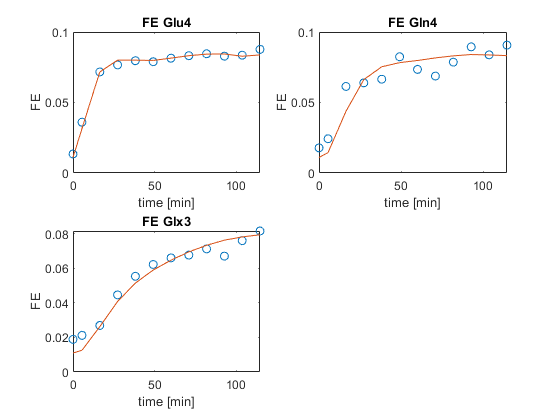
The quality of the obtained spectra (Figure 2) enabled the visualization of cerebral LacC3 immediately after starting [3-13C]-lactate administration. Subsequently, alanine (Ala) C3 and glutamate (Glu) C4 appeared (Figure 3). Moreover, the turnover of Glu C4 and glutamine (Gln) C4, Glu+Gln C3 (GlxC3) and Glu+Gln C2 (GlxC2) could be resolved with a time resolution of 11min, during ~120 minutes of lactate infusion (Figure 3). After spectral quantification, a temporal resolution of 11min was obtained for FEs of LacC3, AlaC3 (Figure 4), GluC4, GlnC4 and GlxC3 (Figure 5). Using the measured LacC3 FE as input function, the one-compartment model was fitted to the measured GluC4, GlnC4 and GlxC3 turnover curves resulting in VTCA= 0.59±0.07μmol/g/min, Vx= 1.97± 0.98μmol/g/min, VNT= 0.23± 0.10μmol/g/min and dilN= 0.35±0.01.
We conclude
that despite the low isotopic enrichment resulting
from LacC3 uptake and metabolism in the mouse brain, localized in vivo 1H-[13C]-MRS at
14.1T enabled a reliable measurement of the dynamic 13C
labeling of amino acids and
the determination of downstream brain metabolic rates consistent with previous
glucose infusion studies (1). This
opens the way to specific mice studies of blood lactate contribution as a fuel to brain energy metabolism.
Acknowledgements
The work was supported by the Center of Biomedical Imaging (CIBM) of the École Polytechnique Fédérale de Lausanne (EPFL), the Université de Lausanne (UNIL), the Université de Genève (UNIGE), the Hôpitaux Universitaires de Genève (HUG) and the Centre Hospitalier Universitaire Vaudois (CHUV), the Leenaards and Jeantet FoundationsReferences
1. Xin, L et al. Assessment of metabolic fluxes in the mouse brain in vivo using 1H-[13C] NMR spectroscopy at 14.1 Tesla. Journal of cerebral blood flow and metabolism: 35, 759-765, doi:10.1038/jcbfm.2014.251 (2015)
2. Gruetter R, Tkac I. Field mapping without reference scan using asymmetric echo-planar techniques. Magn Reson Med 2000; 43(2): 319-23.
3. Provencher SW. Estimation of metabolite concentrations from localized in vivo proton NMR spectra. Magn Reson Med 1993; 30(6): 672-9.
Figures