4209
Fluorine-19 Magnetic Resonance Thermometry: Temperature Dependence of Spin-Lattice and Spin-Spin-Relaxation Times of Fluorinated Drugs at 9.4 T1Berlin Ultrahigh Field Facility, Max Delbrück Center for Molecular Medicine, Berlin, Germany, 2Experimental and Clinical Research Center, a joint cooperation between the Charité Medical Faculty and the Max Delbrück Center for Molecular Medicine, Berlin, Germany
Synopsis
Fluorine-19 (19F) magnetic resonance is a powerful tool for tracking fluorine labelled markers, cells and drugs. Here, we studied the influence of temperature on the 19F MR characteristics (chemical shift, T1, T2, SNR) of four fluorinated drugs using 19F MR mapping and spectroscopy techniques. We demonstrated the impact of temperature on the T1 relaxation time of PFCE nanoparticles in vivo and postmortem. Our findings open a trajectory toward 19F MR-based thermometry and indicate the need for adapting MR sequence parameters according to temperature induced environmental changes. This will be an essential requirement for monitoring fluorinated compounds by 19F MR techniques in vivo.
Introduction
Fluorine-19 (19F) magnetic resonance techniques are of paramount relevance for a multitude of biomedical applications1,2. The 19F signal of fluorinated compounds depends on 19F MR properties and on environmental factors3. Here, we examined the influence of temperature on the chemical shift (CS), the 19F spectrum, signal intensity (SI), SNR, longitudinal (T1) and transversal (T2) relaxation times of perfluoro-15-crown-5-ether (PFCE), the anesthetic isoflurane (Iso), the anti-inflammatory drug teriflunomide (TF) and the antipsychotic flupentixol (Flu) in phantom studies. We also investigated the impact of temperature on the T1 relaxation of PFCE nanoparticles in vivo and postmortem.Methods
All fluorinated compounds were prepared in 2ml syringe phantoms: 1.72M PFCE, 0.54M isoflurane in DMSO, 100mM teriflunomide in DMSO and 169mM flupentixol in medium chain triglycerides. A water bath was used to heat the sample (T=20-60°C in increments of 5°C). For absolute temperature measurements and management, a fiber optic probe was used. For the in vivo and post mortem studies, a fiber optic temperature probe was inserted under the skin in the neck region of an anesthetized C57BL/6 mouse. PFCE nanoparticles were administered subcutaneously in the neck region. All MR experiments were performed on a 9.4T MR scanner (Bruker Biospec, Ettlingen, Germany) using a dual-tunable 19F/1H mouse head RF coil4. 2D-FLASH was used for pilot scans, 3D-RARE was used for 1H and 19F imaging. Global single pulse spectroscopy was used to detect the 19F signal and to make frequency adjustments. T1 mapping was performed using a saturation based RARE technique (TE=4.6ms, ETL=4, FOV=16mmx16mm, matrix size=64x64, with 9 variable repetitions times (TR=25ms-8000ms). T2 mapping was performed using a multi-slice multi-echo technique (TR=2000ms, FOV=16mmx16mm, matrix size=64x64) with 25 TEs (TE=40-1000ms, increment 40ms; for flupentixol TE=8-200ms, increment 8ms). Image processing and spectral analysis were performed in MATLAB R2018a. We calculated CS, FIDFit (SI), SNR, T1 and T2 and all MR parameters were plotted versus the measured median temperature.Results
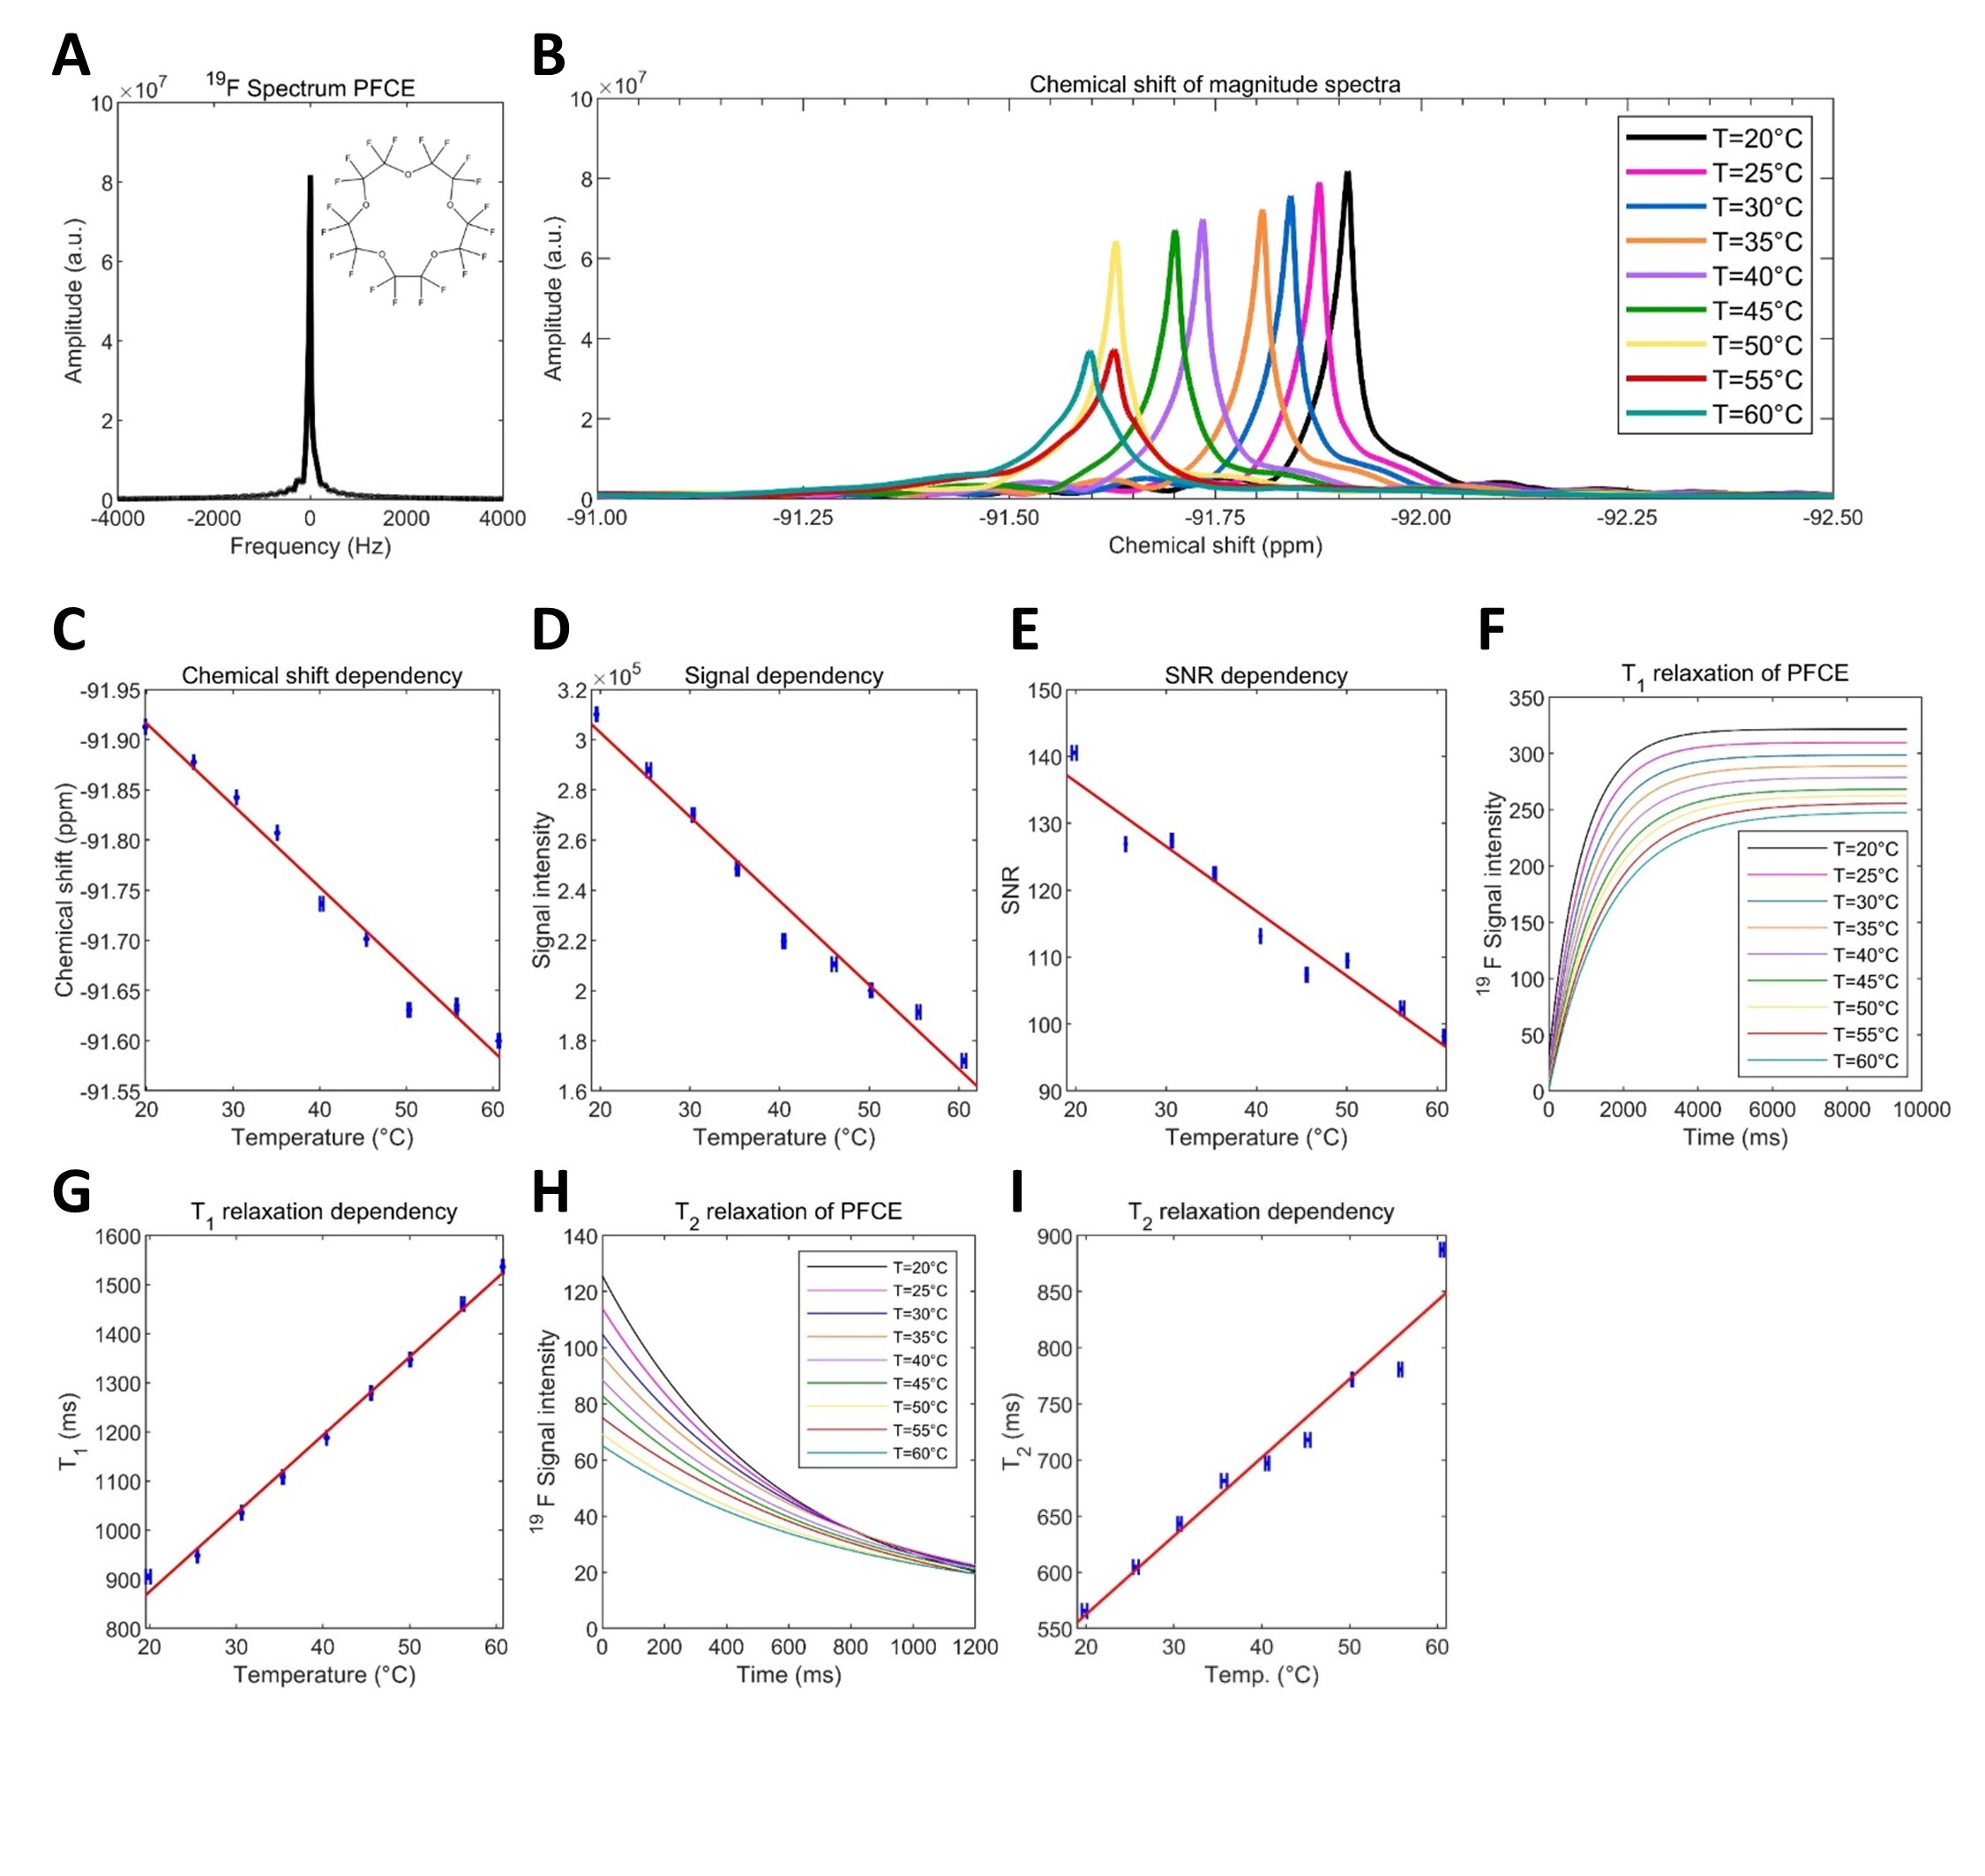
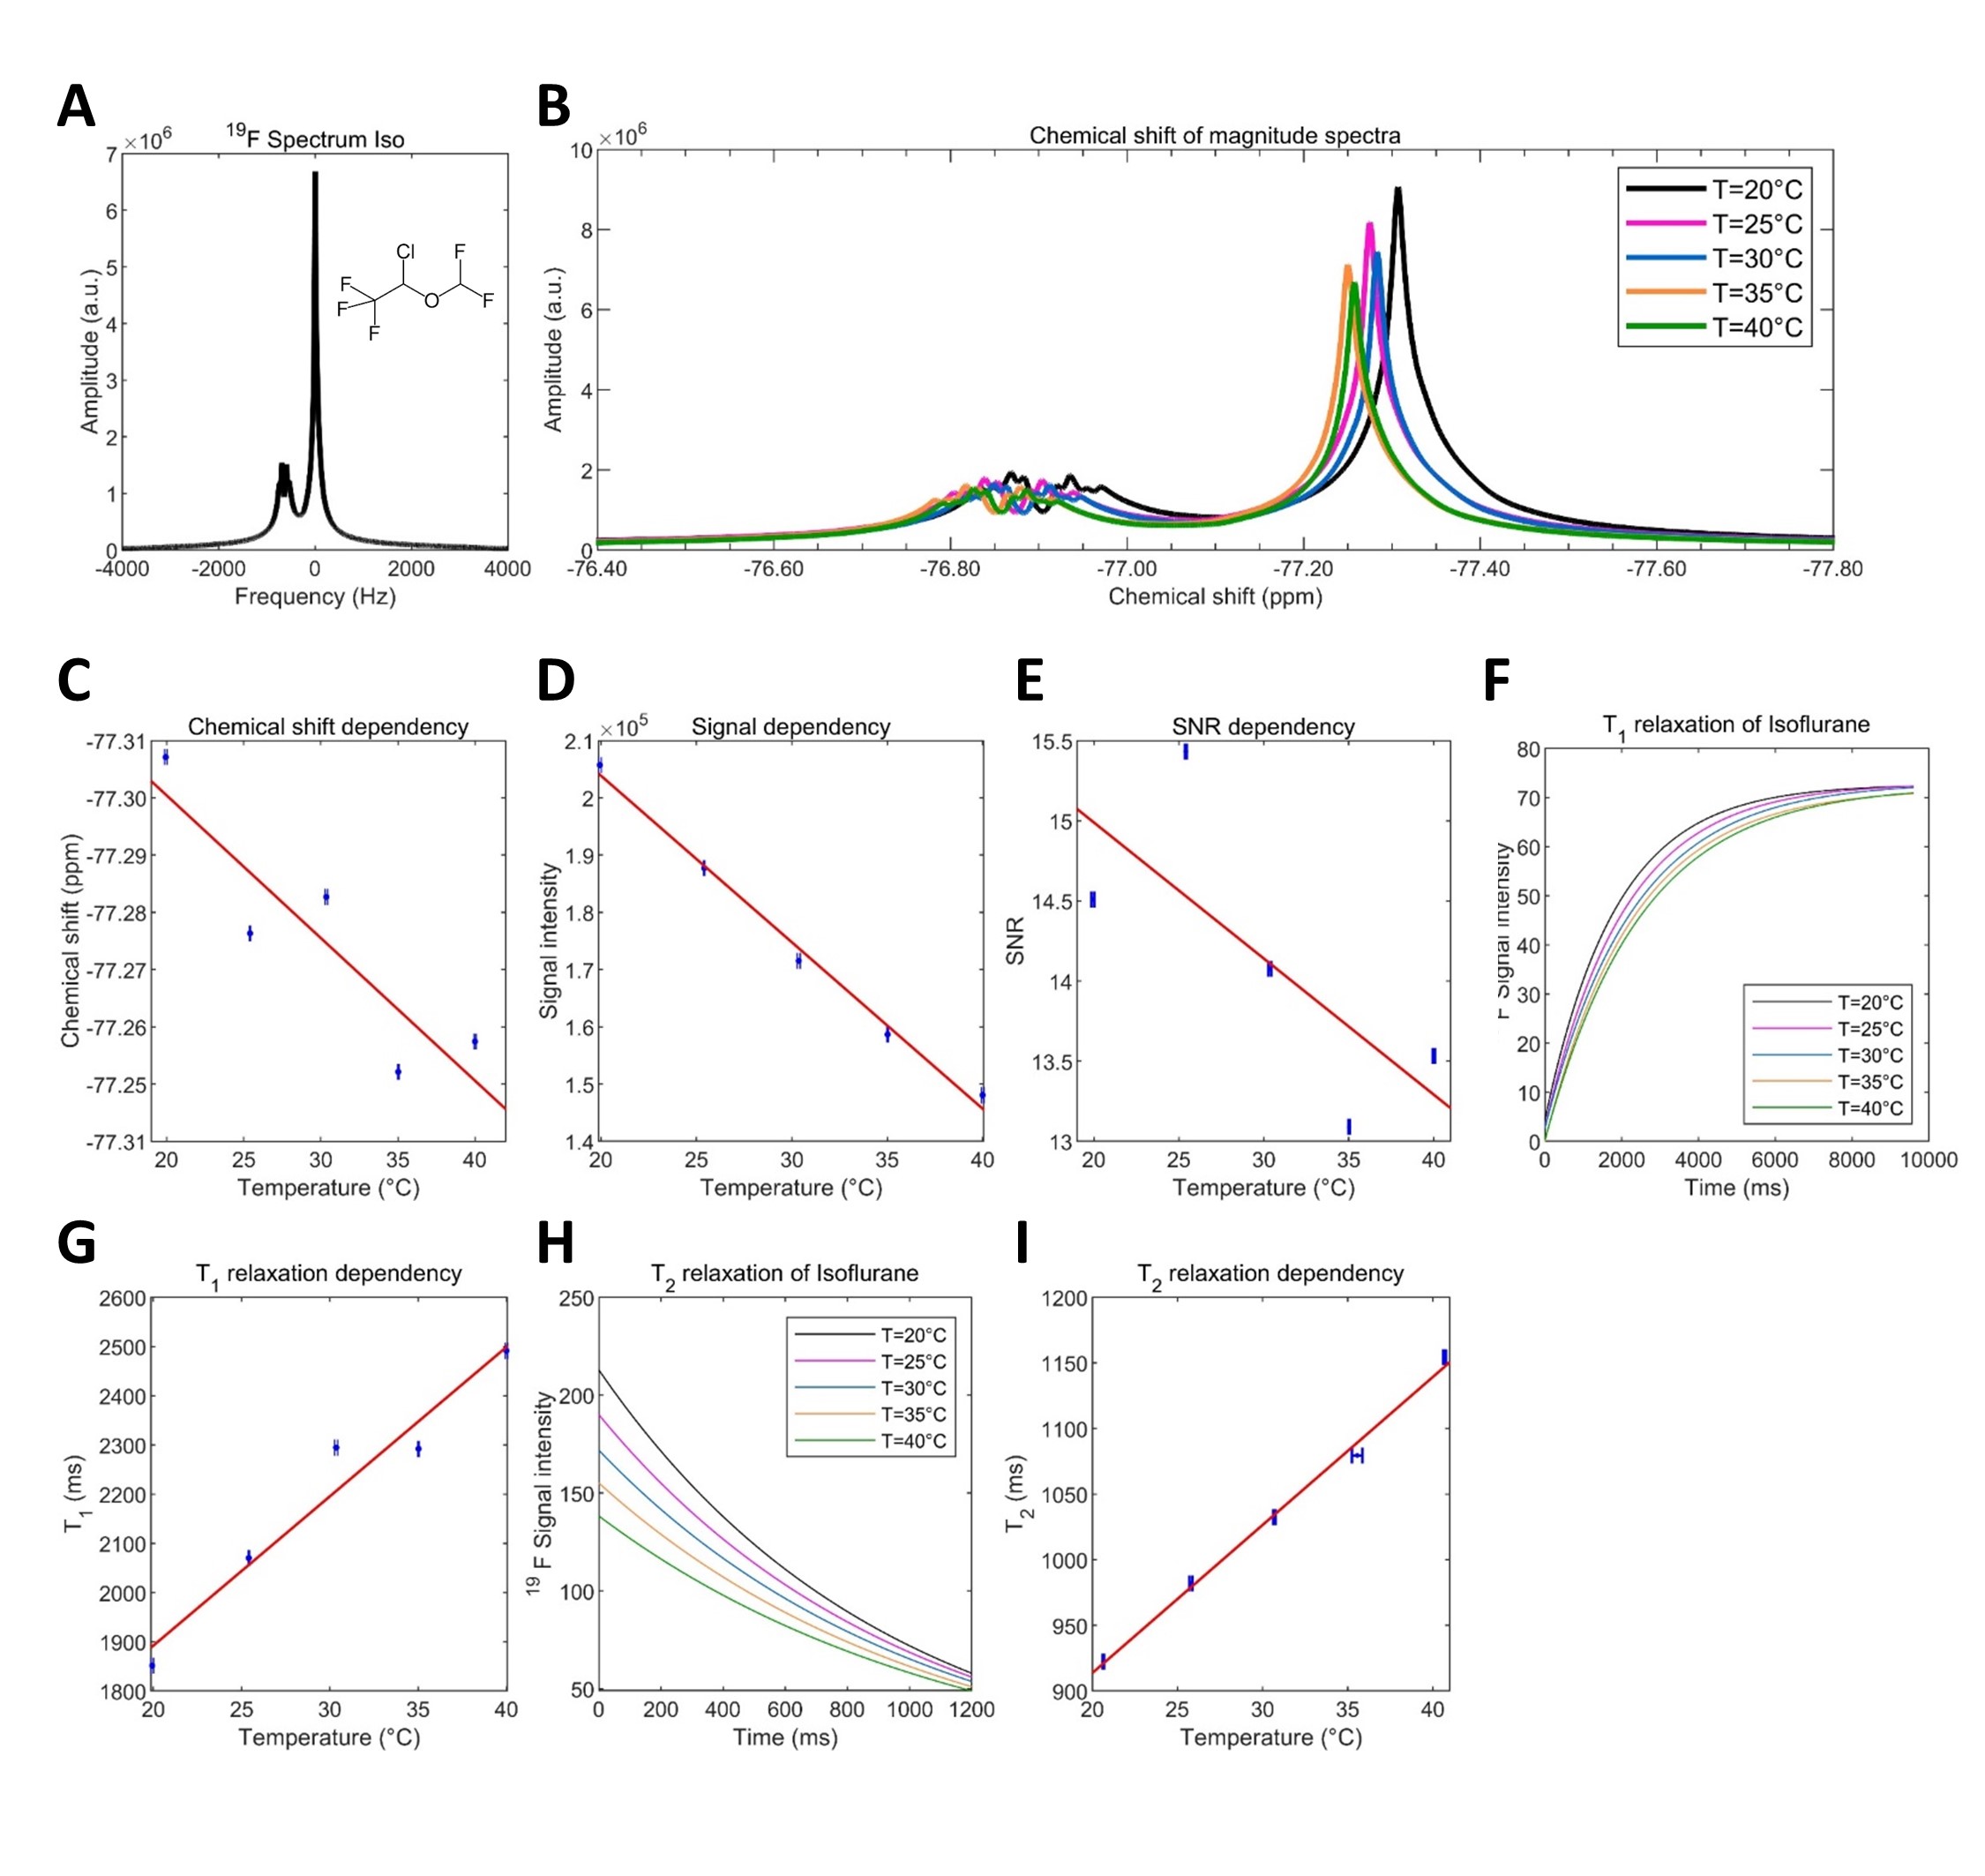
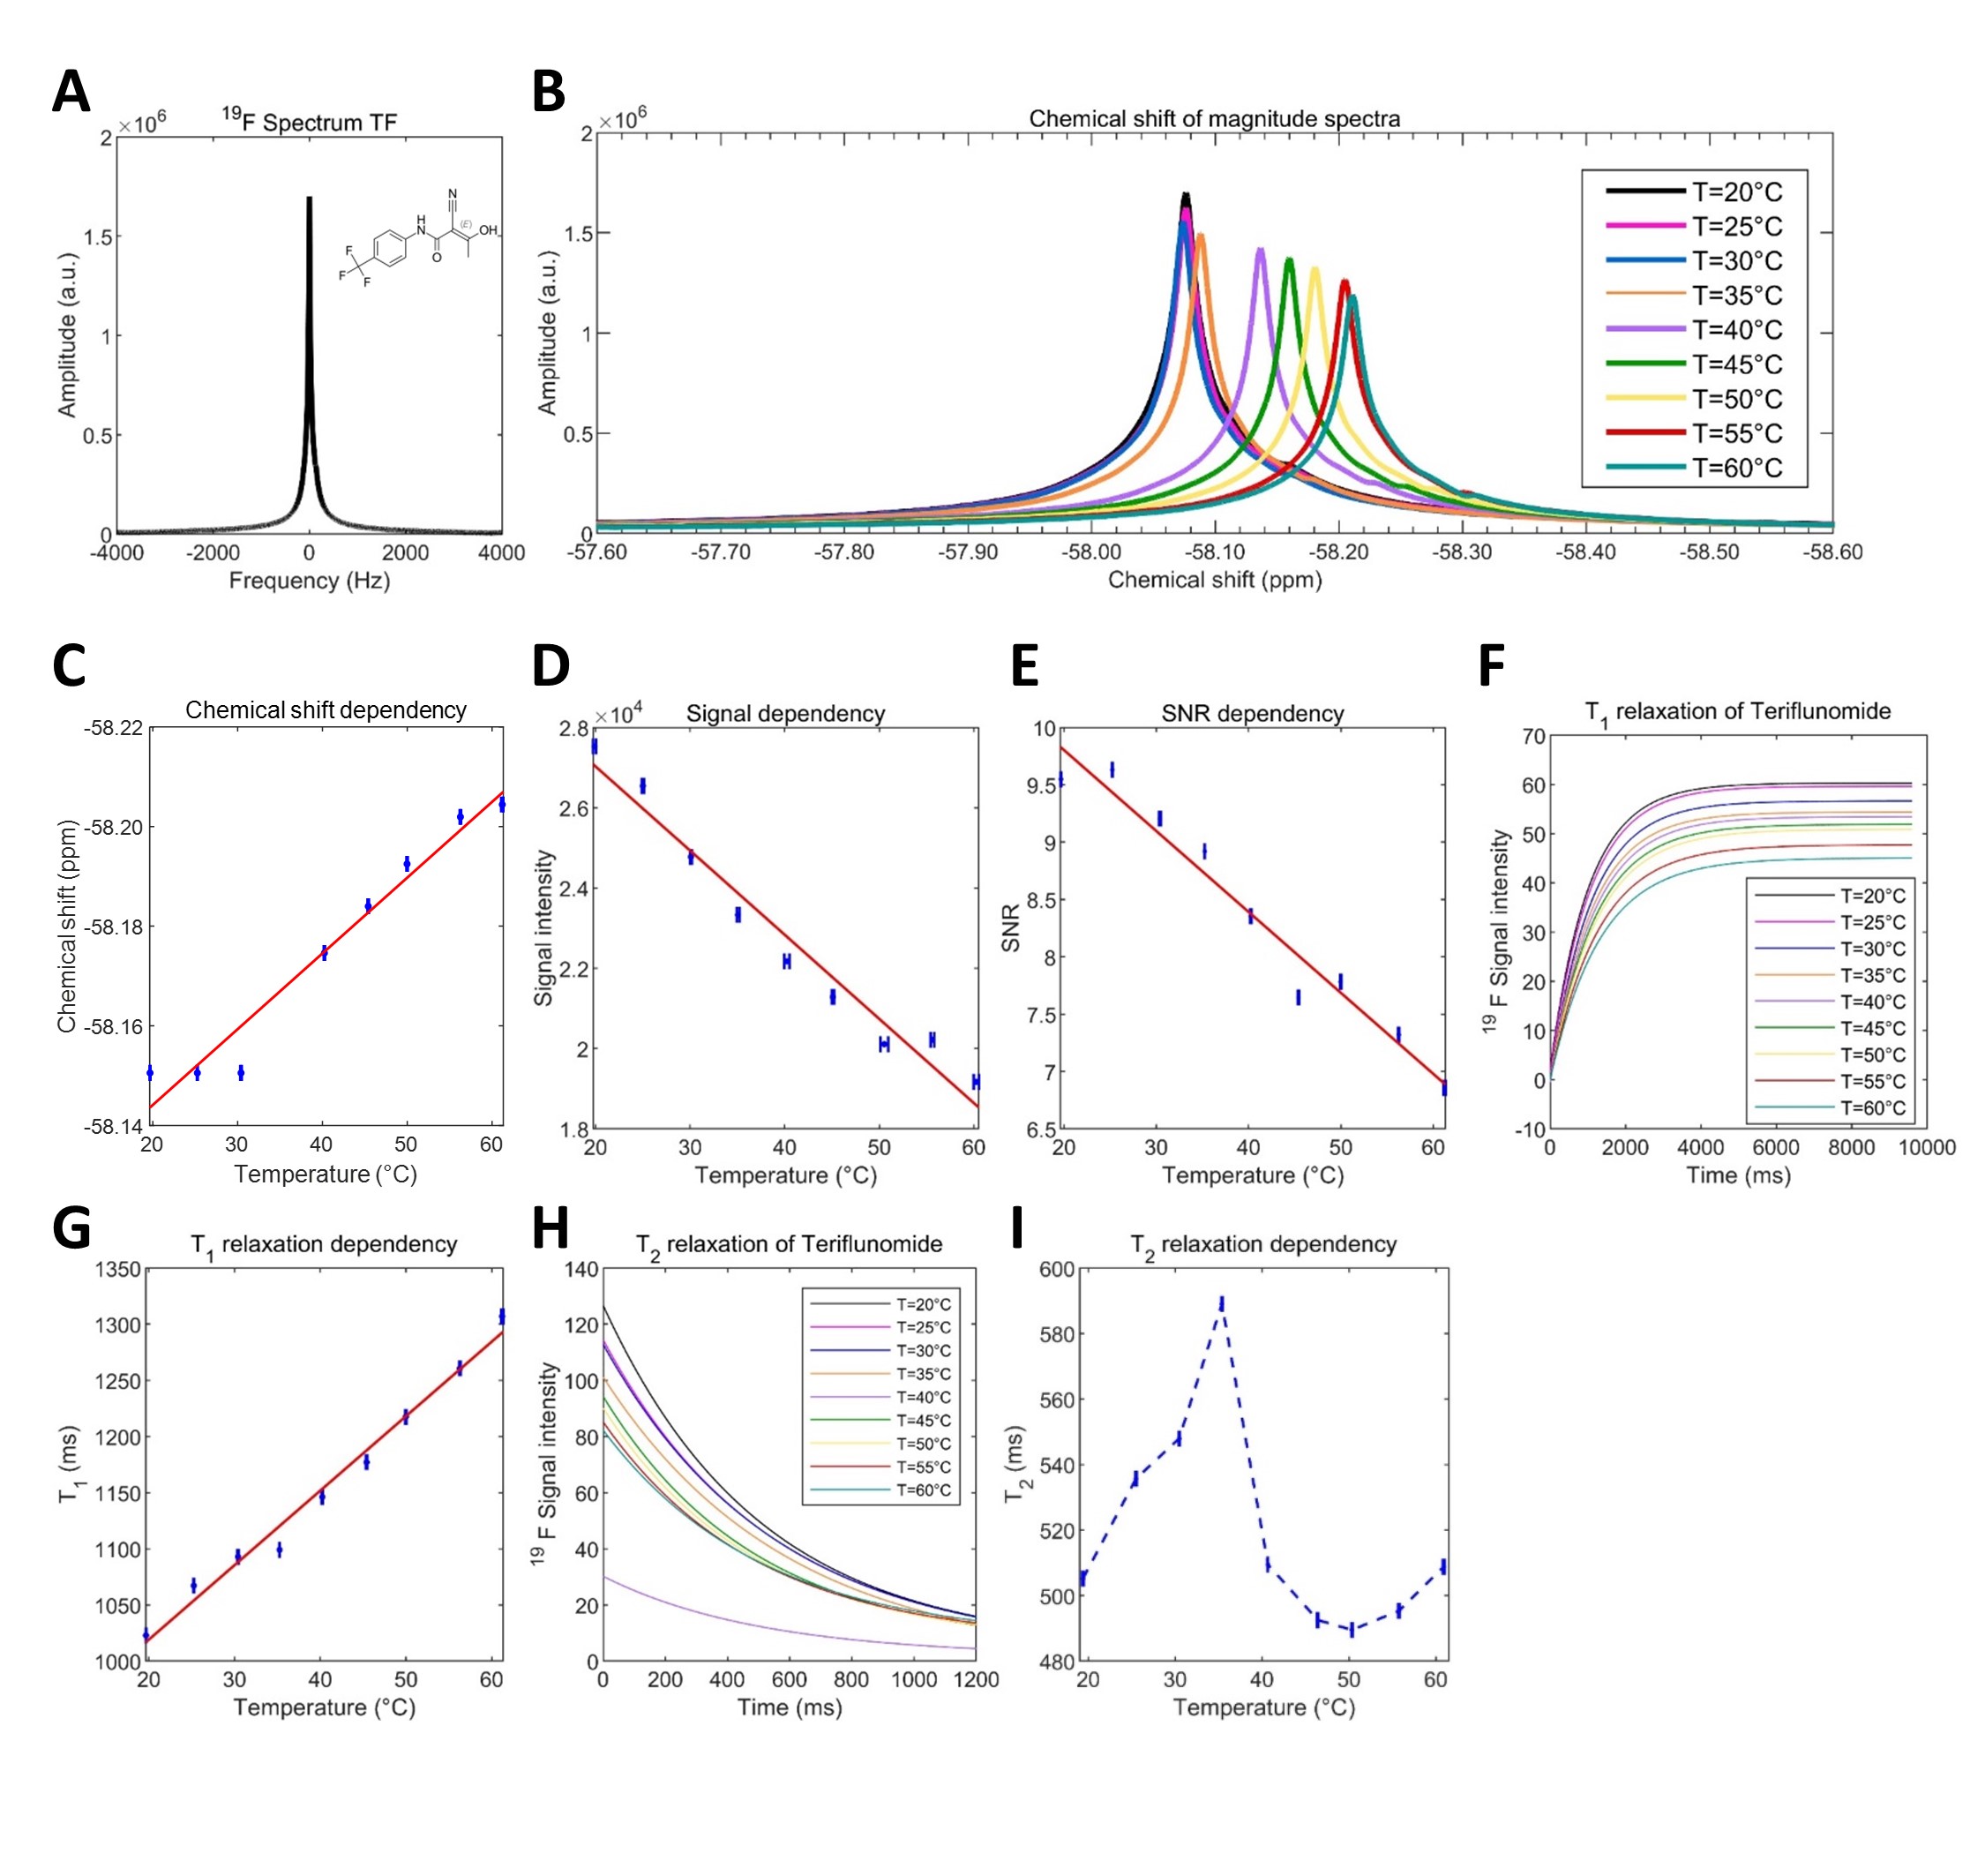
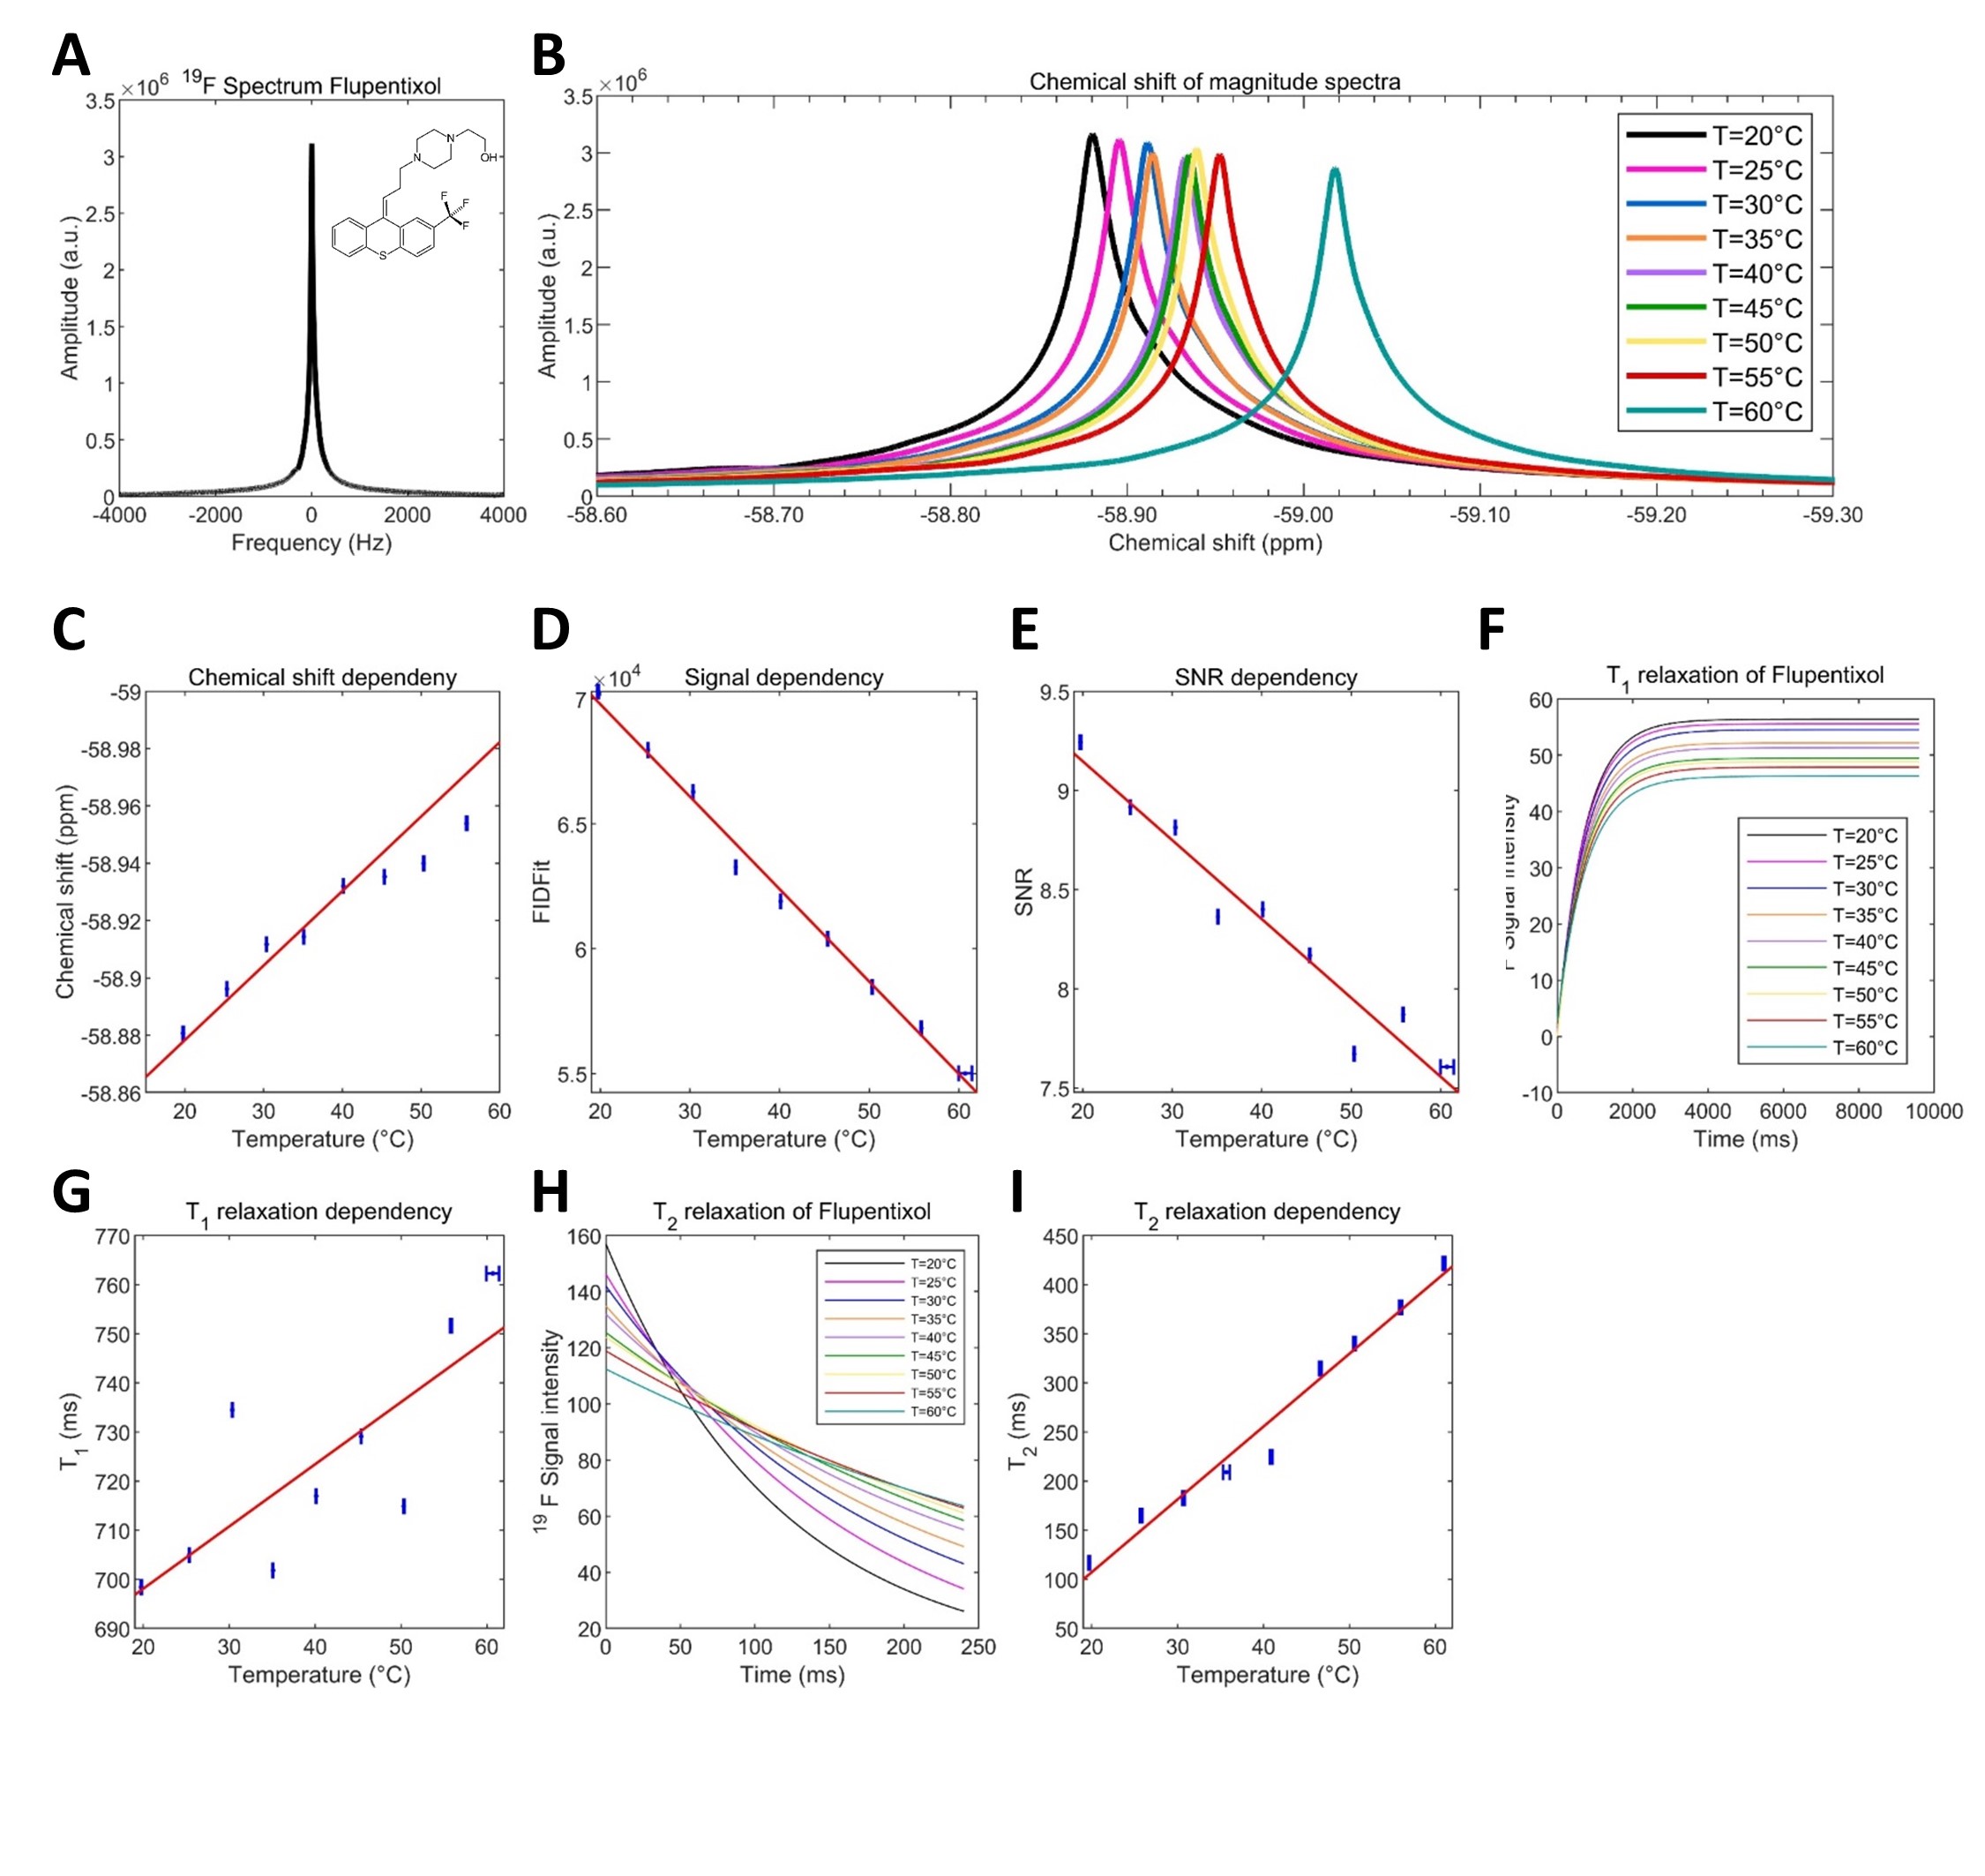
PFCE demonstrates a spectrum with a single peak (Fig.1A). Upon increasing temperature, the CS decreased (+0.0082ppm/°C)(Fig.1B+C). A negative correlation of the SI (Fig.1D) and the SNR (Fig.1E) was observed. T1 increased with temperature (ΔT1=+16ms/°C)(Fig.1G). We also observed a linear increase of T2 (7ms/°C)(Fig.1I). Isoflurane showed one major and several minor peaks (Fig.2A). Isoflurane revealed a CS dependence versus temperature of ΔCS=+0.0025ppm/°C (Fig.2B+C). We observed a decrease in SI (Fig.2D) and SNR (Fig.2E) with increasing temperatures. T1 increased with a linear change of ΔT1=+30ms/°C (Fig.2G), T2 with a linear increase of ΔT2=11ms/°C (Fig.2I). Teriflunomide showed a spectrum with a single peak (Fig.3A) and a temperature dependent CS change of ΔCS=-0.0038ppm/°C (Fig.3B+C). A negative correlation of SI (Fig.3D) and SNR (Fig.3E) with increasing temperatures was found. T1 mapping revealed a linear T1 change of ΔT1=6.6ms/°C (Fig.3G). T2 mapping revealed a T2 increase of 4.9ms/°C up to T=35°C. For T>35°C T2 decline (Fig.3I) was observed. Flupentixol yielded a single-peak spectrum (Fig.4A) and, similar to teriflunomide, a negative CS at varying temperatures of DCS= -0.0026ppm/°C (Fig.4B+C). We observed a linear dependence of the SI (Fig.4D) and the SNR (Fig.4E) versus temperature. There is a linear T1 increase of ΔT1=1.3ms/°C (Fig.4G) and a linear T2 increase of ΔT2=7.4ms/°C (Fig.4I). T1 mapping was performed in vivo at 32.4°C in the neck region (Fig.5B), revealing a T1 of 1325ms. At room temperature (23.6°C) the T1 observed ex vivo was reduced by 13% (1149ms)(Fig.5C).Discussion
En route to 19F MR-based thermometry, we investigated the influence of the temperature on the 19F MR characteristics of several compounds with different chemical properties and configurations of fluorine containing groups. The degree of influence varied between each substance, such as the ranges of the CS changes and the degree of T1 and T2 change per unit temperature. Varying temperatures lead to an increase in the molecular tumbling rate. Therefore, temperature related changes in dipole-dipole interactions and the anisotropy of the fluorine chemical shift and J-coupling affect the chemical shift and relaxation times.Conclusions
Understanding the 19F MR characteristics and temperature influence of pharmacological compounds with a low 19F content and low availability will be crucial for in vivo studies. Together with optimizing scan parameters and strategies to increase the sensitivity of 19F MR, this will make 19F MR a powerful technique for studying biological processes and monitoring drug therapies.Acknowledgements
This work was supported by funding from the Germany Research Council (DFG WA2804). This project was funded in part (TN) by an advanced ERC grant (EU project ThermalMR - DLV-743077).References
1 Schmieder, A. H., Caruthers, S. D., Keupp, J., Wickline, S. A. & Lanza, G. M. Recent Advances in 19Fluorine Magnetic Resonance Imaging with Perfluorocarbon Emulsions. Engineering (Beijing, China) 1, 475-489, doi:10.15302/j-eng-2015103 (2015).
2 Ruiz-Cabello, J., Barnett, B. P., Bottomley, P. A. & Bulte, J. W. Fluorine (19F) MRS and MRI in biomedicine. NMR in biomedicine 24, 114-129, doi:10.1002/nbm.1570 (2011).
3 Colotti, R. et al. Characterization of perfluorocarbon relaxation times and their influence on the optimization of fluorine-19 MRI at 3 tesla. Magnetic resonance in medicine 77, 2263-2271, doi:10.1002/mrm.26317 (2017).
4 Waiczies, H. et al. Visualizing brain inflammation with a shingled-leg radio-frequency head probe for 19F/1H MRI. Scientific reports 3, 1280, doi:10.1038/srep01280 (2013).
Figures