4208
In vivo study of cerebral NAD contents and Redox State during mouse brain development.1Center for Psychiatric Neuroscience, Department of Psychiatry, Lausanne University Hospital (CHUV), Prilly, Switzerland, 2Center for Biomedical Imaging (CIBM), Ecole Polytechnique Fédérale de Lausanne, Lausanne, Switzerland, 3HES-SO, University of Applied Sciences of Western Switzerland, HEIA-FR, Institute of Chemical Technology, Fribourg, Switzerland
Synopsis
Nicotinamide adenine dinucleotide (NAD+ and NADH) is a key player of cell energy metabolism. 31P-MRS has been demonstrated for in vivo measurement of NAD content and redox state in cat and human brain. We previously demonstrated the feasibility of NAD measurement in mouse brain, and actually we established the in vivo profile of cerebral NAD+, NADH and NAD+/NADH at different ages. This study demonstrated also the feasibility of in vivo measurement of NAD+, NADH and redox state from 20 to 250 days old animals and it opens widely the prospect of studying longitudinally the energy metabolism and redox dysfunction in mouse models of brain pathologies.
Introduction
Nicotinamide Adenine dinucleotide NADH (reduced form) and NAD+ (oxidized form) are cofactors of energy producing pathways. Their ratio RX (NAD+/NADH) reflects the cellular oxidoreductive state.1 Oxidative stress and redox dysregulation have been suggested in various neurological diseases including Schizophrenia, Parkinson’s and Alzheimer’s diseases as well as aging.1-3 The in vivo measurement of redox state and NAD contents was not available until recently, 31P-MRS at high magnetic field has been demonstrated for the in vivo measurement of these indices in cat and human brains.2-6 We previously demonstrated the feasibility of such measurement in mouse brain.7 However, in vivo measurement of these indices during brain development has never been attempted. Especially the measurement in small pups is even more challenging due to the small brain size. Therefore, in this study we will demonstrate the feasibility of longitudinal measurement of NAD+, NADH and RX in mice brains during development at 14.1T where signal sensitivity and spectral dispersion are further enhanced.Method
Animal preparation
C57Bl6/j mice, 20-250 days old (7-40g) were anesthetized by a mixture of air, O2 (1:1 ratio) and 0.9-1.2% isoflurane. The body temperature was kept at 37±0.5°C by a tubing with circulating warm water. The respiration rate and the body temperature were monitored by a small animal monitor (SA Instruments Inc.). All animal procedures were performed according to federal guidelines and were approved by the local ethics committee.
31P-MR Spectroscopy
All 31P-MR experiments were performed on a 14.1 T small animal scanner (Agilent Technologies) using a homebuilt geometrically decoupled 1H quadrature surface coil (10mm diameter) and a linearly polarized 31P coil (10mm diameter) as a transceiver. 31P-MR spectra were acquired using a pulse-acquire sequence (adiabatic half passage, 500µs pulse width, 12kHz spectral width, 4096 complex points) in combination with 3D-ISIS localization. The following parameters were used: voxel size (2.5x6x6 mm3 at P20 and P40, 2.5x7x7 mm3 at P90 and P250), TR = 5s, 1600 averages, transmitter offset was set on NAD+.
Spectral quantification
LCModel was used for the quantification with [α-ATP] as an internal standard set at 2.8mM. A basis-set was prepared using simulated 31P spectra including: PCr(phosphocreatine), α-ATP, β-ATP, γ-ATP, Piint, Piext, PE (phophothanolamine), PC (phosphocoline), GPC (glycerophosphocholine), GPE (glycerophosphoethanolamine), MP (membrane phospholipid), NADH, NAD+ and UPDG with their respective linewidths.7,8
Results
Figure 1 shows typical in vivo 31P spectrum of the mouse brain from P20 to P250, respectively. All spectra demonstrated excellent sensitivity and spectral quality at 14.1T, which ensured the reliable quantification of the NAD signals in vivo by LCModel with small fit residuals.
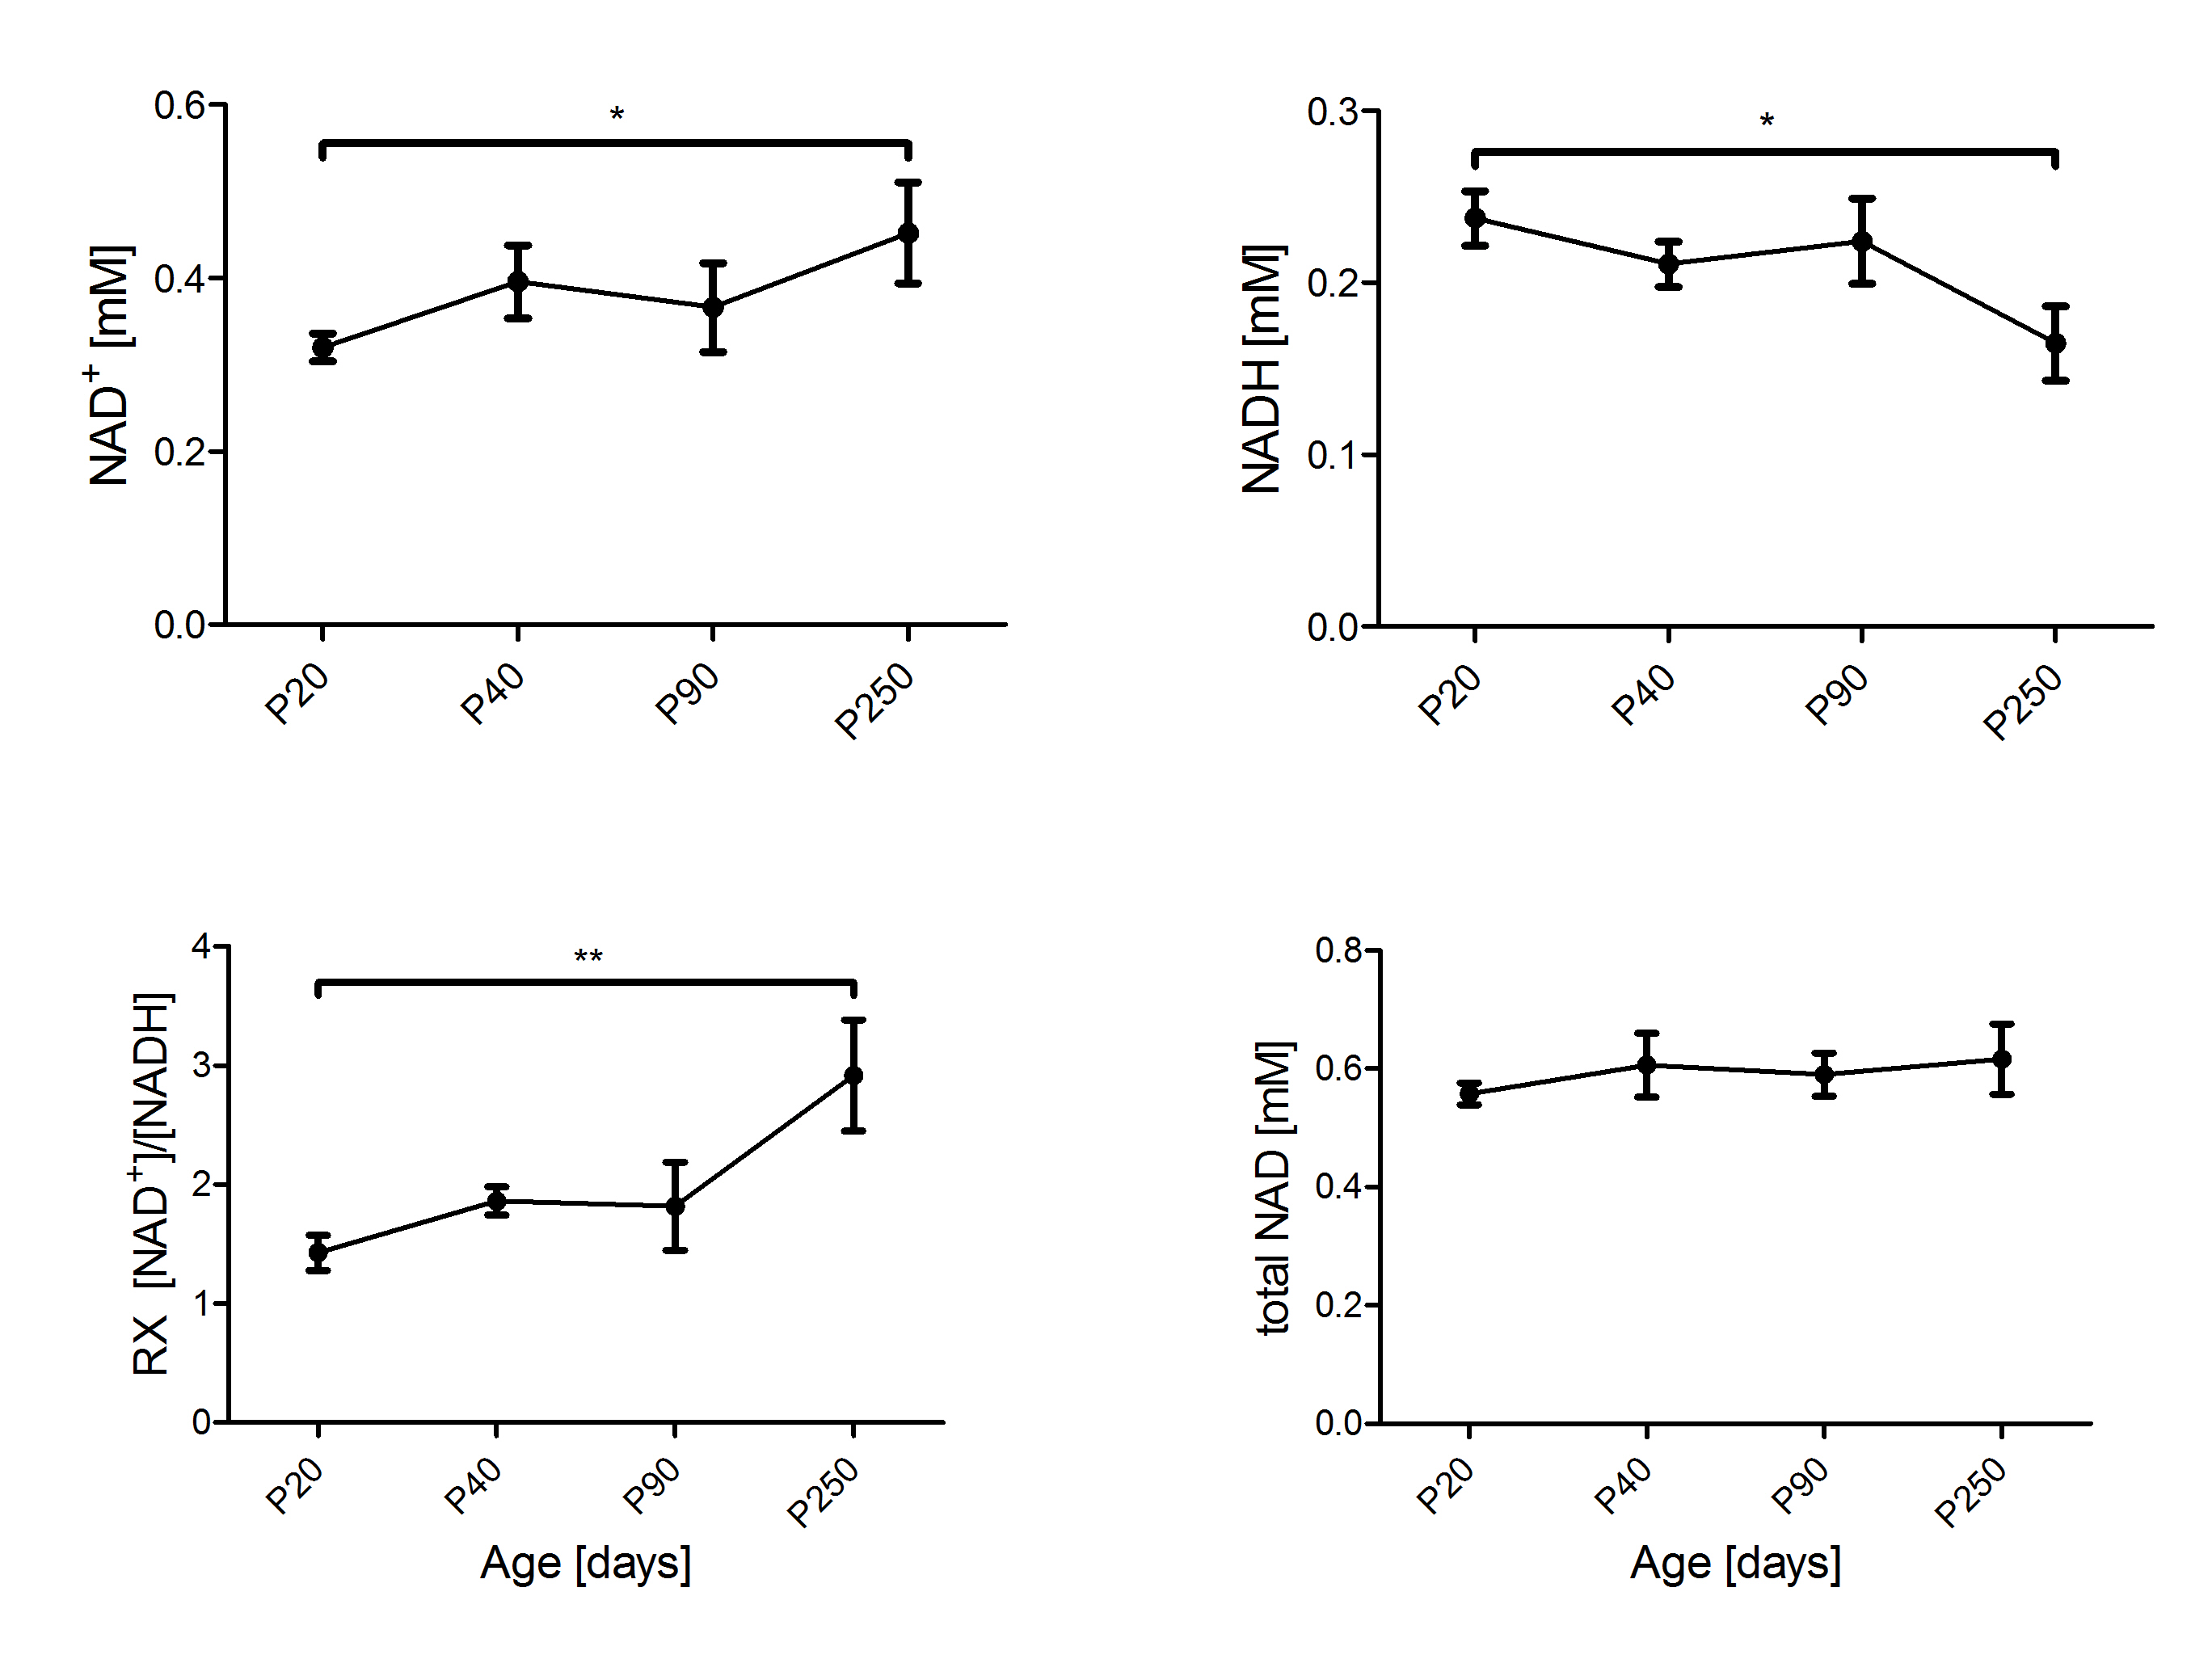
Figure 2 shows the concentrations of NAD+, NADH and RX in mouse brain from P20 to P250. A significant increase of RX was observed from P20 to P250 together with an increase of [NAD+] and a decrease of [NADH]. The total amount of NAD remained unchanged.
Discussion and Conclusion
This is the first in vivo study of NAD content and redox state during mouse brain development. The high sensitivity at 14T allowed excellent spectral quality when using 3D-ISIS localization, which permitted for a more precise VOI localization in comparison to previous 1D-ISIS measurements.
Increased redox ratio from P20 to P250 in mice suggests a development towards a higher brain oxidative state from childhood to adulthood, which is in agreement with in vitro observations in mouse tissue and cultured astrocytes.9 This redox ratio shift is driven by the increase of NAD+ and the decrease of NADH in adulthood, suggesting a shift in glucose utilization during development.10
In conclusion, this study demonstrated the
feasibility of longitudinal in vivo
measurement of NAD+, NADH and redox state in mouse brain by 31P-MRS
at 14.1T. It paves the way to study energy metabolism and redox dysfunction in
transgenic mouse models of brain pathologies and aims also to develop
translational biomarkers profile for early detection and intervention in brain
disease as well as for chronic conditions.
Acknowledgements
Supported by:
Centre d'Imagerie BioMédicale (CIBM) of the UNIL, UNIGE, HUG, CHUV, EPFL,
Leenards and Jeantet Foundations,
Alamaya Foundation,
NCCR Synapsy,
Swiss National Science Fundation (SNF)
References
1. Weihai Y. NAD+ and NADH in brain functions, brain diseases and brain aging. Frontiers in Bioscience 2007;12:1863-1888.
2. Sang-Young K, Bruce M C, Xi C, et al. Redox dysregulation in schizophrenia revealed by in vivo NAD+/NADH measurement. Schizophr Bull. 2016;43(1):197-204.
3. Zhu X-H, Lu M, Lee B-Y, et al. In vivo NAD assay reveals the intercellular NAD contents and redox state in healthy human brain and their age dependences. PNAS 2015;112(9):2876-2881.
4. Lu M, Zhu X-H, Yi Z, et al. Intracellular redox state revealed by in vivo 31P MRS measurement of NAD+ and NAD contents in brains. Magn Reson Med. 2014;71(6):1959-1972.
5. de Graaf R A, De Feyter H M, Brown P B, et al. Detection of cerebral NAD+ in humans at 7T. Magn. Reson. Med 2017;78(3):828-835
6. Deelchand D K, Nguyen T K, Zhu X-H, et al. Quantification of in vivo 31P NMR Brain Spectra using LCModel. NMR Biomed. 2015;28(6):633–641.
7. Skupienski R, Do K, Xin L, et al. In Vivo Measurement of Cerebral NAD Contends and Redox State in Young Mouse. ISMRM annual meeting abstract 2018 http://archive.ismrm.org/2018/3996.html Accessed November 05, 2018.
8. Provencher S W. Estimation of metabolite concentrations from localized in vivo proton NMR spectra. Magn. Reson. Med. 1993;30(6):672-679.
9. Wilhelm F, Hirrlinger J. The NAD+/NADH redox state in astrocytes: Independent control of the NAD+ and NADH content. J. Neurosci. Res. 2011;89:1956-1964
10. Gibson G, Blass J P. A relation between [NAD+]/[NADH] potentials and glucose utilization in rat brain slices. J Biol. Chem. 1976;251:4127-4137
Figures
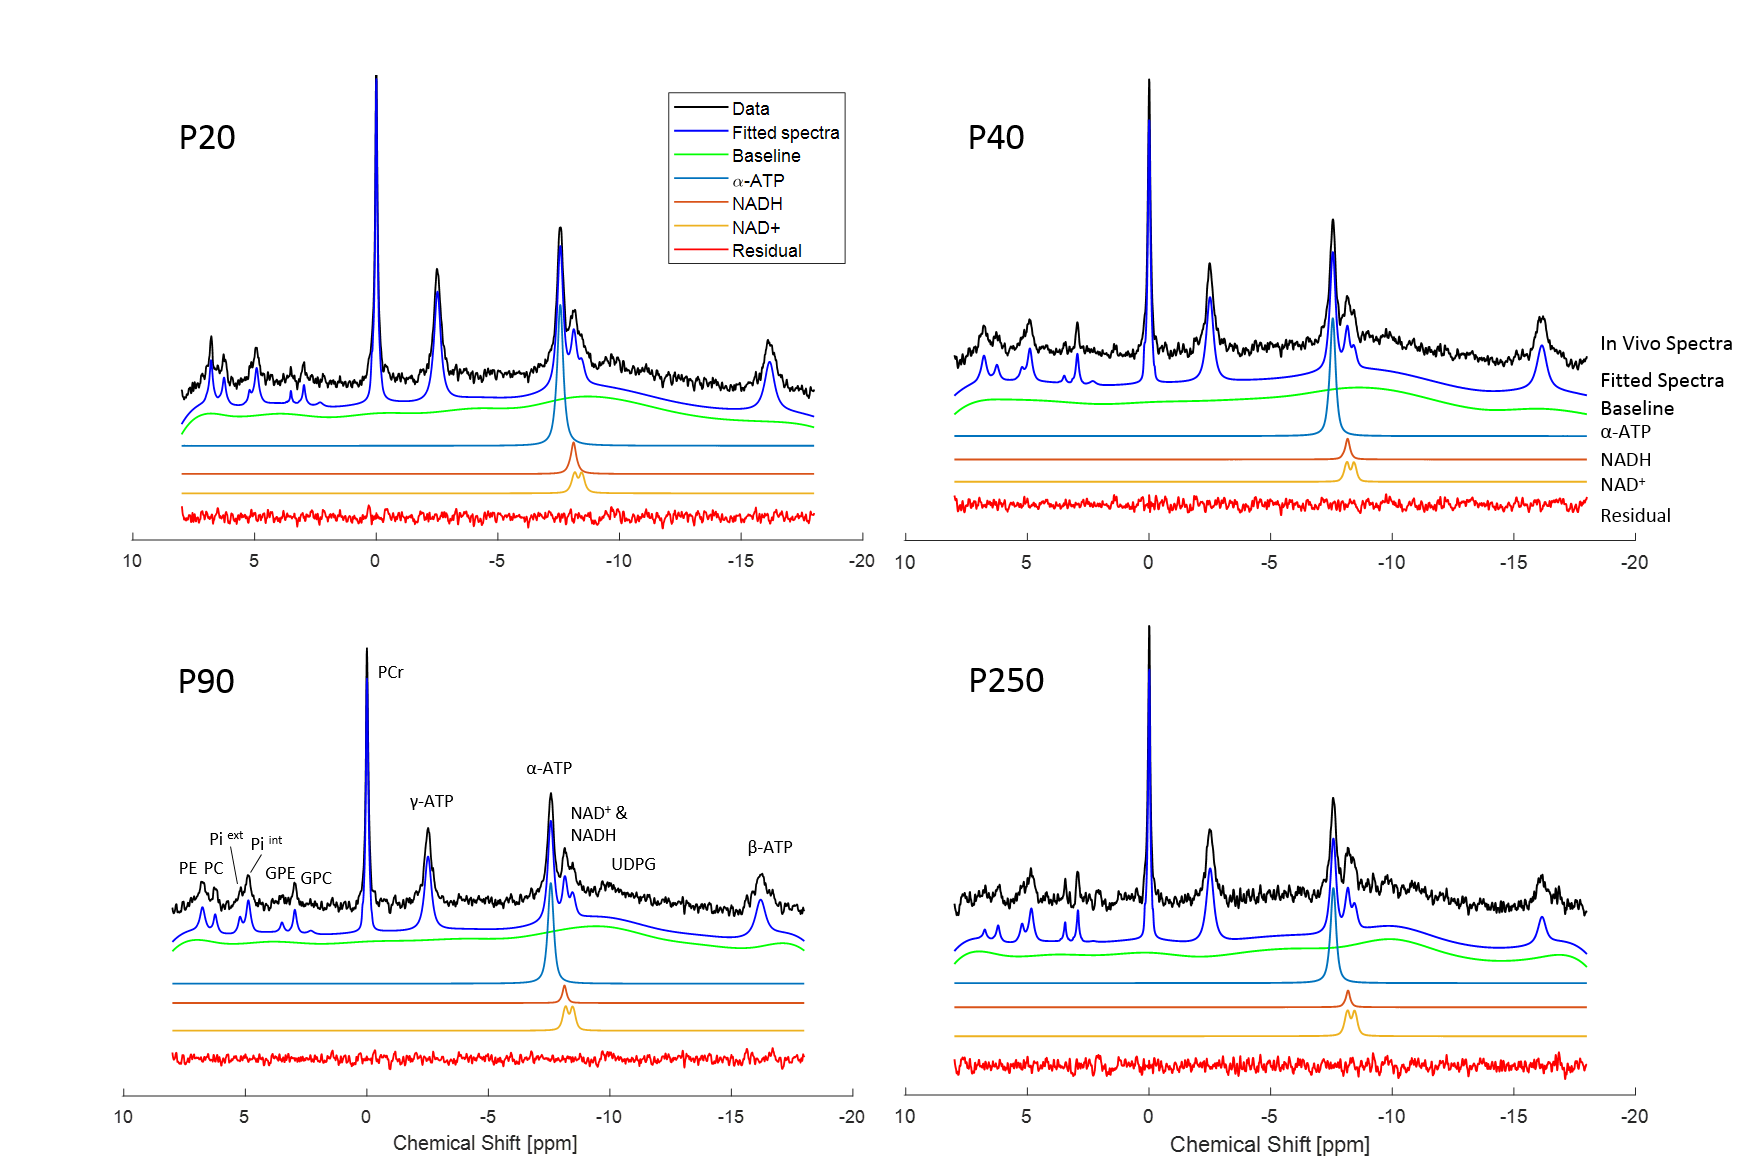
Figure 1 : In Vivo 31P-MR spectrum of the mouse brain from P20 to P250 at 14.1T (black, without baseline correction, 10Hz line broadening). The total spectral fit (blue) determined by the LCmodel, the individual fits of a-ATP (blue), NAD+ (yellow), NADH (orange), the baseline (green) and the fitting residual (red) are also shown.