4206
Oxygen-17 MRI Reveals Unchanged Cerebral Metabolic Rate in Aquaporin-4 Knockout Mice1Radiology, Case Western Reserve University, Cleveland, OH, United States, 2Biomedical Engineering, Case Western Reserve University, Cleveland, OH, United States, 3Neurology, Case Western Reserve University, Cleveland, OH, United States, 4Physiology and Biophysics, Case Western Reserve University, Cleveland, OH, United States
Synopsis
This study aimed at investigating the role of aquaporin-4 (AQP-4)-facilitated gas transport in regulating cerebral metabolism. Cerebral metabolic rate of oxygen (CMRO2) was quantified in AQP-4 knockout and wildtype control mice using oxygen-17 (17O) MRI. Our results showed no change in CMRO2 in AQP-4 knockout mice, suggesting that AQP4-facilitated gas transport is not a rate-limiting factor in cerebral metabolism in anesthetized mice.
Introduction
Aquaporin-4 (AQP-4) is a membrane protein that regulates water exchange across the blood-brain barrier. In addition, the central pore of an AQP-4 tetramer has also been shown to be permeable to gases such as oxygen, carbon dioxide, nitric oxide, and ammonia. Impaired tissue oxygenation in areas remote from brain microvessels in AQP-4 knockout (AQP4-KO) mice has been observed during cortical spreading depression, suggesting oxygen deficiency in AQP4-KO mice when metabolic demand is high1. However, the role of AQP-4 in regulating basal cerebral metabolism is not understood. In the current study, we investigated the role of AQP4-facilitated gas transport in regulating basal cerebral metabolism by quantifying cerebral metabolic rate of oxygen (CMRO2) in AQP4-KO and wildtype control mice using oxygen-17 (17O) MRI.
Methods
Five three-month old AQP4-KO and four age-matched wild type (WT) mice were imaged on a Bruker 9.4T scanner. A custom-built 2-cm surface coil was used for 17O image acquisition. An in-house built oxygen/nitrogen mixer was used to mix oxygen gas with nitrogen using a 3-way vacuum lifter (McMaster-Carr, OH). At baseline, a mixture of 16O2 (~30%), N2 (~70%), and isoflurane (1-2%) was delivered through a nose cone. Once respiration rate was stabilized, oxygen supply was switched to 17O2 (70% enrichment) for 2-4 min and then switched back to 16O2. Dynamic 17O imaging data were acquired continuously using a golden-angle based, stack-of-stars acquisition scheme2. Natural abundance 17O images were acquired at baseline with 16O2 inhalation for 5 minutes, followed by data acquisition for 2-4 minutes during 17O2 inhalation and another 15 minutes after switching back to 16O2. Imaging parameters were: TR/TE, 9 ms/0.37 ms; FOV, 6.4×6.4×1.25 cm3; matrix size, 32×32×5, number of averages, 24. These parameters yielded a nominal voxel size of 10 μL. During reconstruction, the k-space filter was shifted by 21 spokes from one-time frame to the next, leading to a temporal resolution of 14 seconds. Subsequently, CMRO2 maps were calculated from reconstructed images.
Results
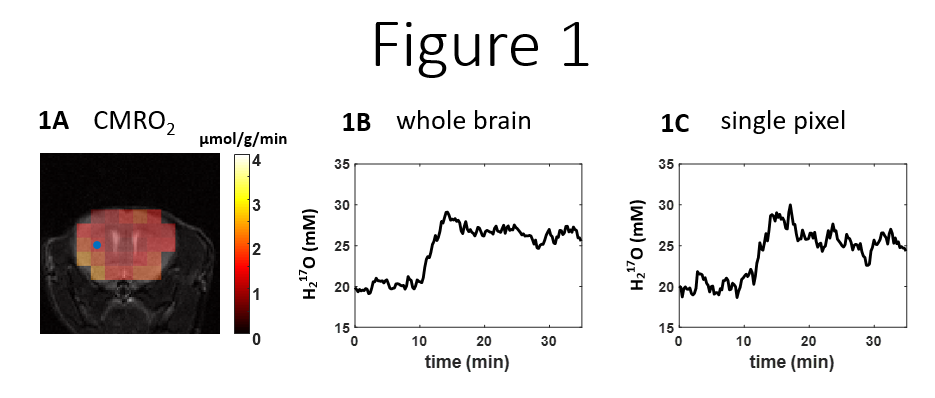
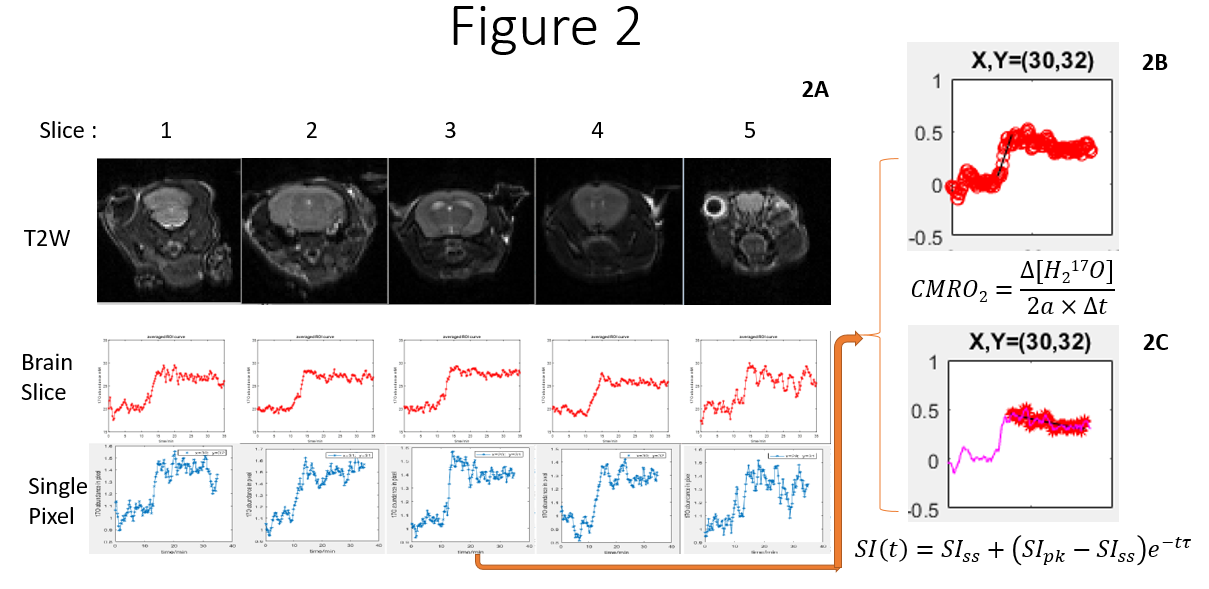
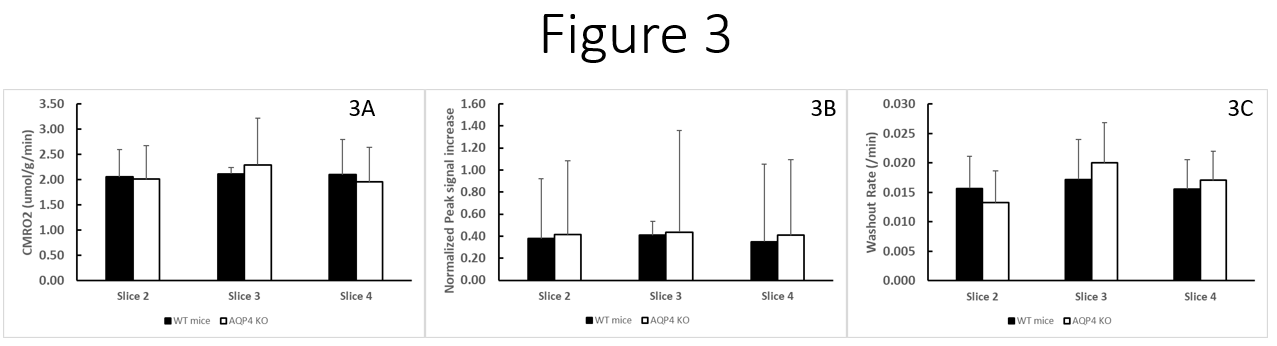
Both AQP4-KO and WT mice showed a 30 to 40% increase in H217O signal after 2 to 4 minutes inhalation of 70% enriched 17O2 gas. Figure 1 shows representative signal changes in the entire brain and an imaging voxel. The SNR allowed robust quantification of CMRO2 by fitting signal changes during 17O2 inhalation with a linear model (Figure 2). AQP4-KO mice showed no significant difference in CMRO2 compared to WT mice. Mean CMRO2 in AQP4-KO and WT mice were 2.0 and 2.2 µmol/g/min, respectively, which is in agreement with CMRO2 reported in literature (2 to 3 µmol/g/min)3-4. In addition, no significant change of H217O washout rate was detected (Figure 3).Discussion & Conclusion:
Our current study suggests that cerebral metabolic rate at anesthetized state was similar between n AQP4-KO and WT mice. Previously, we also observed unaltered cerebral blood flow in AQP4-KO mice5. These results suggest that AQP4-facilitated gas transport was not a rate-limiting factor for cerebral metabolism when oxygen demand is low. The role of AQP4 in cerebral metabolism at high metabolic demand requires further investigation.Acknowledgements
This study is supported by NIH grant number R01 EB23704 (Yu) and N00014-16-1-2535 (Boron).References
- Thrane AS, Takano T, Thrane VR, Wang F, Peng W, Ottersen OP, Nedergaard M, Nagelhus EA. In vivo NADH fluorescence imaging indicates effect of aquaporin-4 deletion on oxygen microdistribution in cortical spreading depression. Journal of Cerebral Blood Flow & Metabolism. 2013 Jul;33(7):996-9.
- Liu Y, Zhang Y, Wu C, Zhu J, Wang C, Tomko N, Linetsky MD, Salomon RG, Ramos‐Estebanez C, Wang Y, Yu X. High‐resolution dynamic oxygen‐17 MR imaging of mouse brain with golden‐ratio–based radial sampling and k‐space–weighted image reconstruction. Magnetic resonance in medicine. 2018 Jan;79(1):256-63.
- Zhu X-H, Chen JM, Tu T-W, Chen W, Song S-K. Simultaneous and noninvasive imaging of cerebral oxygen metabolic rate, blood flow and oxygen extraction fraction in stroke mice. Neuroimage [Internet] 2013;64:437–447. doi: 10.1016/j.neuroimage.2012.09.028.
- Cui W, Zhu XH, Vollmers ML, Colonna ET, Adriany G, Tramm B, Dubinsky JM, Öz G. Non-invasive measurement of cerebral oxygen metabolism in the mouse brain by ultra-high field 17O MR spectroscopy. Journal of Cerebral Blood Flow & Metabolism. 2013 Dec;33(12):1846-9.
- Zhang, Y., Erokwu, B., Liu, Y., Farr,G., Boron, W., Flask, C., & Yu, X. (2015). Assessing Water Influx and Retention in the Brain of AQP4 Knockout Mice by 17O-MRI. Proceedings of the 23rd Annual Meeting ISMRM (2015)#1997
Figures