4202
Non-invasive assessment of myocardial cell viability based on 23Na triple-quantum signal1Medical Faculty Mannheim, Heidelberg University, Mannheim, Germany, 2Department for Molecular Cardiology and Epigenetics, Heidelberg University, Heidelberg, Germany, 3Institute of Functional Interfaces, Karlsruhe Institute of Technology, Karlsruhe, Germany
Synopsis
Sodium MRI was proposed in addition to cardiovascular magnetic resonance methods to detect viable cells. In this work, a spectroscopic sequence with time proportional phase increments was used to measure single- and triple quantum coherences of the spin 3/2 sodium nuclei simultaneously. We investigated the sodium triple-quantum signal of cardiomyocytes in an MR compatible bioreactor to gain further understanding of the TQ signal of cardiomyocytes under stimulation. This setup may be applied in the future to simulate additional diseases as well as potentially monitor the single-quantum and triple-quantum signal changes, e.g. in hypertrophy and after myocardial infarction in-vivo.
Purpose/Introduction:
Myocardial infarction is an indication for irreversible cell injury. Necrosis follows interruption of blood and oxygen flow in the myocardium. Increased tissue sodium content has been measured in human myocardial infarction with sodium MRI and was proposed as an additional tool to provide information on cell viability.2,3,4 Neonatal cardiomyocytes are an established research tool to study the molecular mechanisms in the heart.5-7 The contraction of cardiomyocytes can be stimulated by a beta-adrenergic agonist, such as Isoprenaline.8 The sodium-potassium pump must maintain the electrochemical gradient across the cell membrane to enable repeated cell contractions.9 Therefore, cardiomyocytes are ideal to study the sodium triple-quantum (TQ) signal which might be attributed to sodium-potassium pump activity. We investigated the TQ signal of neonatal cardiomyocytes in an MR-compatible bioreactor, similar to an ''organ-on-a-chip'' to find out if the TQ signal shows changes under stress conditions.
Methods
Data acquisition: A spectroscopic sequence using time proportional phase increments (TQTPPI)9,10 was used to detect the triple-quantum signal and the single-quantum signal simultaneously at 9.4T (Biospec, Bruker, Germany) (Figure2). An in-house built transmit/receive 23Na surface coil was used, and the acquisition of a sodium image confirmed correct placement.
Specimen: After isolation, a total of 10 Mio neonatal cardiomyocytes, were cultivated on two 800 µm diameter microcavity chips using DMEM cell-culture-medium (ThermoFisherScientific). After two days in the incubator, the chips showed viable 3D-aggregates in the microcavities, visible by a synchronized beating of the cell compounds within the microcavities observed by standard light microscopy. The confirmed viable microcavity arrays were inserted into the MR compatible bioreactor (Figure1).
Experiments: We measured the TQTPPI signal for 10 Mio cells on two microcavity arrays at 31°C in (a) normal perfusion (b) normal perfusion with Isoprenaline stimulation (c) perfusion stop (d) reperfusion. For the stimulation 44.4mg Isoprenaline was added to 35.9ml 0.9% saline solution to attain a 5mM solution which was further diluted 1:5 with cell-medium to get a 1mM solution. To 30ml cell medium we added 40µl of the 1mM solution of Isoprenaline. After the bolus ran through the system(1h), it was diluted in the 100ml overall medium reservoir. Isoprenaline stimulation of the cardiomyocytes was confirmed beforehand on a further microcavity array with 4Mio cells by observing an increased beating rate under the microscope.
Results
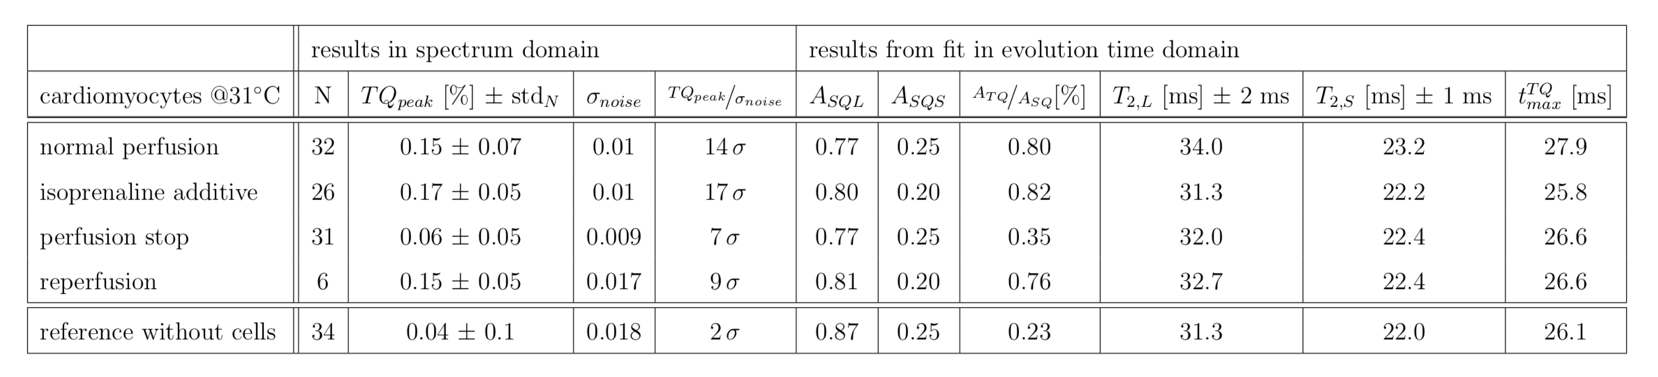
We successfully cultivated neonatal cardiomyocytes on the microcavity arrays. Spontaneous beating was observed via light microscopy for the 3D cell structures within the cavities before as well as after the experiments in the MR compatible bioreactor. Isoprenaline stimulation was performed on an additional array using light microscopy, where an increase in beating frequency was observed. Experiments in the bioreactor under standard perfusion (0.4ml/min) showed a significant mean TQ signal-amplitude of 0.15%(>10 σ). During Isoprenaline stimulation the mean TQ signal was 0.17% (>10 σ). In the subsequent perfusion stop, the mean TQ signal decreased to 0.06%(7σ) which was still significant. Subsequent reperfusion showed a mean TQ signal return to the signal before perfusion stop with 0.15% (9σ). The fit in evolution time resulted in a T2s, T2l of 22ms(±1ms),32.5ms(±2ms) with the maximum triple quantum signal at 26.7ms(±1ms). Further, the fitted triple quantum signal amplitude, ATQ, confirmed the decrease in TQ signal during perfusion stop (Figure3,Table1). Reference measurement results without cells showed a mean TQ signal was 0.04%(2σ) with ATQ about one-fourth of ATQ of cells under perfusion conditions.Discussion
The experiments under standard perfusion and perfusion stop conditions were chosen to mimic the situation in myocardial infarction, where obstruction of blood flow is observed which over longer time periods leads to cell death. We measured a significant TQ signal under standard perfusion which declined in the non-perfusion state, hence the TQ signal could be a potential marker for blood flow restricted tissue as well as for detecting live cells. Isoprenaline stimulation did not show a notable increase in TQ-signal. However, it was reported that Isoprenaline stimulation in cardiomyocytes is affected by culture conditions. Bovine serum which was added to the medium already acts as a stimulator for hypertrophy in neonatal cardiomyocytes. Therefore, cells should be cultured in basal medium to study the hypertrophic response due to Isoprenaline.6,8Conclusion
In combination with reference measurements, that showed no significant TQ signal we suggest that the TQ signal of cardiomyocytes could be useful as an indicator for normoxic and thus actively metabolizing cells, reflecting the activity in transmembrane sodium transport. Further, the unique bioreactor setup enabled mimicking of hypertrophy ex-vivo and observation of the corresponding TQ signal. In translation to the clinic, in vivo cardiac TQ signal could provide additional information that relates to cell function.Acknowledgements
No acknowledgement found.References
1. Andrew E. Arai, chapter 18 - Acute Myocardial Infarction: Cardiovascular Magnetic Resonance Detection and Characterization, Cardiovascular Magnetic Resonance (Second Edition), 2010, p 241-252, ISBN 97804430668632.
2. Madelin, Guillaume and Ravinder R Regatte. “Biomedical applications of sodium MRI in vivo” Journal of magnetic resonance imaging : JMRI vol. 38,3 (2013): 511-29.
3. Ouwerkerk R, Bottomley PA, Solaiyappan M, et al. Tissue sodium concentration in myocardial infarction in humans: A quantitative Na-23 MR imaging study. Radiology. 2008;248(1):88–96.
4. Bottomley, PA 2016, 'Sodium MRI in human heart: A review' NMR in Biomedicine, vol 29, no. 2, pp. 187-196.
5. Peter, Angela K et al. “Biology of the cardiac myocyte in heart disease” Molecular biology of the cell vol. 27,14 (2016): 2149-60.
6. Wijnen, W. J., Leenders, J. J., Hiller, M., van der Made, I., van den Oever, S., Pinto, Y. M., & Creemers, E. E. Hypertrophy of cultured neonatal rat cardiomyocytes.
7. Backs J, Worst BC, Lehmann LH, et al. Selective repression of MEF2 activity by PKA-dependent proteolysis of HDAC4. J Cell Biol. 2011;195(3):403-15.
8. Shen, J. (2006) ‘Isoprenaline enhances local Ca2+ release in cardiac myocytes’, Acta Pharmacologica Sinica. CPS and SIMM, 27, p. 927
9. Clausen, T. (2003) ‘Na+-K+ Pump Regulation and Skeletal Muscle Contractility’, Physiological Reviews. American Physiological Society, 83(4), pp. 1269–1324.
10. Schepkin, V. D., Neubauer, A., Nagel, A. M., & Budinger, T. F. Comparison of potassium and sodium binding in vivo and in agarose samples using TQTPPI pulse sequence. Journal of Magnetic Resonance, 277, (2017) 162–168.
11. Neubauer, A., Nies, C., Schepkin, V. D., Hu, R., Malzacher, M., Chacón-Caldera, J., Schad, L. R. Tracking protein function with sodium multi quantum spectroscopy in a 3D-tissue culture based on microcavity arrays. Scientific Reports, 7(1), (2017) 3943.
Figures
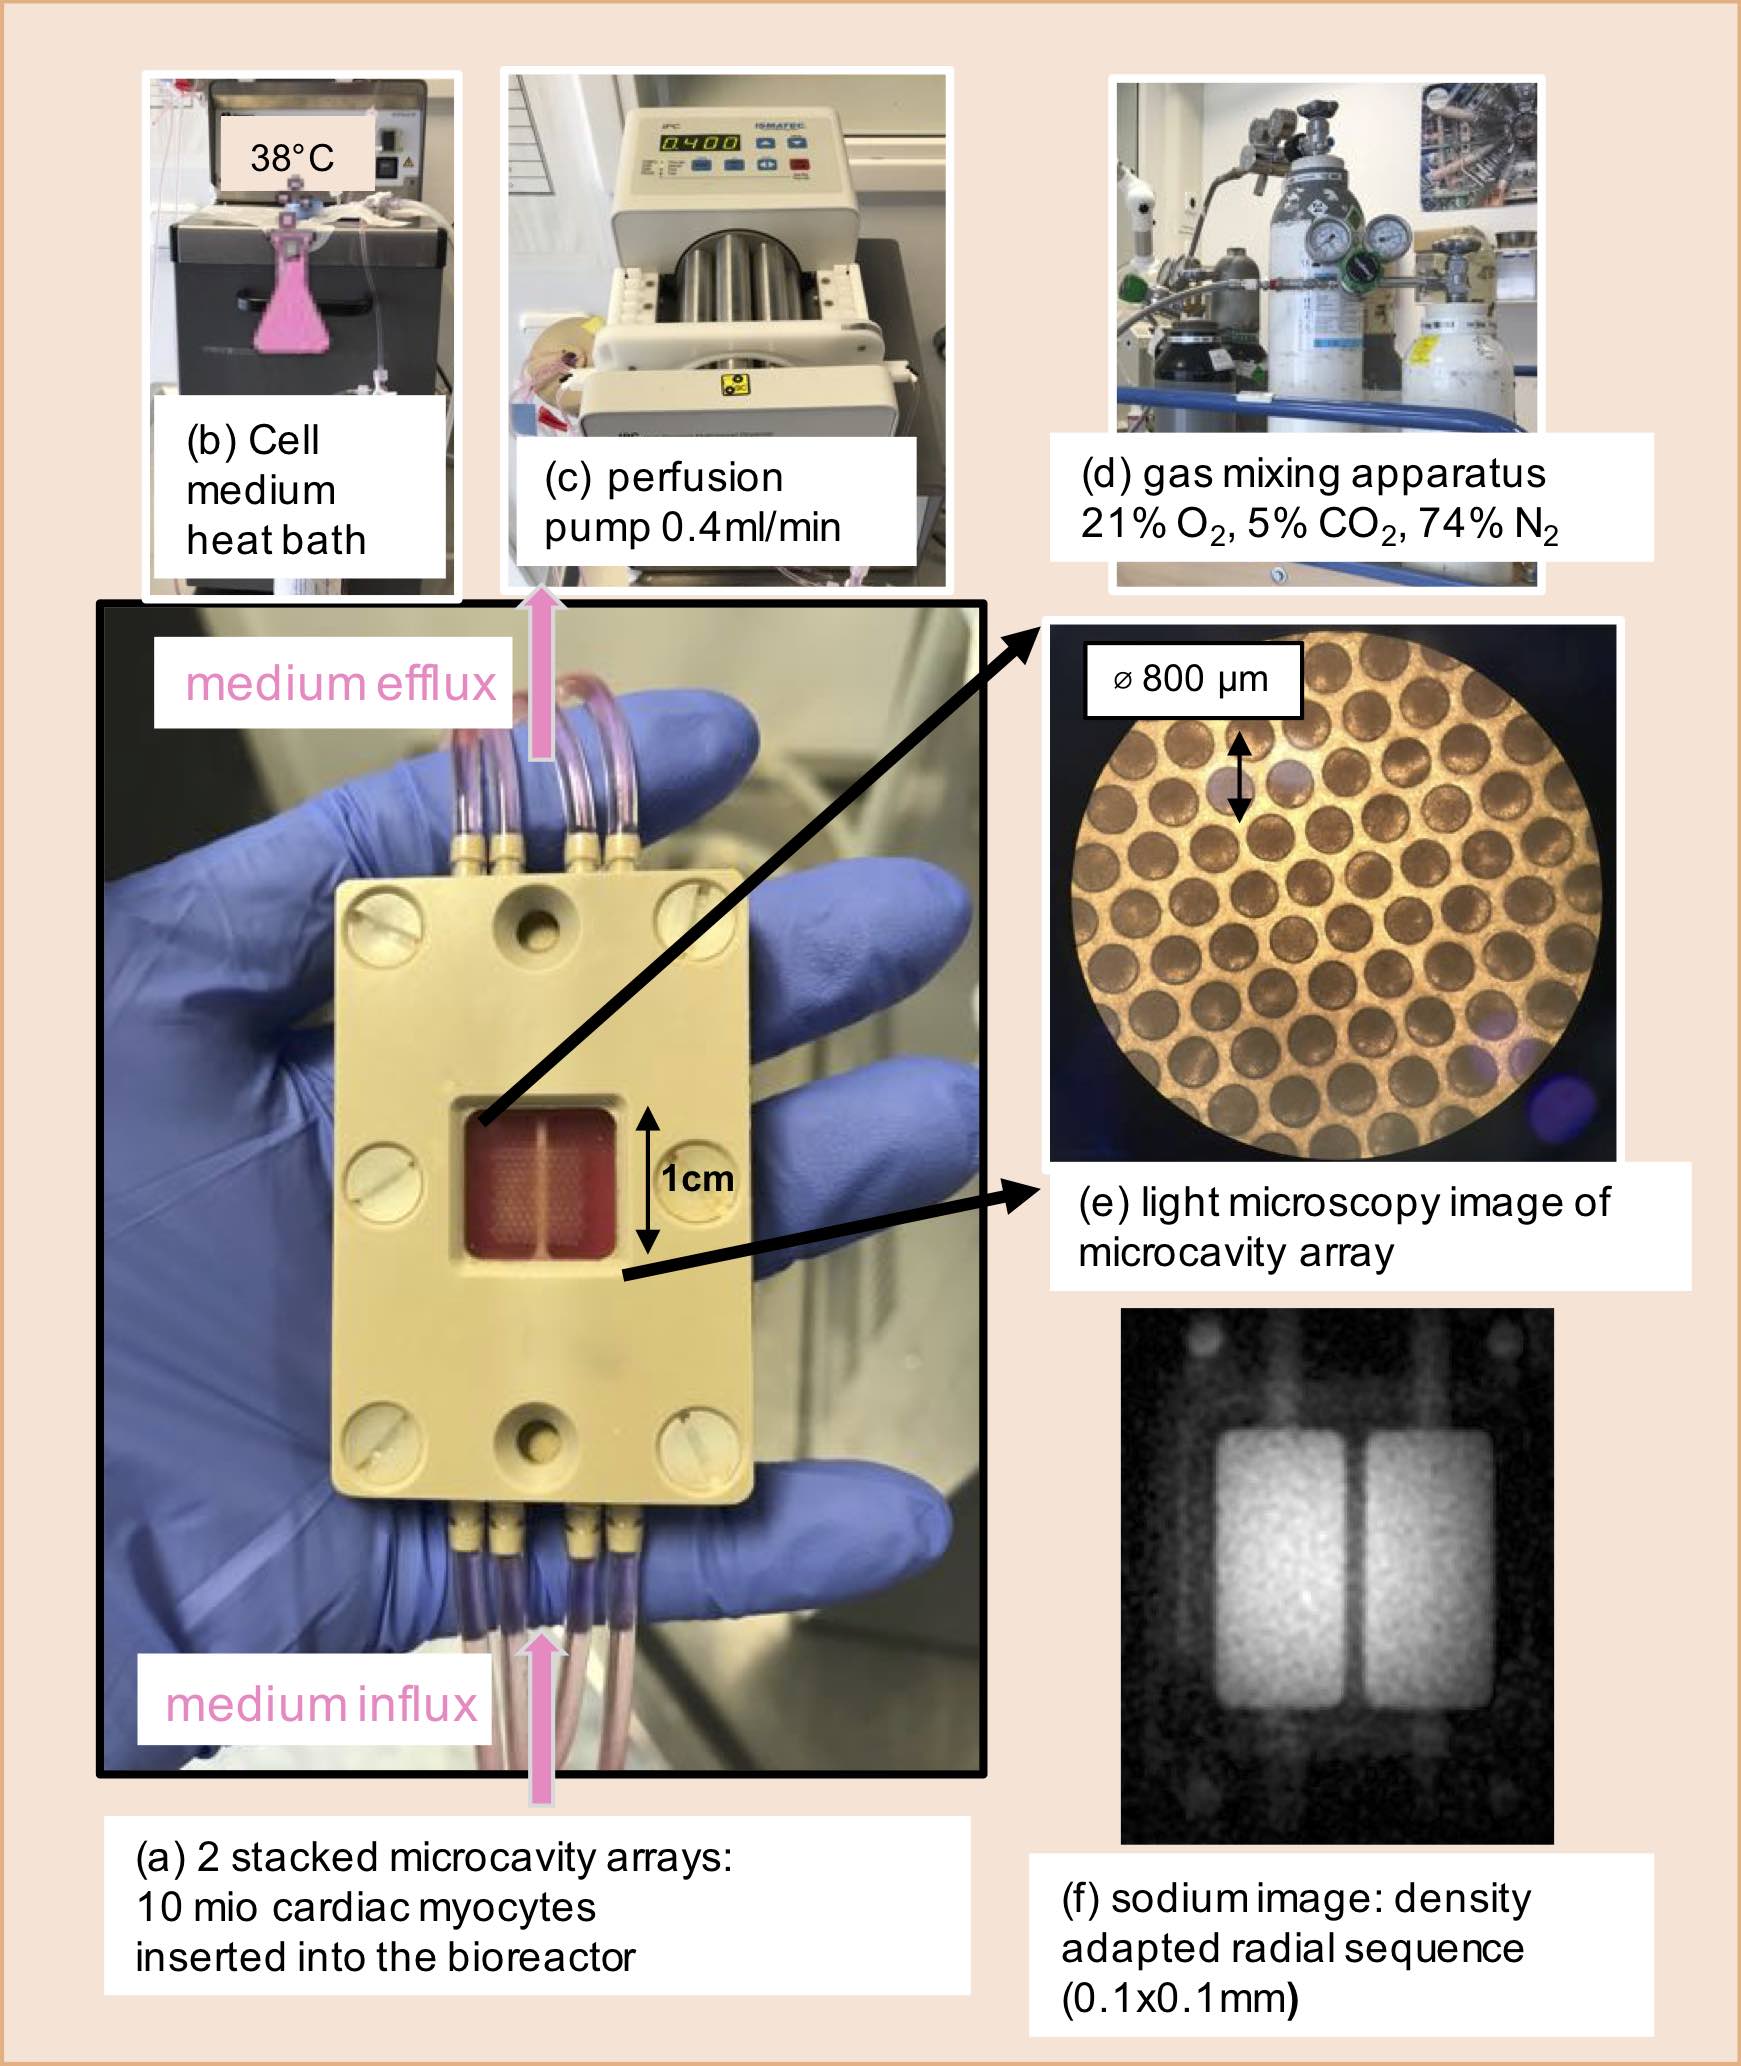
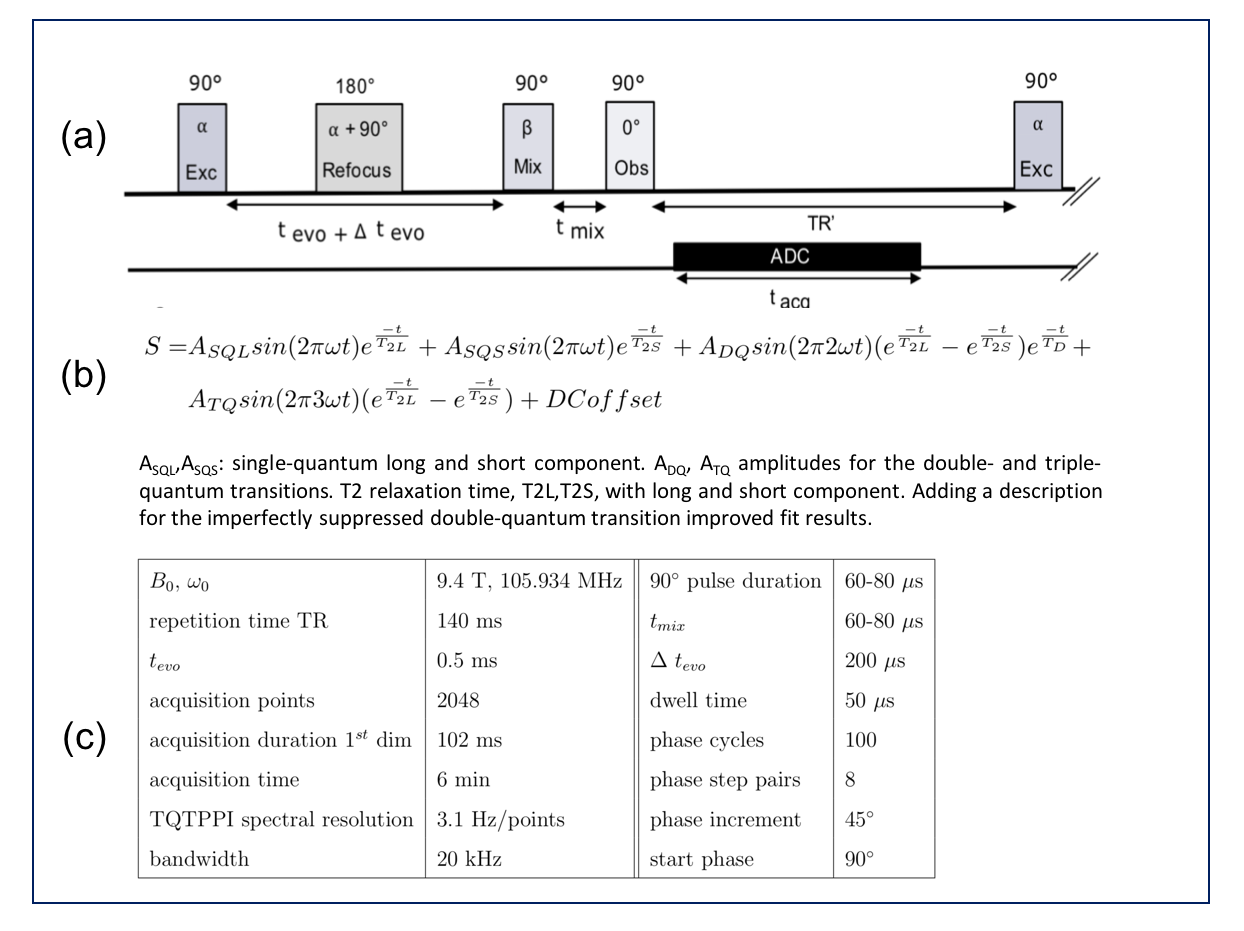
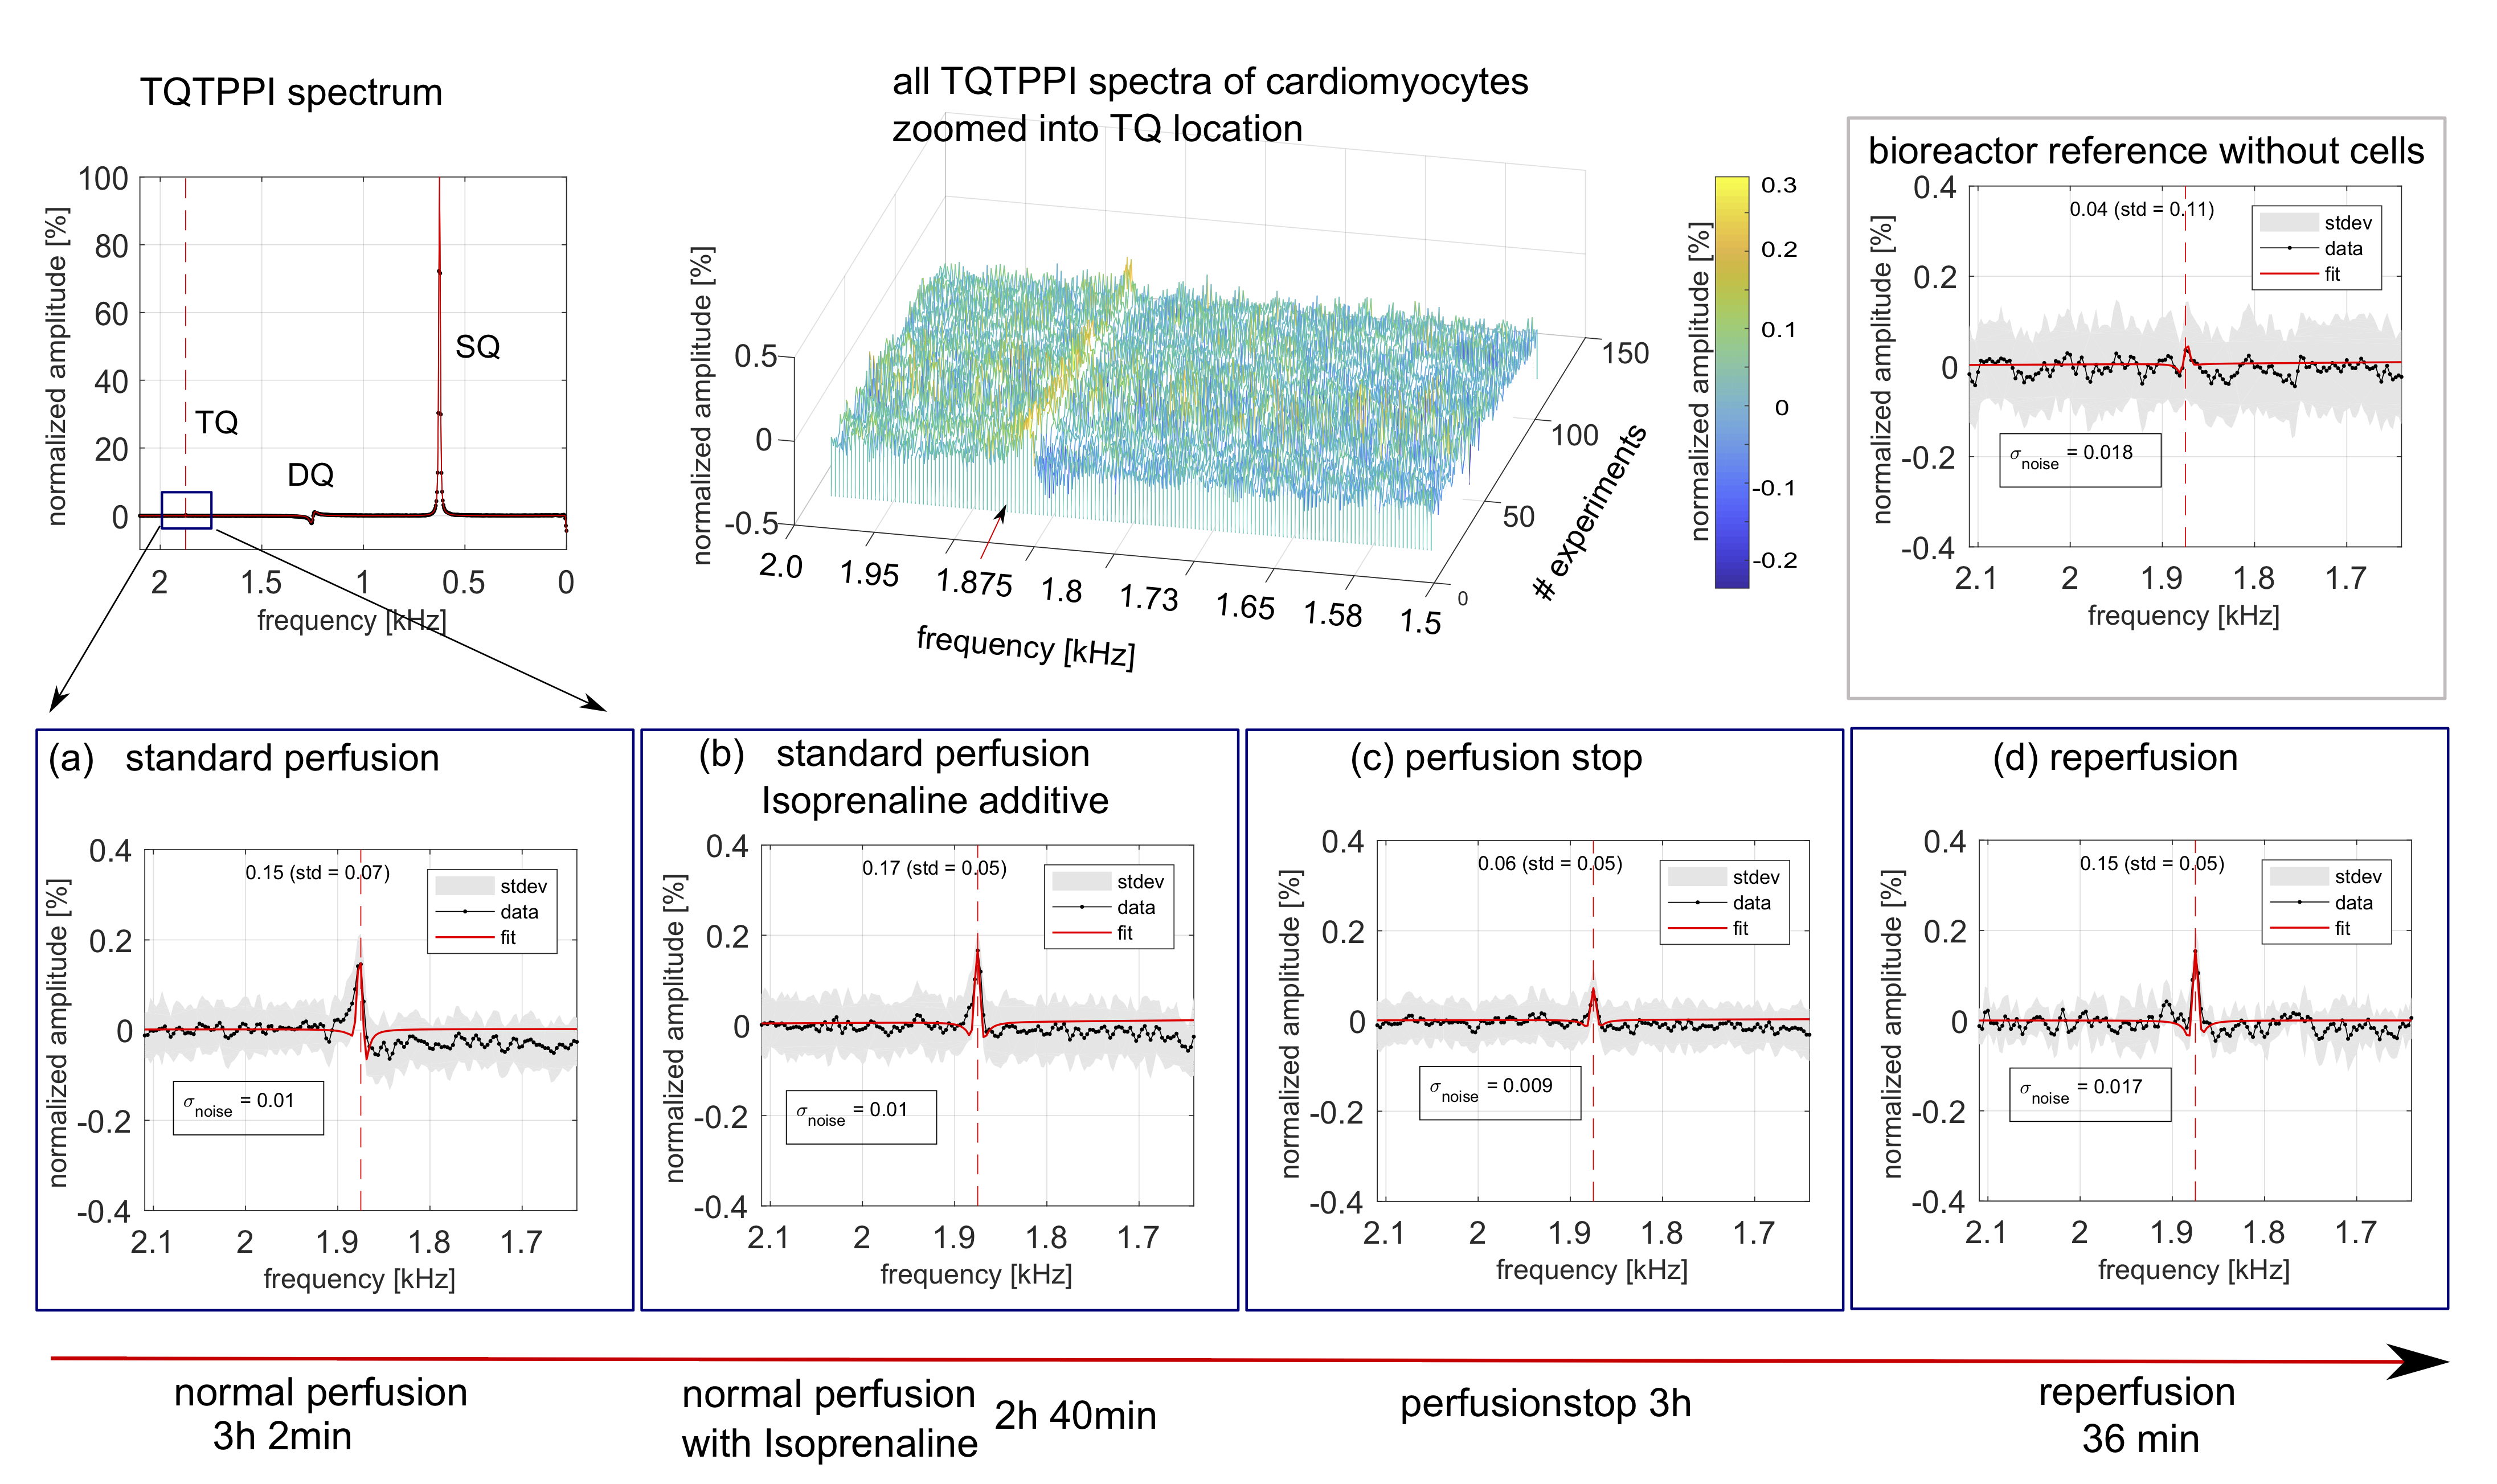
Figure3: The TQTPPI spectra results for cardiomyocytes at 31°C are presented. In the first row the positions of the single-quantum (SQ), double-quantum (DQ) and triple-quantum (TQ) transition are indicated for the full TQTPPI spectrum. To the right, the individual spectra of all cell experiments are shown, where the TQ signal position is visible. The bioreactor reference results without cells show no TQ signal compared to baseline value. In the second row (a)-(d) the resulting spectra zoomed to the TQ position are given.