4201
Sodium MR Imaging of Porcine Articular Cartilage on a Whole-body 10.5T MR System – Initial Results1Center for Magnetic Resonance Research, University of Minnesota, Minneapolis, MN, United States, 2Department of Radiology, University of Minnesota, Minneapolis, MN, United States, 3Department of Veterinary Population Medicine, University of Minnesota, St. Paul, MN, United States, 4Department of Veterinary Clinical Sciences, University of Minnesota, St. Paul, MN, United States
Synopsis
New advancements in ultrahigh-field human whole body 10.5T MR imaging hold potential for improvements in sodium imaging of articular cartilage. We investigated optimal imaging parameters and image quality for the evaluation of sodium concentrations in porcine articular cartilage using a 3D-UTE sequence and birdcage sodium knee coil at 10.5T. The mean sodium concentrations in femoral and patellar cartilage of a porcine stifle joint were 298 and 307 mM/L, respectively. These values are in good agreement with previously-published concentrations. Our findings support the feasibility of sodium imaging of articular cartilage at 10.5T and motivate future in vivo studies.
PURPOSE:
The health and functional properties of articular cartilage are closely related to its glycosaminoglycan (GAG) concentration, which can be evaluated with sodium MR imaging [1]. Previous in vivo 7T studies employed sodium imaging to evaluate cartilage degeneration [2] and repair tissue quality [3]. Unfortunately, due to low concentration and short T2 relaxation times, sodium images are acquired with low spatial resolution, which makes them prone to partial volume artifacts that can adversely affect measurement of sodium concentrations. The purpose of this study is to investigate the feasibility of sodium MR imaging of porcine articular cartilage on a 10.5T whole-body MR system, which is expected to provide a significant gain in signal-to-noise ratio (SNR) compared to 7T systems. With the broader goal of translating to in vivo human studies, the aims of this study were to: (i) evaluate SNR and image quality in sodium images of a piglet hind limb acquired with different bandwidths (BWs) and resolutions with a human-sized transceiver volume coil; and (ii) calculate sodium concentrations in femoral and patellar cartilage of the piglet stifle (i.e., knee) joint.METHODS:
Two hind limb specimens from six-week-old male piglets were harvested and stored at -20oC. Specimens were thawed at room temperature prior to MR imaging on a Siemens Magnetom 10.5T system [4]. For sodium imaging, a commercial Siemens 3T birdcage knee coil was retuned from 3T proton frequency to 10.5T sodium frequency (118.25 MHz). B0 shimming and proton imaging were performed using a pair of fractionated proton dipole antennas [4] positioned on top of the specimen inside the sodium knee coil. Both dipole antennas transmitted with equal power and phase and were removed from the sodium knee coil prior to sodium imaging. Water-selective MEDIC images (TR/TE: 13.0/7.0 ms, 3 echoes, resolution: 1.0 mm isotropic, TA: 3:03 min) served as a morphological reference. Quantitative sodium data were sampled with a radial 3D-UTE sequence (TR/TE: 100.0/0.55 ms, FA: 90 degrees, non-selective excitation with a 1 ms hard pulse, 16000 projections, 224 samples/projection, TA: 27 min) using BWs of 11.2 and 22.4 kHz over a FOV of 224 mm. Specimens were imaged together with three 6% agar gel calibration phantoms with sodium concentrations of 333, 666, and 1000 mM/L, respectively. Each sodium data set was reconstructed to four different in-plane resolutions (1.0×1.0, 1.5×1.5, 2.0×2.0 and 2.5×2.5 mm2) with a constant slice thickness of 3 mm. Switching delays of gradient coils were taken into account in the image reconstruction. The SNR in femoral cartilage was calculated as the ratio between the mean signal intensity in cartilage and the standard deviation of signal in an object-free area. A sodium calibration curve was calculated from a linear fit of the mean sodium signal intensities of agar gel phantoms with known sodium concentration. After pixel-by-pixel calibration, sodium concentration maps were corrected for a cartilage water content of 75%. Region-of-interest (ROI) evaluations were performed with ImageJ software. Femoral, tibial, and patellar cartilage ROIs were drawn on MEDIC images and subsequently transferred to the corresponding sodium images that were interpolated to the resolution of MEDIC images.RESULTS:
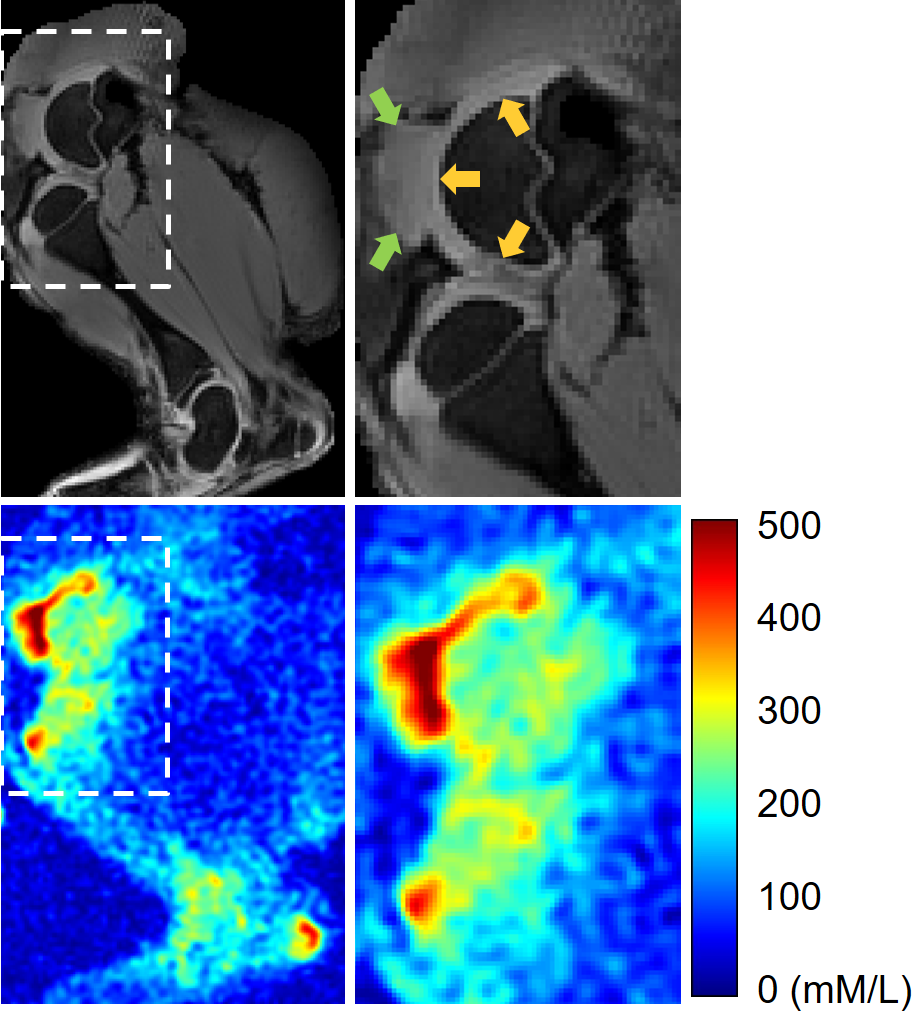
(i) Sodium 10.5T images depicted GAG-associated sodium within the cartilage in both the porcine stifle (i.e., knee) and hock (i.e., ankle) joints. Both sodium data sets (BW of 11.2 and 22.4 kHz) reconstructed to a resolution of 1.5×1.5×3.0 mm3 resulted in sufficiently high SNR (>20) for the evaluation of sodium concentrations in the cartilage (Fig. 1). Sodium images acquired with BW of 22.4 kHz were less prone to blurring artifacts than those acquired with BW of 11.2 kHz. The evaluations of sodium concentration in the cartilage were therefore performed using the 22.4 kHz data. (ii) The mean sodium concentrations in femoral and patellar cartilage of the stifle joint were 298, and 307 mM/L, respectively (Fig. 2).DISCUSSION:
We have demonstrated the feasibility of sodium MR imaging using a human knee coil at 10.5T. B0 shimming combined with an image acquisition BW of 22.4 kHz helped to minimize blurring artifacts from off-resonance effects. We report the sodium concentrations of porcine articular cartilage, which serve as a proxy measure of glycosaminoglycan (GAG) content. Our sodium concentration results are in good agreement with a previously reported sodium concentration of 256 mM/L measured in patellar cartilage of similarly aged piglets at 4T [1]. Our findings support the translation of in vivo sodium MR imaging to the whole-body 10.5T system, which may significantly improve image quality and quantification of sodium concentration in articular cartilage.Acknowledgements
This study was supported by the NIH (R01 AR070020, P41 EB015894, and S10 RR029672).References
[1]. Wheaton AJ, Borthakur A, Dodge GR, et al. Sodium Magnetic Resonance Imaging of Proteoglycan Depletion in an In Vivo Model of Osteoarthritis. Acad Radiol. 2004; 11: 21-28.
[2]. Madelin G, Xia D, Brown R, et al., Longitudinal study of sodium MRI of articular cartilage in patients with knee osteoarthritis: initial experience with 16-month follow-up. Eur Radiol. 2018; 28: 133-142.
[3]. Zbyn S, Stelzeneder D, Welsch GH, et al., Evaluation of native hyaline cartilage and repair tissue after two cartilage repair surgery techniques with 23Na MR imaging at 7 T: initial experience. Osteoarthritis Cartilage. 2012; 20: 837-45.
[4]. Ertürk MA, Wu X, Eryaman Y, et al. Toward imaging the body at 10.5 tesla. Magn Reson Med. 2016; 77: 434-443.
Figures