4190
Retrospective evaluation of the maximum MR image artifact size according to ASTM F2119 with respect to sequences and slice orientations relevant for MR compatibility testing1MR:comp GmbH, Gelsenkirchen, Germany, 2Erwin L. Hahn Institute for MR Imaging, University of Duisburg-Essen, Essen, Germany, 3High-Field and Hybrid MR Imaging, University Hospital Essen, Essen, Germany, 4MRI-STaR-Magnetic Resonance Institute for Safety, Technology and Research GmbH, Gelsenkirchen, Germany
Synopsis
This study examines the influence of sequence type, slice orientation and test object orientation on artifact size for medical implants. For this purpose, 79 different objects were evaluated according to ASTM F2119 and the influence of the different parameters was investigated. The evaluation shows that gradient echo sequences more often represented the worst case MR image artifact size as compared to the corresponding spin echo sequences. In addition to this result, the sagittal slice orientation, as compared to the transversal slice orientation, was shown to produce the worst case MR image artifact.
Introduction
The appearance of MR image artifacts caused by medical implants depends on many different factors. The standard ASTM F21191 forms the basis of artifact testing for spin echo (SE) and gradient echo (GRE) sequences. The imaging parameters are more firmly defined for small and large test objects (TOs) whereas the orientation of the TO, the slice orientation and the sequences are varied. The influence of these parameters on the artifact size has been shown in serval studies2,3 which investigating individual implants. However, these studies do not evaluate the influence of these parameters over a larger number of TO. Hence, our study evaluated retrospectively the parameters with respect to the worst case MR image artifact size in order to determine the parameters where a worst case artifact most frequently appears.Method
Data acquisition
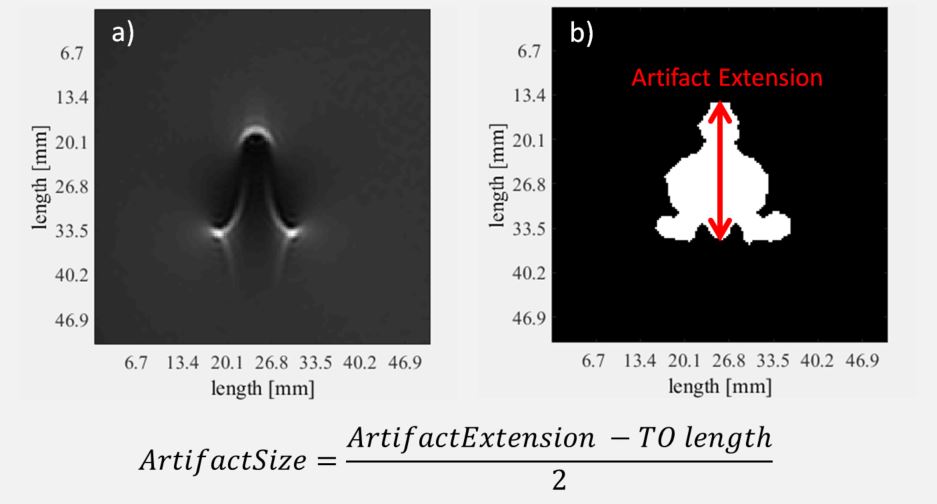
MR image artifact size was evaluated for a total number of 79 TO and on different MR systems (1.5T and 3T) of different manufacturer. The evaluated TOs include smaller cardiovascular implants (e.g. stents or valves), orthopedic components (screws and plates) and larger and more complex implants (e.g. hip or shoulder implants). For each object, MR images with different sequences (GRE and SE), slice orientations (transversal and sagittal) and TO orientations (parallel and perpendicular to the static magnetic field) were acquired and analyzed according to ASTM F2119. The MR image artifact is characterized as the area with a signal intensity change over 30% between the image with and without the TO. The MR image artifact size is defined as the maximum distance from the edge of the TOs to the fringe of the artifact. The determination of the MR image artifact size is shown in Fig. 1.
Data evaluation
To achieve a better comparability between the different TOs, the artifact size was normalized by dividing every artifact size by the corresponding worst case artifact for every TO. Based on these normalized artifact sizes, a Wilcoxon signed-rank test was performed to determine the difference between the artifact sizes depending on the imaging parameter (sequence, slice orientation and TO orientation). For a more detailed examination of the results of the statistical analysis, the difference between the artifact pairs, in which all parameters except one were kept constant, was calculated.
Results
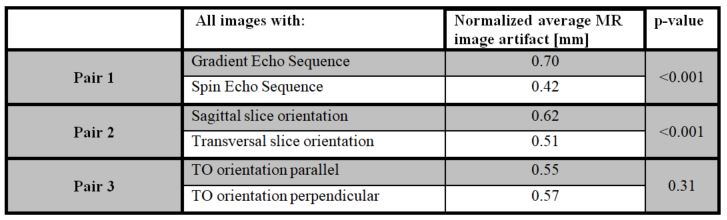
Normalized averaged artifact sizes are summarized in Tab. 1. It has been observed that GRE generates larger artifacts as compared to the corresponding SE sequences. A sagital slice orientation leads also to larger artifacts compared to the corresponidng transversal images.The statistical analysis of these parameters shows a statistical significance for both paramters. No significant difference in artifact size can be observed between the two TO orientations.
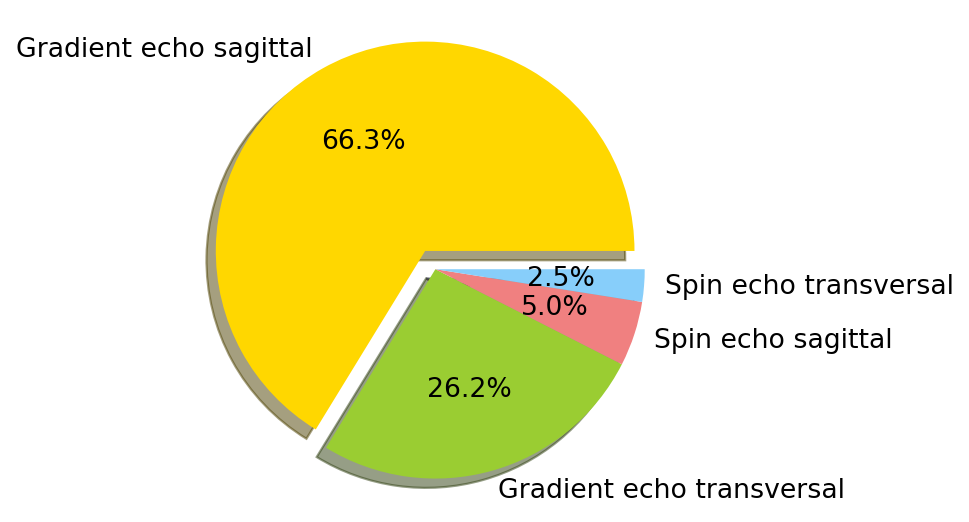
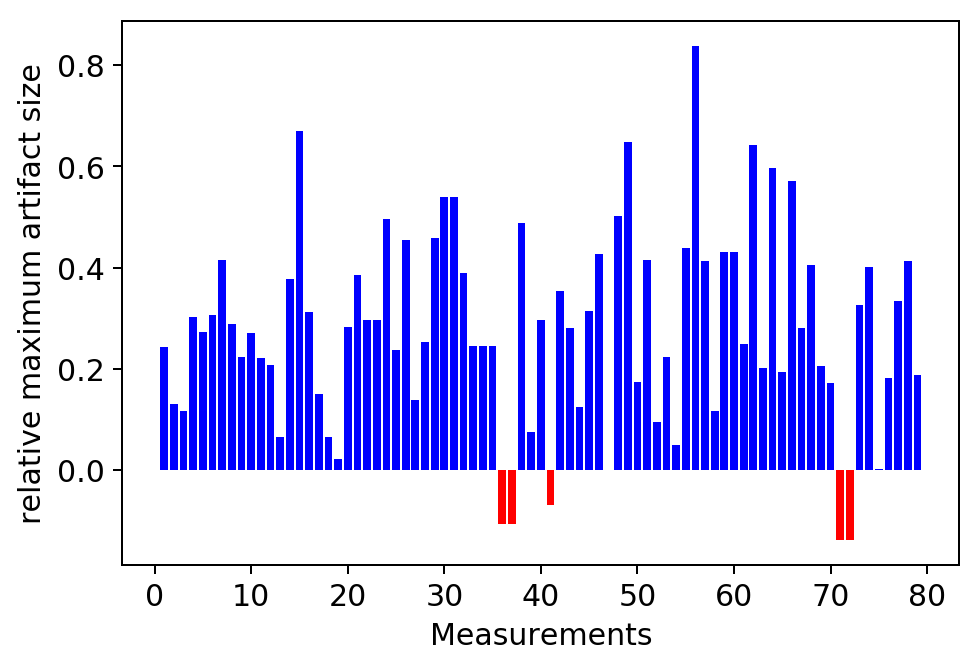
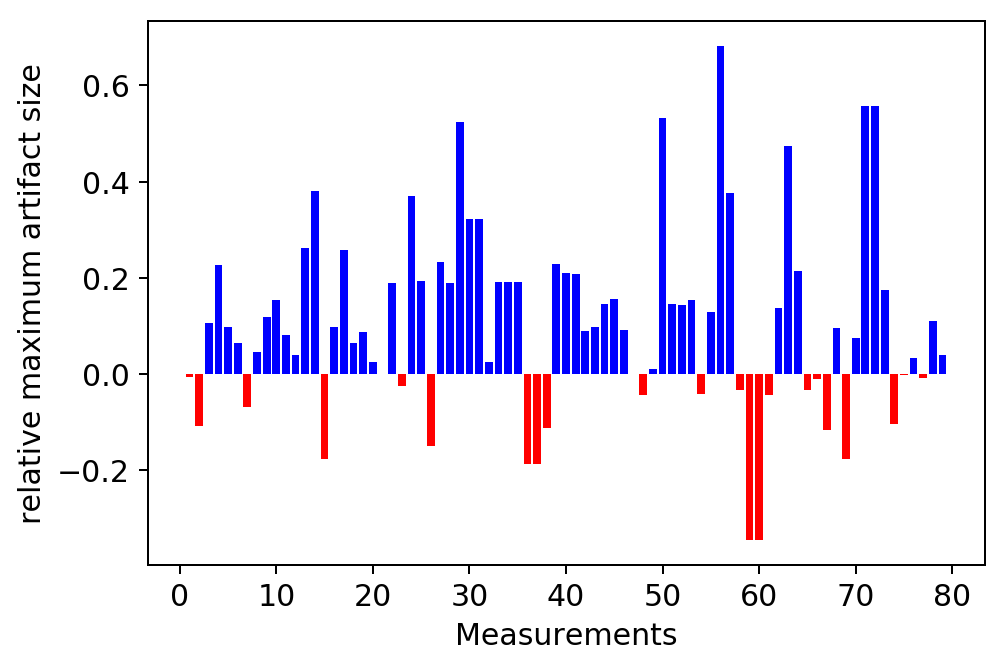
Fig. 2 shows that 92.5% of all worst case artifacts are observed in GRE images whereas only 7.5% of all worst case artifacts are observed in SE. Looking at the difference between the worst case artifact from the SE and the GRE (Fig. 3), the SE produced the worst case artifact in only five cases with a maximum difference of 13.3%. In addition, Fig. 2 shows that in the SE and GRE the sagittal orientation produces more frequent worst case artifacts. On average, an 11% larger artifact was observed in sagittal slice orientation (Fig. 4).
Discussion
The results clearly show that GRE in general produce larger MR image artifacts than SE sequences and sagittal slice orientation most often provides the worst case in artifact size. It is know from literature2,3 that the TO orientation has an influence on the artifact size but the reason for the non-significant difference in our study could be attributed to the fact that the magnetic main axis of the TO does not have to correspond to the geometric longitudinal axis of the TO, which were used for the alignment of the TO.
However, this investigation allows only a qualitative statement about the artifact size for the given sequence parameters defined in the standard, since the artifact size in clinical application additionally depends on many other imaging parameters (e.g. echo time or bandwidth).
Conclusion
In the current version of the ASTM F2119, only the worst case artifact size has to be reported and in order to assess the worst case artifact of medical implants, it is sufficient in most cases to acquire GRE images only. However, in some cases the worst case artifact can also be found in SE images and therefore, should not be omitted in a thorough artifact evaluation.Acknowledgements
No acknowledgement found.References
1. ‘ASTM F2119-07(2013) Standard Test Method for Evaluation of MR Image Artifacts from Passive Implants’. 2013.
2. A. Guermazi, Y. Miaux, S. Zaim, C. G. Peterfy, D. White, and H. K. Genant, ‘Metallic Artefacts in MR Imaging: Effects of Main Field Orientation and Strength’, Clinical Radiology, vol. 58, no. 4, pp. 322–328, Apr. 2003.
3. J. D. Port and M. G. Pomper, ‘Quantification and minimization of magnetic susceptibility artifacts on GRE images’, J Comput Assist Tomogr, vol. 24, no. 6, pp. 958–964, Dec. 2000.
Figures