4185
Avoiding Systematic Errors of Fiber-optic Temperature Probes: MR Thermometry for Safety Assessment of Small Planar Metallic Structures1Department of Radiology, Medical Physics, Medical Center University of Freiburg, Faculty of Medicine, University of Freiburg, Freiburg, Germany, 2Department of Microsystems Engineering - IMTEK, University of Freiburg, Freiburg, Germany, 3BrainLinks-BrainTools, Freiburg, Germany, 4German Cancer Consortium Partner Site Freiburg, German Cancer Research Center (DKFZ), Heidelberg, Germany, 5CorTec GmbH, Freiburg, Germany
Synopsis
Patients with AMIDs are exposed to a significant safety hazard during MRI, as the RF excitation couples to the elongated metallic structures of the AIMD resulting in an unwanted heating of tissue. Temperature measurements are the standard method for heating tests of implants to ensure patient safety during MRI exams. Temperature sensors with a significant size compared to the samples influence the RF absorption of energy and can distort the temperature distribution. MR thermometry can provide a non-invasive 2D alternative.
Introduction
Active implantable medical devices (AIMDs) can restore brain function in patients with neurological or other disorders which increases their quality of life considerably. Unfortunately, patients with AMIDs are exposed to a significant safety hazard during MRI, as the radio-frequency (RF) excitation fields can couple to the elongated metallic structures of the AIMD resulting in an unwanted heating of tissue1. According to the ASTM F21822, temperature measurements are the standard method for heating tests of implants to ensure patient safety during MRI exams. Temperature is measured with fiber-optic temperature probes (FOTP) in a standardized testing environment. Additionally, simulations are increasingly used to calculate scattered field maps of implants exposed to RF excitation and have been codified in the 4-tier-approach described in TS-109743. At the example of implantable planar electrodes for neurological applications, potential systematic errors of the current standards are assessed that occur at small devices due to displacement effects caused by the FOTPs. We propose to use MR thermometry to investigate heating characteristics of such small devices.Methods
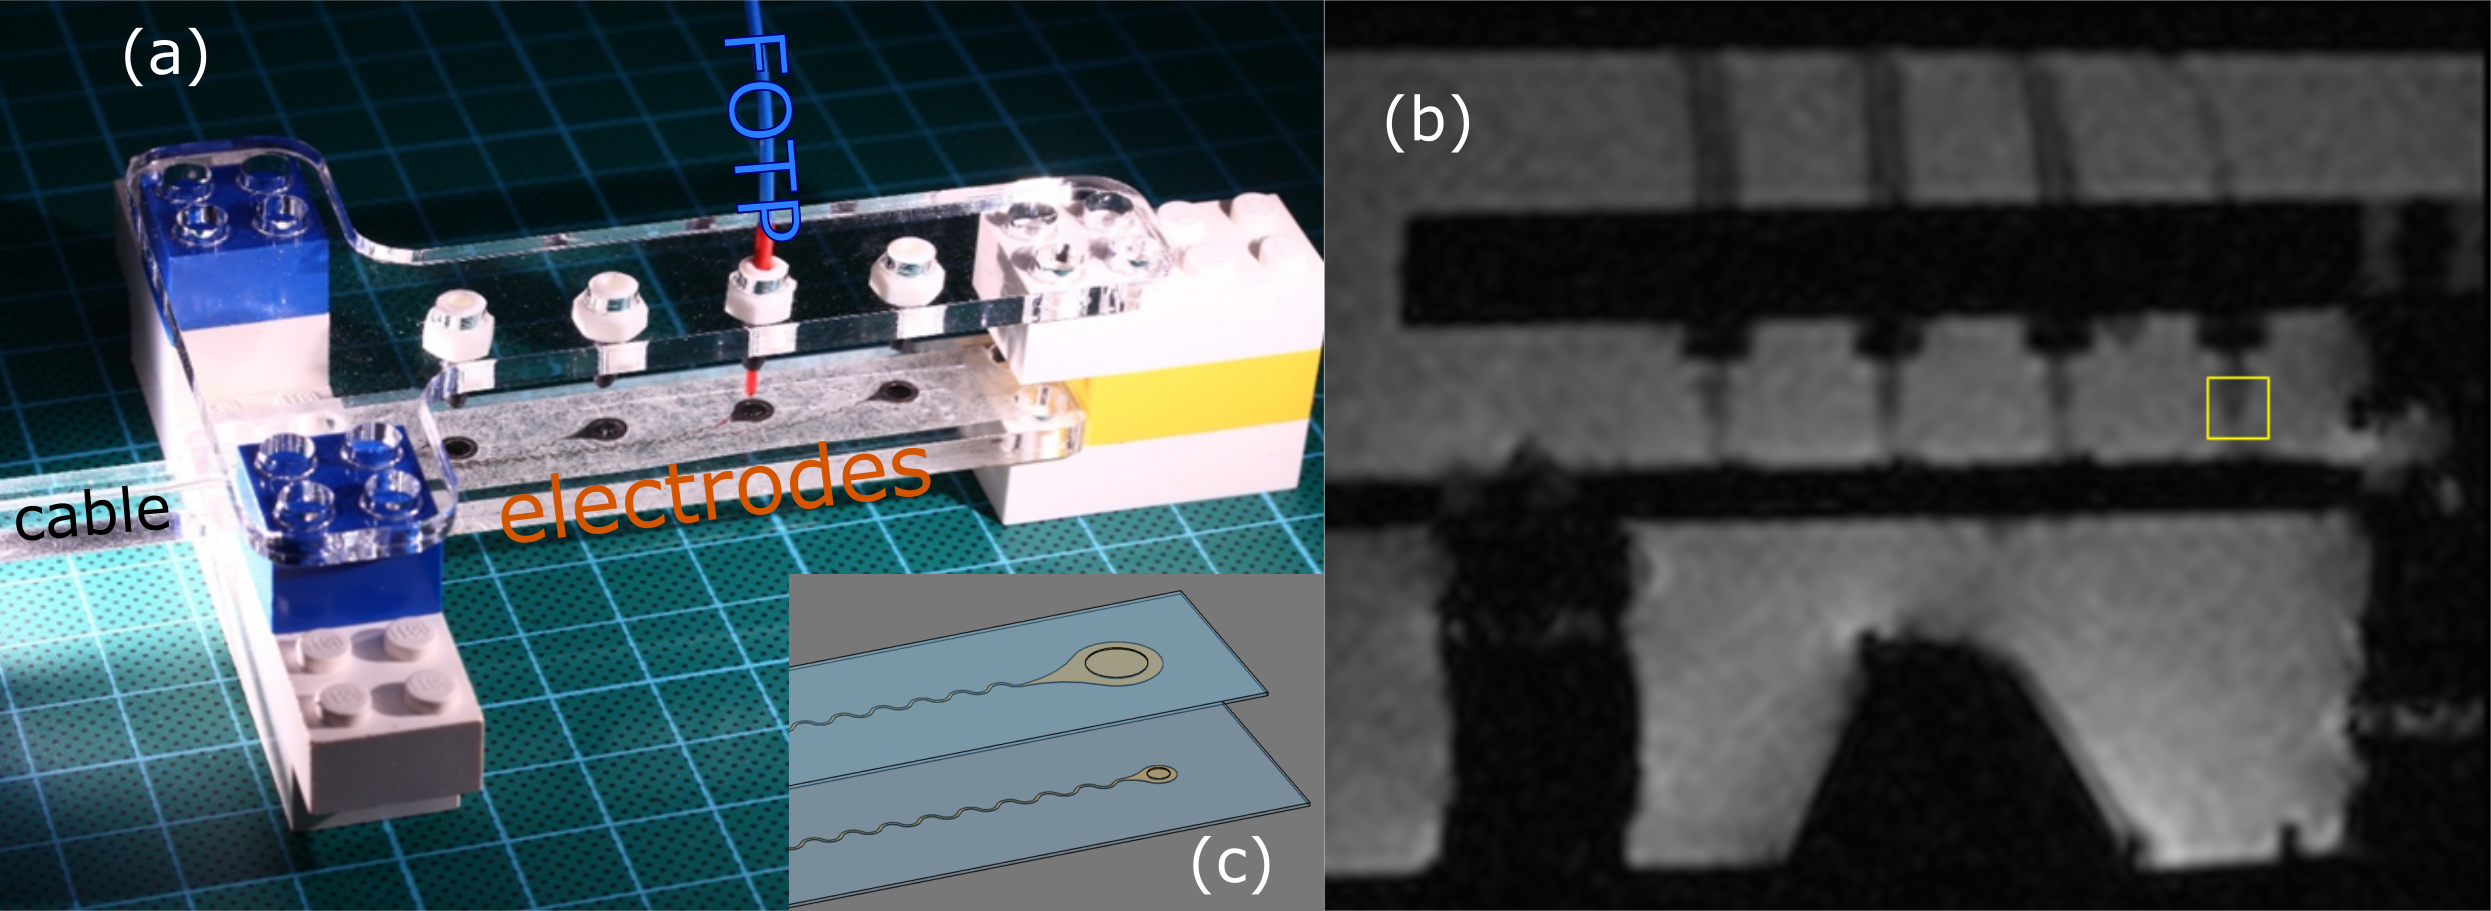
In this study two devices with four individual planar electrodes (Pt/Ir 90/10, 25μm thickness) similar to clinically used electrodes, were investigated. The electrodes were connected to (Pt/Ir 90/10) cables via meandering tracks (Fig.1c) and isolated with silicone except for the electrode contact site which interfaces the tissue. The electrodes were placed on a PMMA sample holder which was integrated in a fixation setup. The diameters of the contact site were 2.7 and 1.0mm. Note, that the electrodes were larger than the contact site.
Temperature measurements were performed in an ASTM phantom2 using fiber-optic temperature probes (FOTEMP9-16 Optocon AG, Dresden, Germany)(Fig.1). The electrodes were placed 11.3cm off center parallel to the magnetic field. Heating was generated using a proton resonance frequency (PRF) thermometry sequence4 with an off-resonant RF pulse for heating5 which was implemented on a 1.5T MAGNETOM Tim Symphony (Siemens Healthineers GmbH, Erlangen, Germany) with the following parameters: TE/TR = 15/30ms, αimaging = 13°, αheating = 620°, 1x1x4mm³ resolution, TA = 4.7s, nominal whole body SAR: 1W/kg. Temperature changes were calculated from phase difference images between 10 baseline images and images acquired during heating.
For comparison, FDTD simulations using Sim4Life (ZMT AG, Zurich, Switzerland) were performed based on CAD models of single electrodes. To assess the influence of the FOTP, the simulation was performed with and without the FOTP in contact with the electrode.
Results
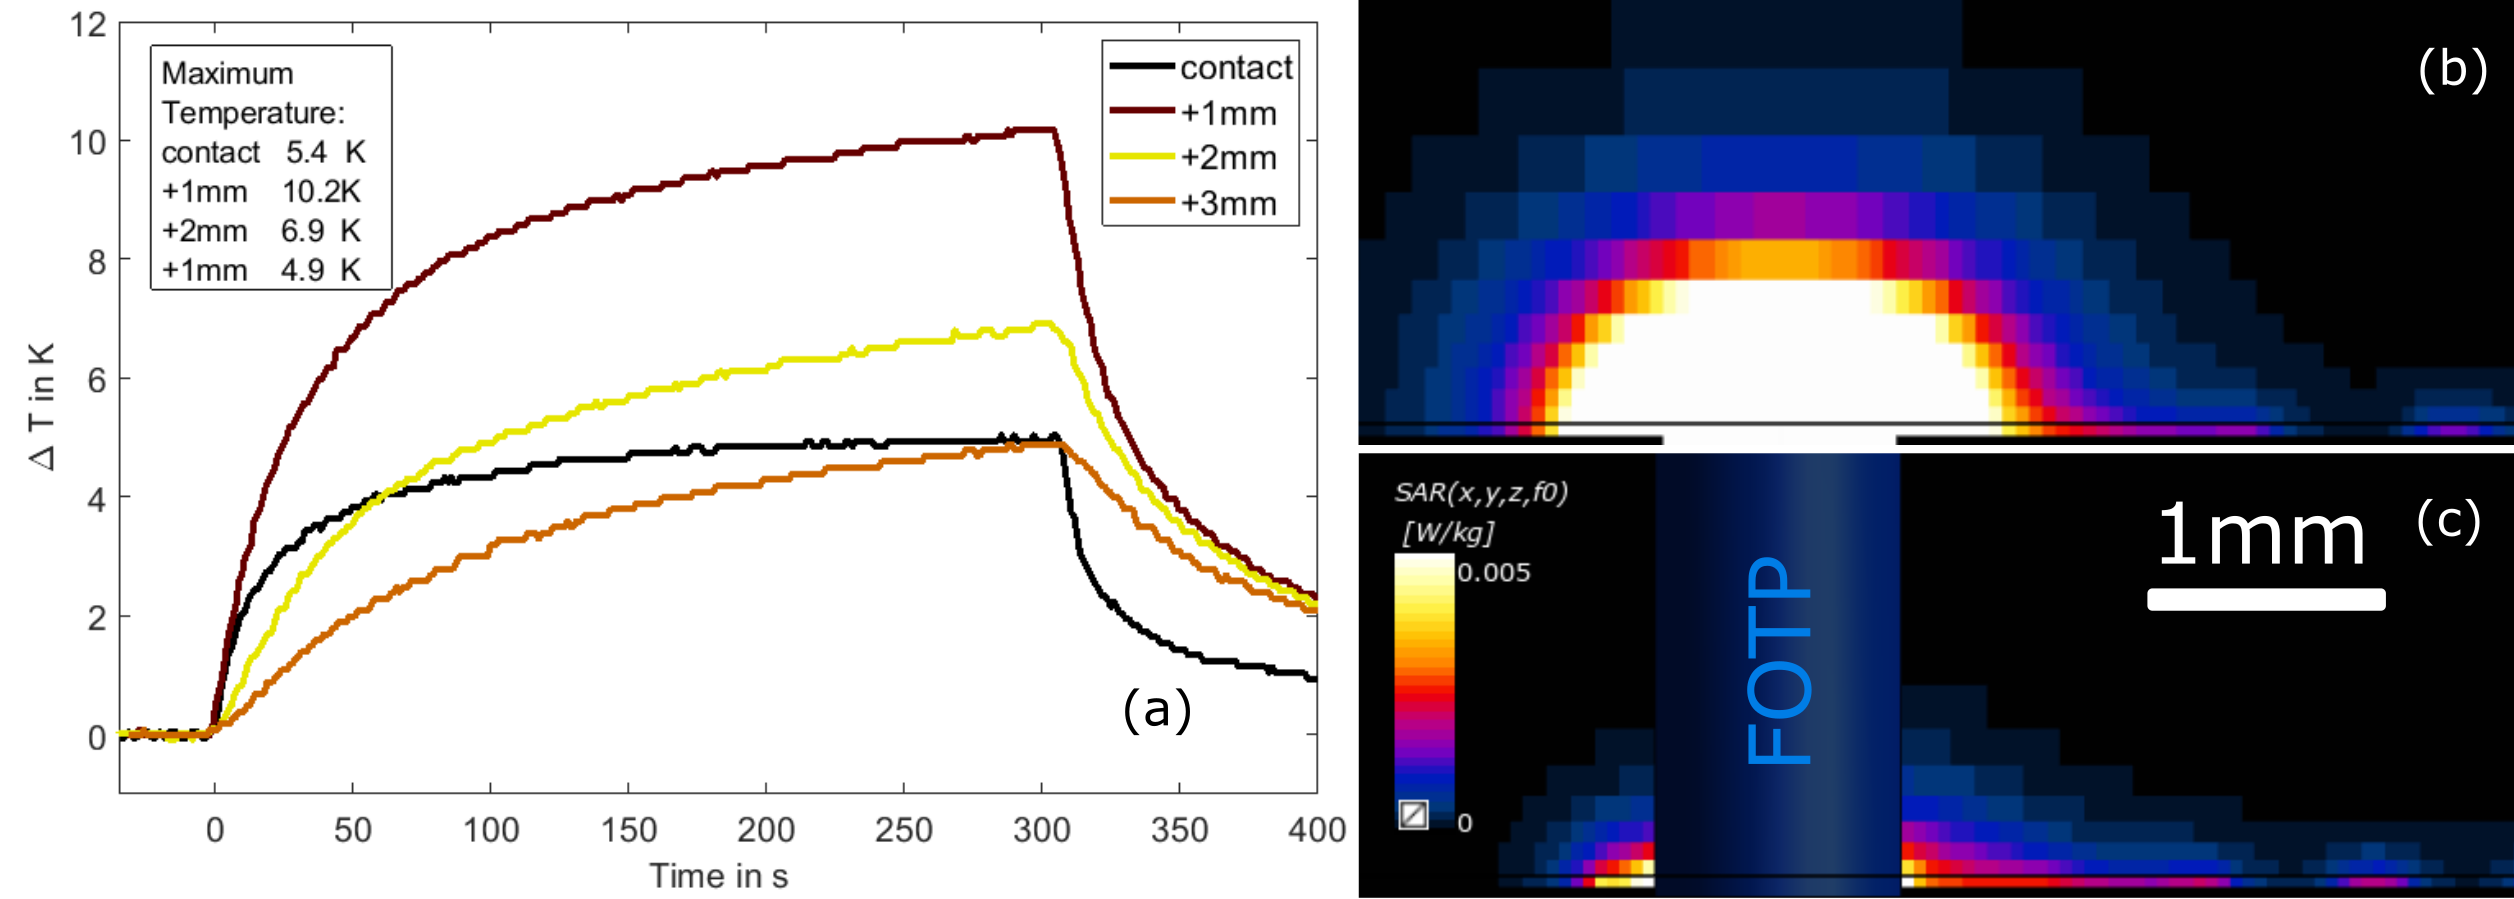
For the 2.7mm electrode, temperature increases of up to 12K were measured with the FOTP, whereas the maximum was 38K in MR thermometry. Fig.2(a) shows the temperature increase for the 1.0mm diameter electrode: the maximal temperature increase of 10.2K was found for a 1mm distance between FOTP and electrode, 3mm distance and contact show comparable results, but are 47% lower than the maximum.
SAR maps calculated from simulated RF fields are shown in Fig.2(b-c). The mean SAR in a volume of 1x1x1.5cm3 close to the electrode is reduced by >90% when the FOTP is introduced. Note, that the FOTP does not generate heating due to its low conductivity.
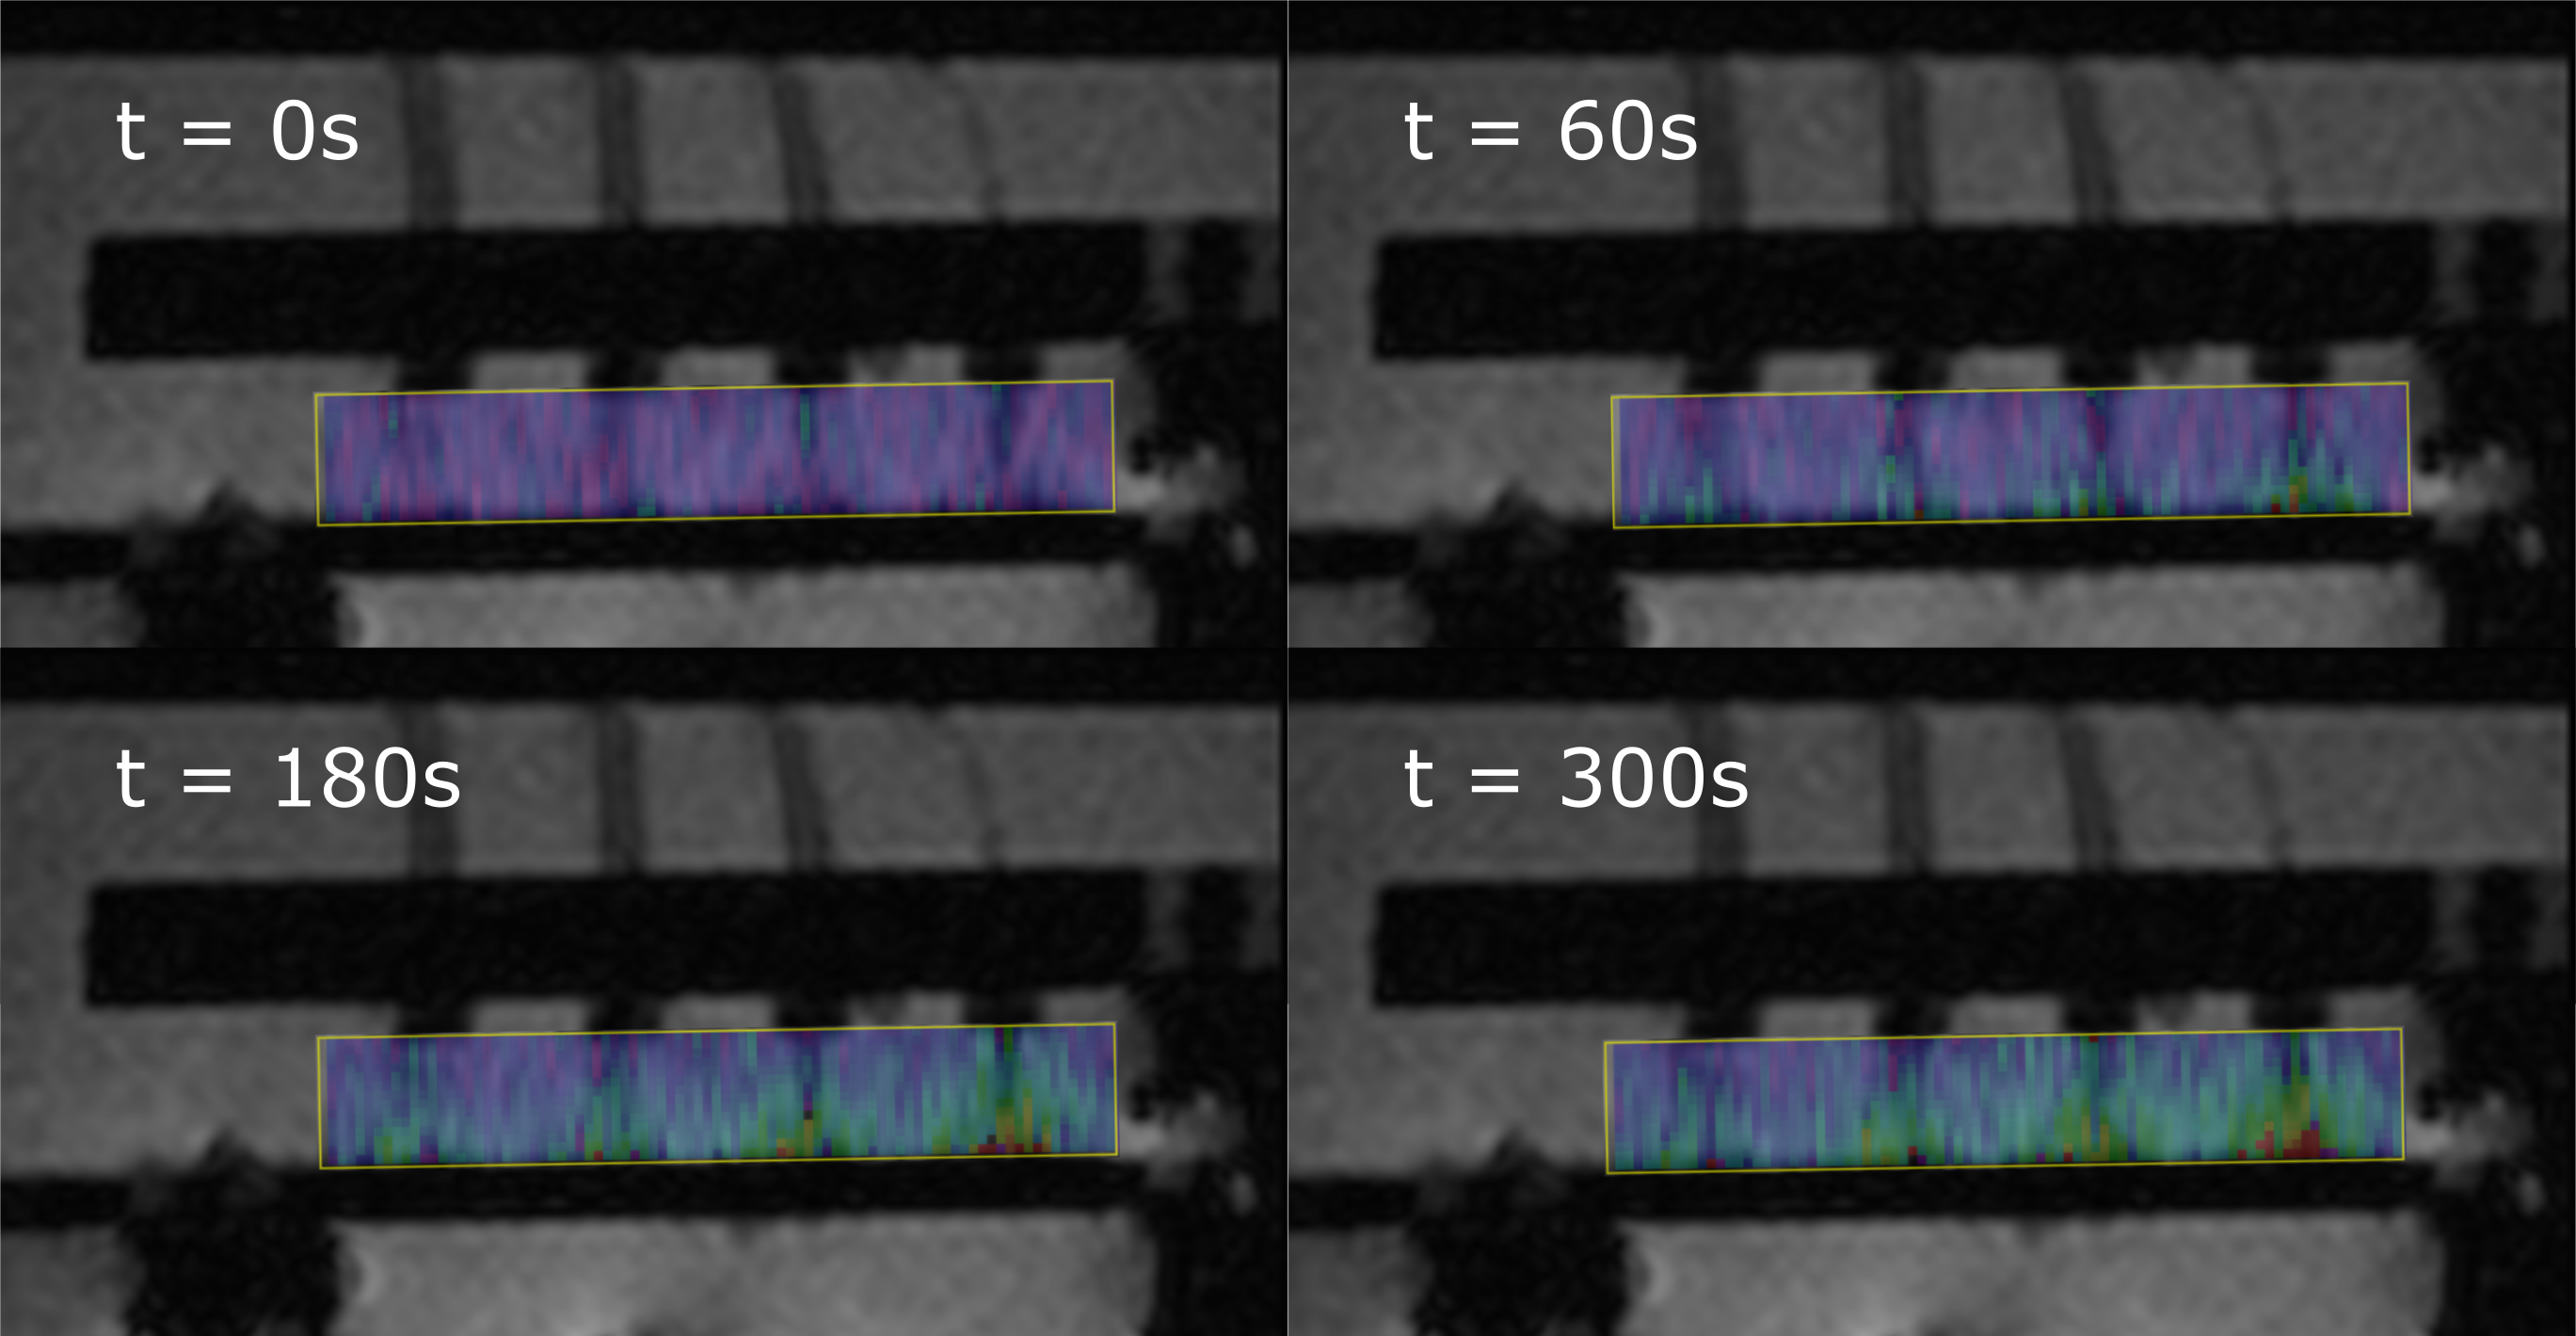
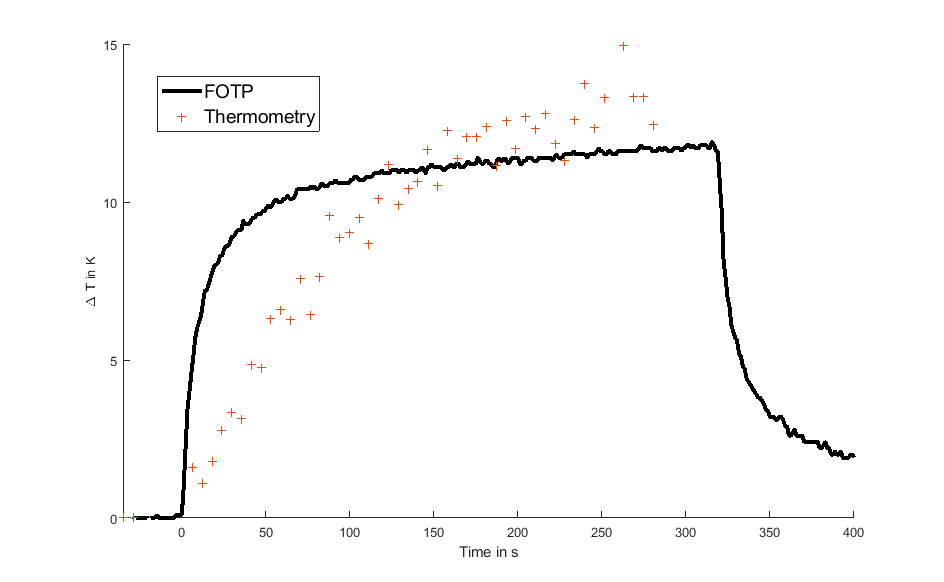
MR thermometry maps are shown in Fig.3, where heat is dissipating from the electrode contact site to the surrounding tissue. Temperatures of FOTP and thermometry shown in Fig.4 produce comparable results if the ROI is placed as shown in Fig.1.
Discussion & Conclusion
Temperature measurements are recommended in the ASTM standard to investigate the RF heating risks of implants. This study demonstrates that systematic errors can occur if the FOTPs are placed in the vicinity of implants and if their sizes are comparable. The displacement of the tissue-mimicking gel inhibits the dissipation of energy and hence reduces heating. While it is desirable to measure as close as possible to implants, this may cause systematic errors in the temperature data, which underestimate the heating hazard and could thus lead to incorrect certification of unsafe implants.
The maximum temperatures measured with MR thermometry are consistent with the FOTP measurements, but give additional insight in the temperature distribution and show higher maximum temperatures in the direct vicinity of the electrode. However, MR thermometry suffers from limitations such as strong dependence of temperature resolution on SNR, which in turn limits the spatial and temporal resolution. Additionally, susceptibility artifacts might cause phase distortions and hence affect the measured temperature.
The presented work shows, that careful choice of the temperature measurement technique is needed when investigating RF heating of small implants such as planar electrodes. Temperature sensors with a significant size compared to the samples influence the RF absorption of energy and can distort the temperature distribution. MR thermometry can provide a non-invasive 2D alternative but requires optimization for temporal and spatial resolution.
Acknowledgements
No acknowledgement found.References
1Erhardt J.B., et al, 2018. Should patients with brain implants undergo MRI? J. Neural Eng. 15, 041002
2ASTM standard F 2182-2011a, 2011. ASTM 2182 Standard test method for measurement of radio frequency induced heating near passive implants during magnetic resonance imaging. ASTM Int. 1–14
3ISO, T.S., 2012. 10974: Assessment of the safety of magnetic resonance imaging for patients with an active implantable medical device. Geneva, Switz. Int. Organ. Stand.
4Ehses P., et al, 2008 MRI Thermometry: Fast Mapping of RF-Induced Heating Along Conductive Wires, MRM, 60:457–461
5Quesson B., et al, 2000. Magnetic resonance temperature imaging for guidance of thermotherapy. JMRI 12, 525–533
Figures