4182
Determination of local SAR through MR Thermometry at 7T1Siemens Healthineers, Erlangen, Germany, 2Athinoula A. Martinos Center for Biomedical Imaging, Massachusetts General Hospital, Charlestown, MA, United States, 3Department of Radiology, Harvard Medical School, Boston, MA, United States
Synopsis
MR thermometry at 7T allows the straight forward acquisition of temperature maps with very high spatio-temporal resolution. This sensitive method at ultra high fields (UHF) allows the acquisition of local SAR distribution in a tissue equivalent gel head phantom. Using a 1mm isotropic resolution, 5s sampling rate and <0.04°C accuracy in temperature we are able to assess the MR safety of RF coils and validate the underlying electromagnetic and thermal simulations.
Introduction
In MR safety, SAR hotspots are usually predicted using electromagnetic and thermal simulations in a human body model [1]-[3]. Determination of SAR may be done either calorimetrically or by measurements of energy per pulse on phantoms. The pulse energy method gives insight on partial body SAR, whereas the calorimetric method is limited to the area where the sensor is placed (point SAR). As SAR is dependent on the tissue geometry (boundary conditions) and electrical properties, a direct measurement of the full 3D spatial patterns of temperature provide a means to validate the predicted SAR pattern, which is impractical for measures based on multiple probes. In this abstract we demonstrate that MR thermometry at 7T allows the straight forward acquisition of high spatio-temporal temperature maps for local SAR determination.Methods
Phantom characterization
For the calorimetric measurements we have used a tissue equivalent head phantom [4] consisting of 10 g/l Polyacrylic acid (PAA), 1,9 g/l NaCl and distilled water. Measurement of conductivity and electrical permittivity (dielectric constant) were done as described in NEMA MS10 [5]. The phantom filler gel was measured at 298 MHz to have er = 57.3 and s = 0.49 S/m. The calorimetric gel phantom composition corresponds to a mixture of brain grey and white matter [4].
Temperature imaging
Taking advantage of the distinctive SAR patterns and better sensitivity of MR Thermometry at ultra-high fields (UHF) [6], temperature imaging was performed at 7T on a MAGNETOM Terra whole body scanner (Siemens Healthineers, Erlangen, Germany) and compared to fiber optic sensor measurements (Optocon TS4/10, resolution 0.1°C) placed within the phantom. Temperature is measured as a phase shift of the proton signal based on calculating the phase difference between a pair of FLASH images [6].
RF heating
A saturation slice placed outside the measured region of interest is used as the main source of RF heating at the MR frequency for protons. The heat contribution of the FLASH acquisition sampling the temperature is minimal.
Post processing
The magnitude and phase-difference DICOM images from the sequence were exported and processed offline in MATLAB. Phase difference data contains the resonance frequency shift of protons which includes a component attributed to magnet drift and the temperature-dependent chemical shift of protons. To compensate for magnet drift, a flask filled with Marcol 82 oil was used as reference, as the chemical shift of oil is not temperature sensitive. Every pixel in the slice can then be processed to obtain the initial temperature slope over time (dT/dt) and thus SAR distribution can be calculated according to SAR = C*dT/dt taking heat capacity C = 4186 J/kg/°C for water for each pixel.
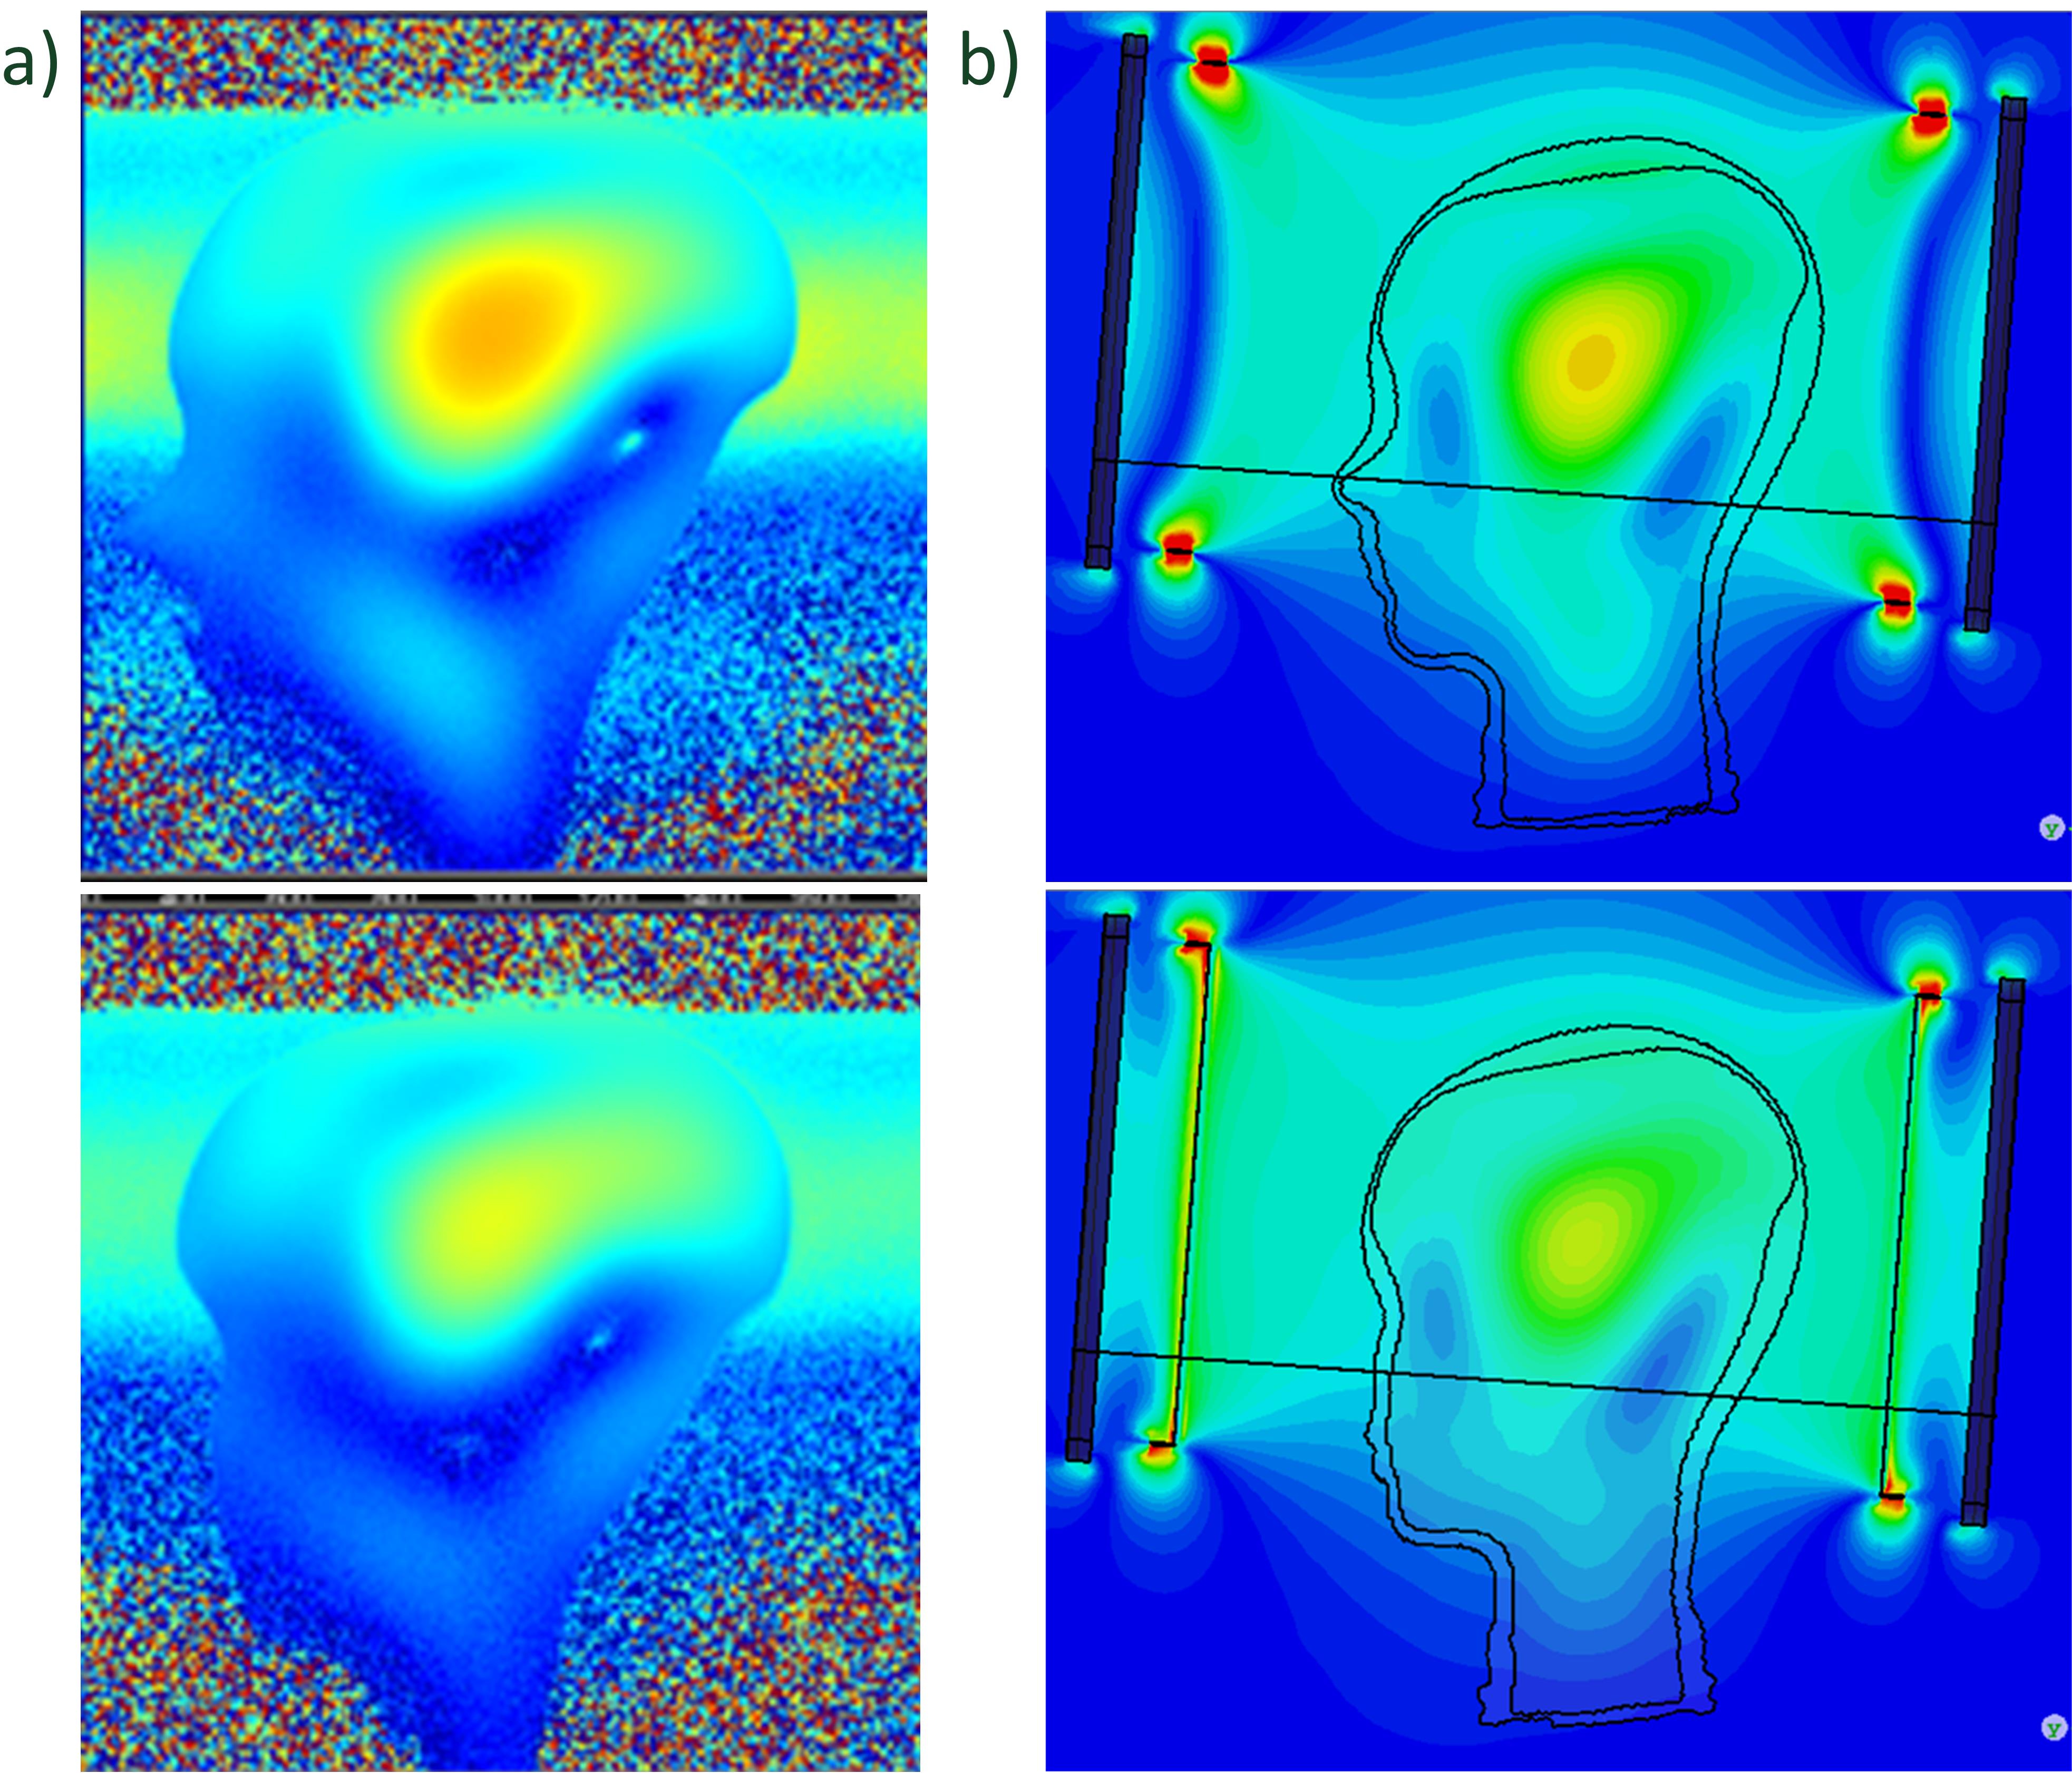
B1+ Maps
B1+ magnitude maps were acquired with the scanner using a turbo FLASH sequence preceded by a magnetization preparation pulse. A qualitative comparison with simulations done in Computer Simulation Technology (CST) for the B1+ field is shown.
RF Coil
The commercial 7T 1Tx32Rx Head Array Coil (Nova Medical Inc., Wilmington, USA) was used with 16W average RF power applied. The sensor position within the head phantom was determined with a high resolution SWI (0.1 mm in plane) image.
Results
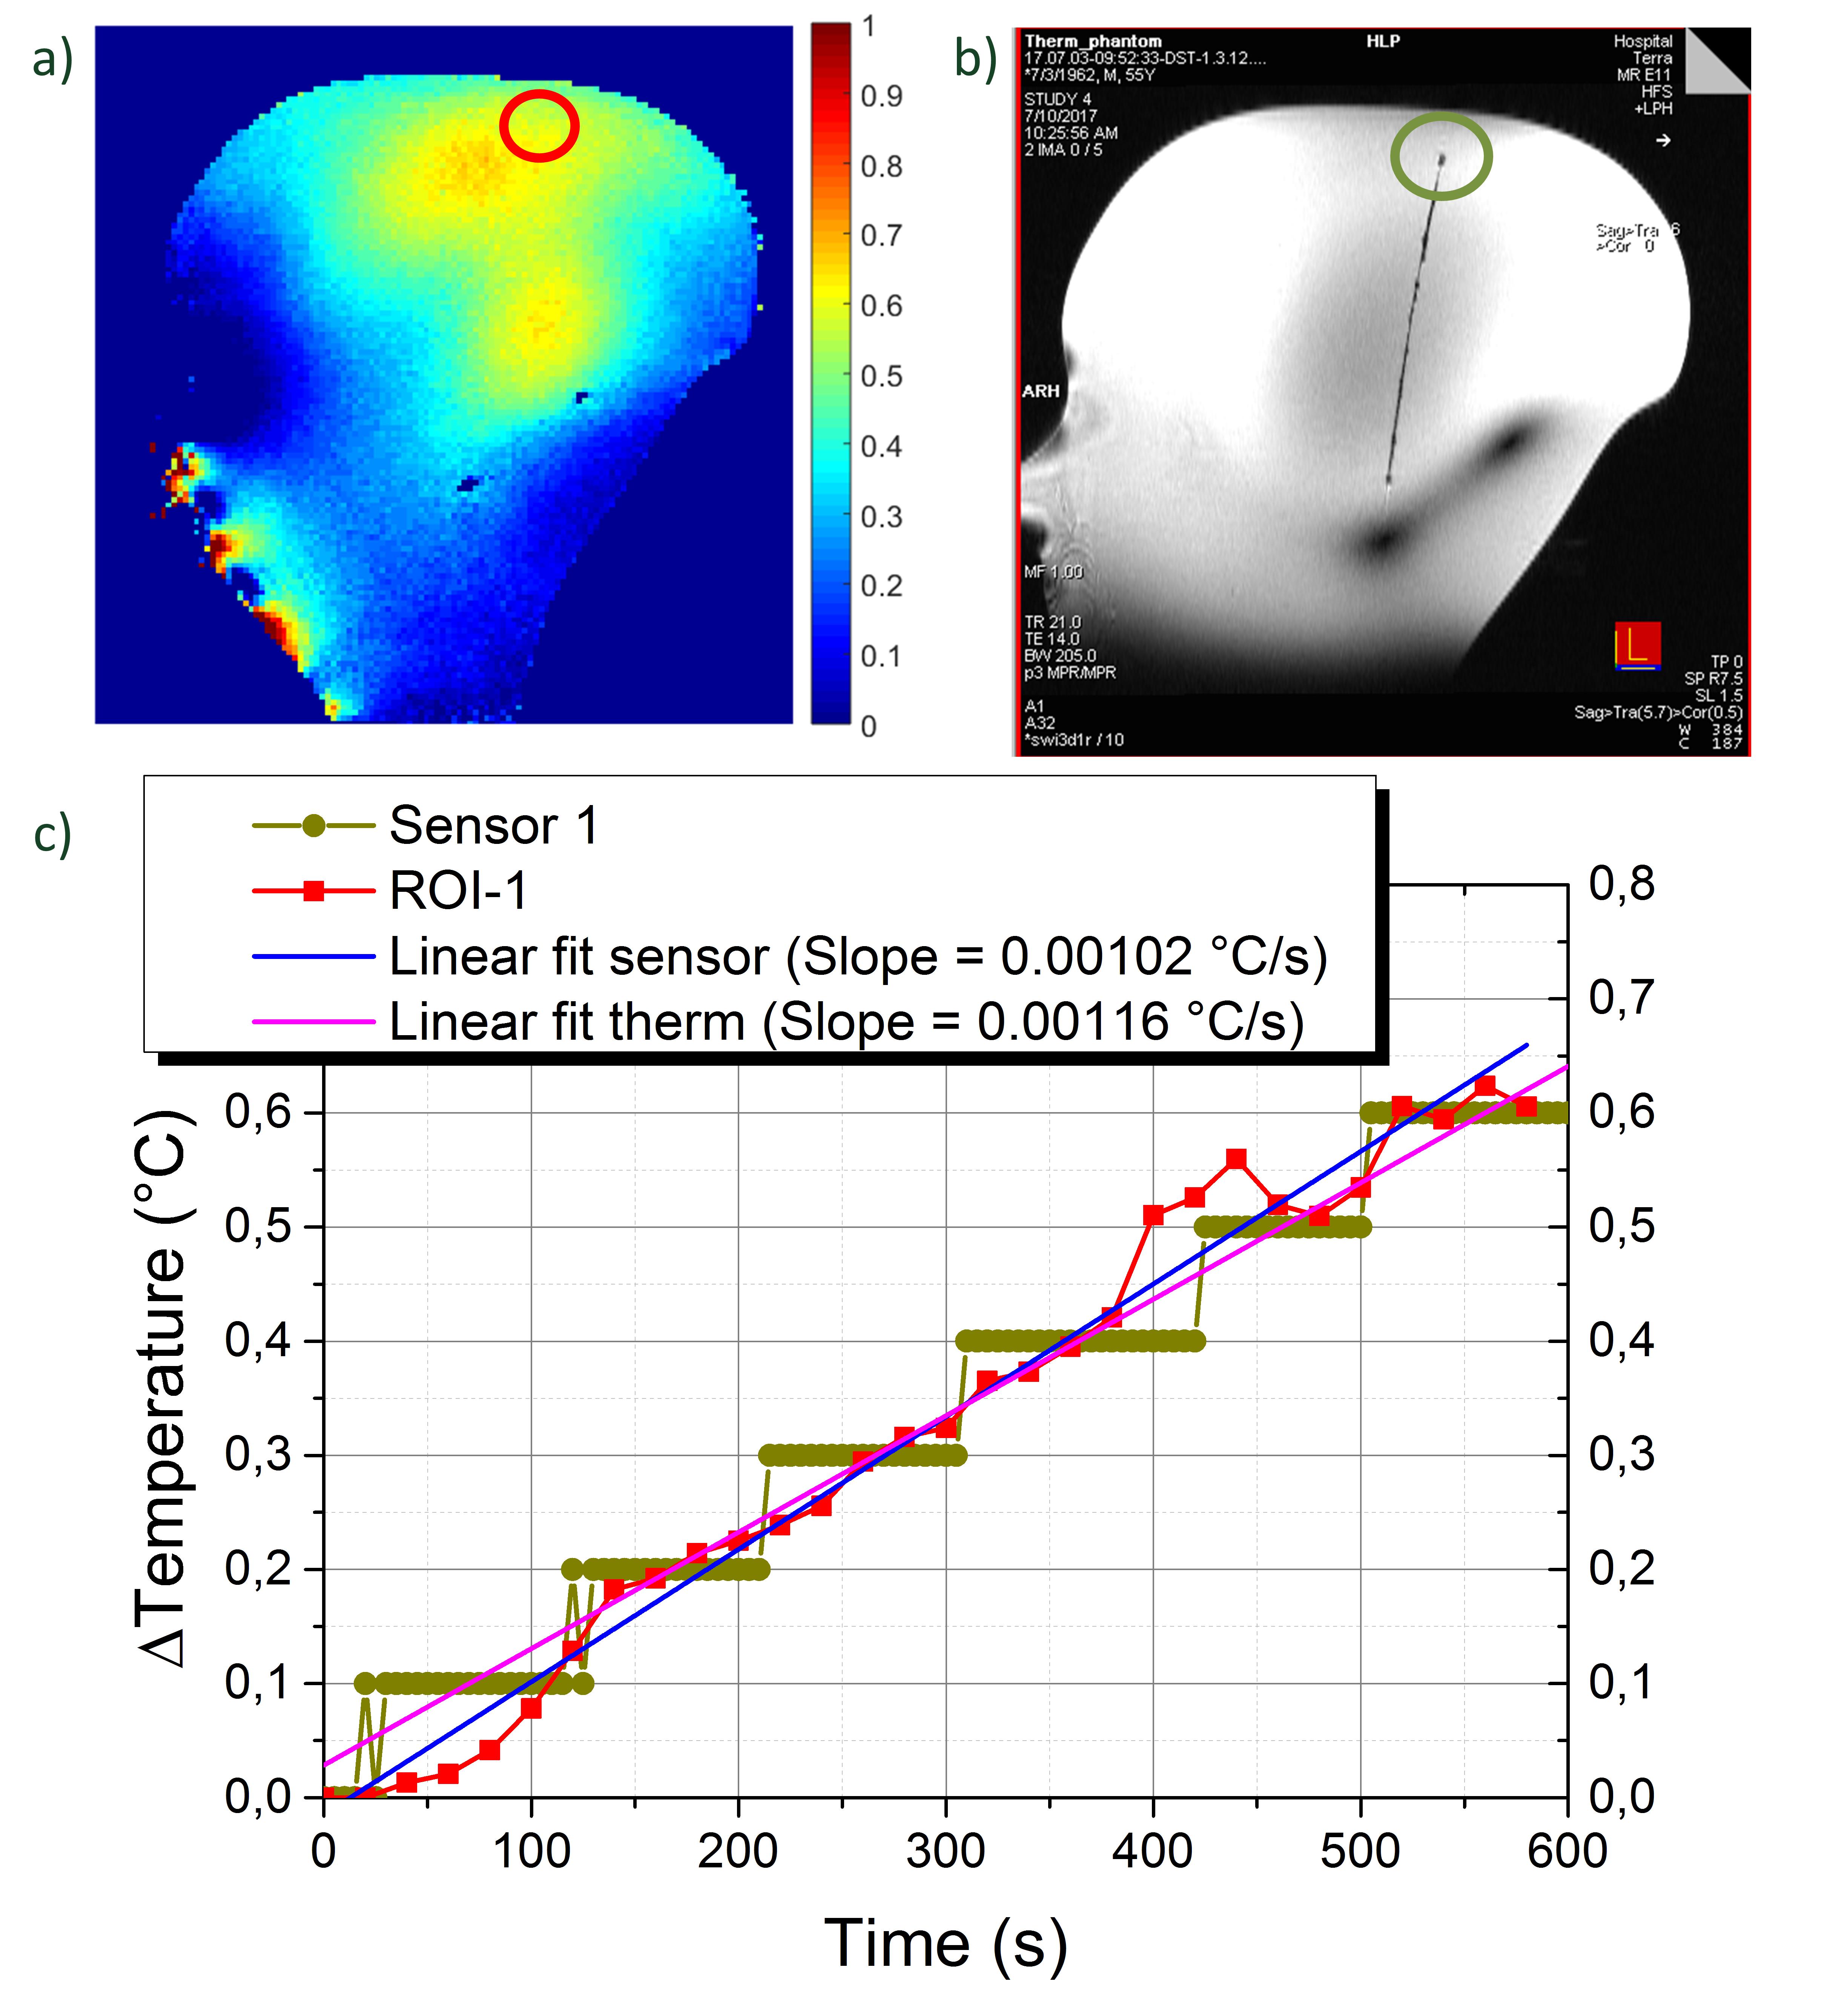
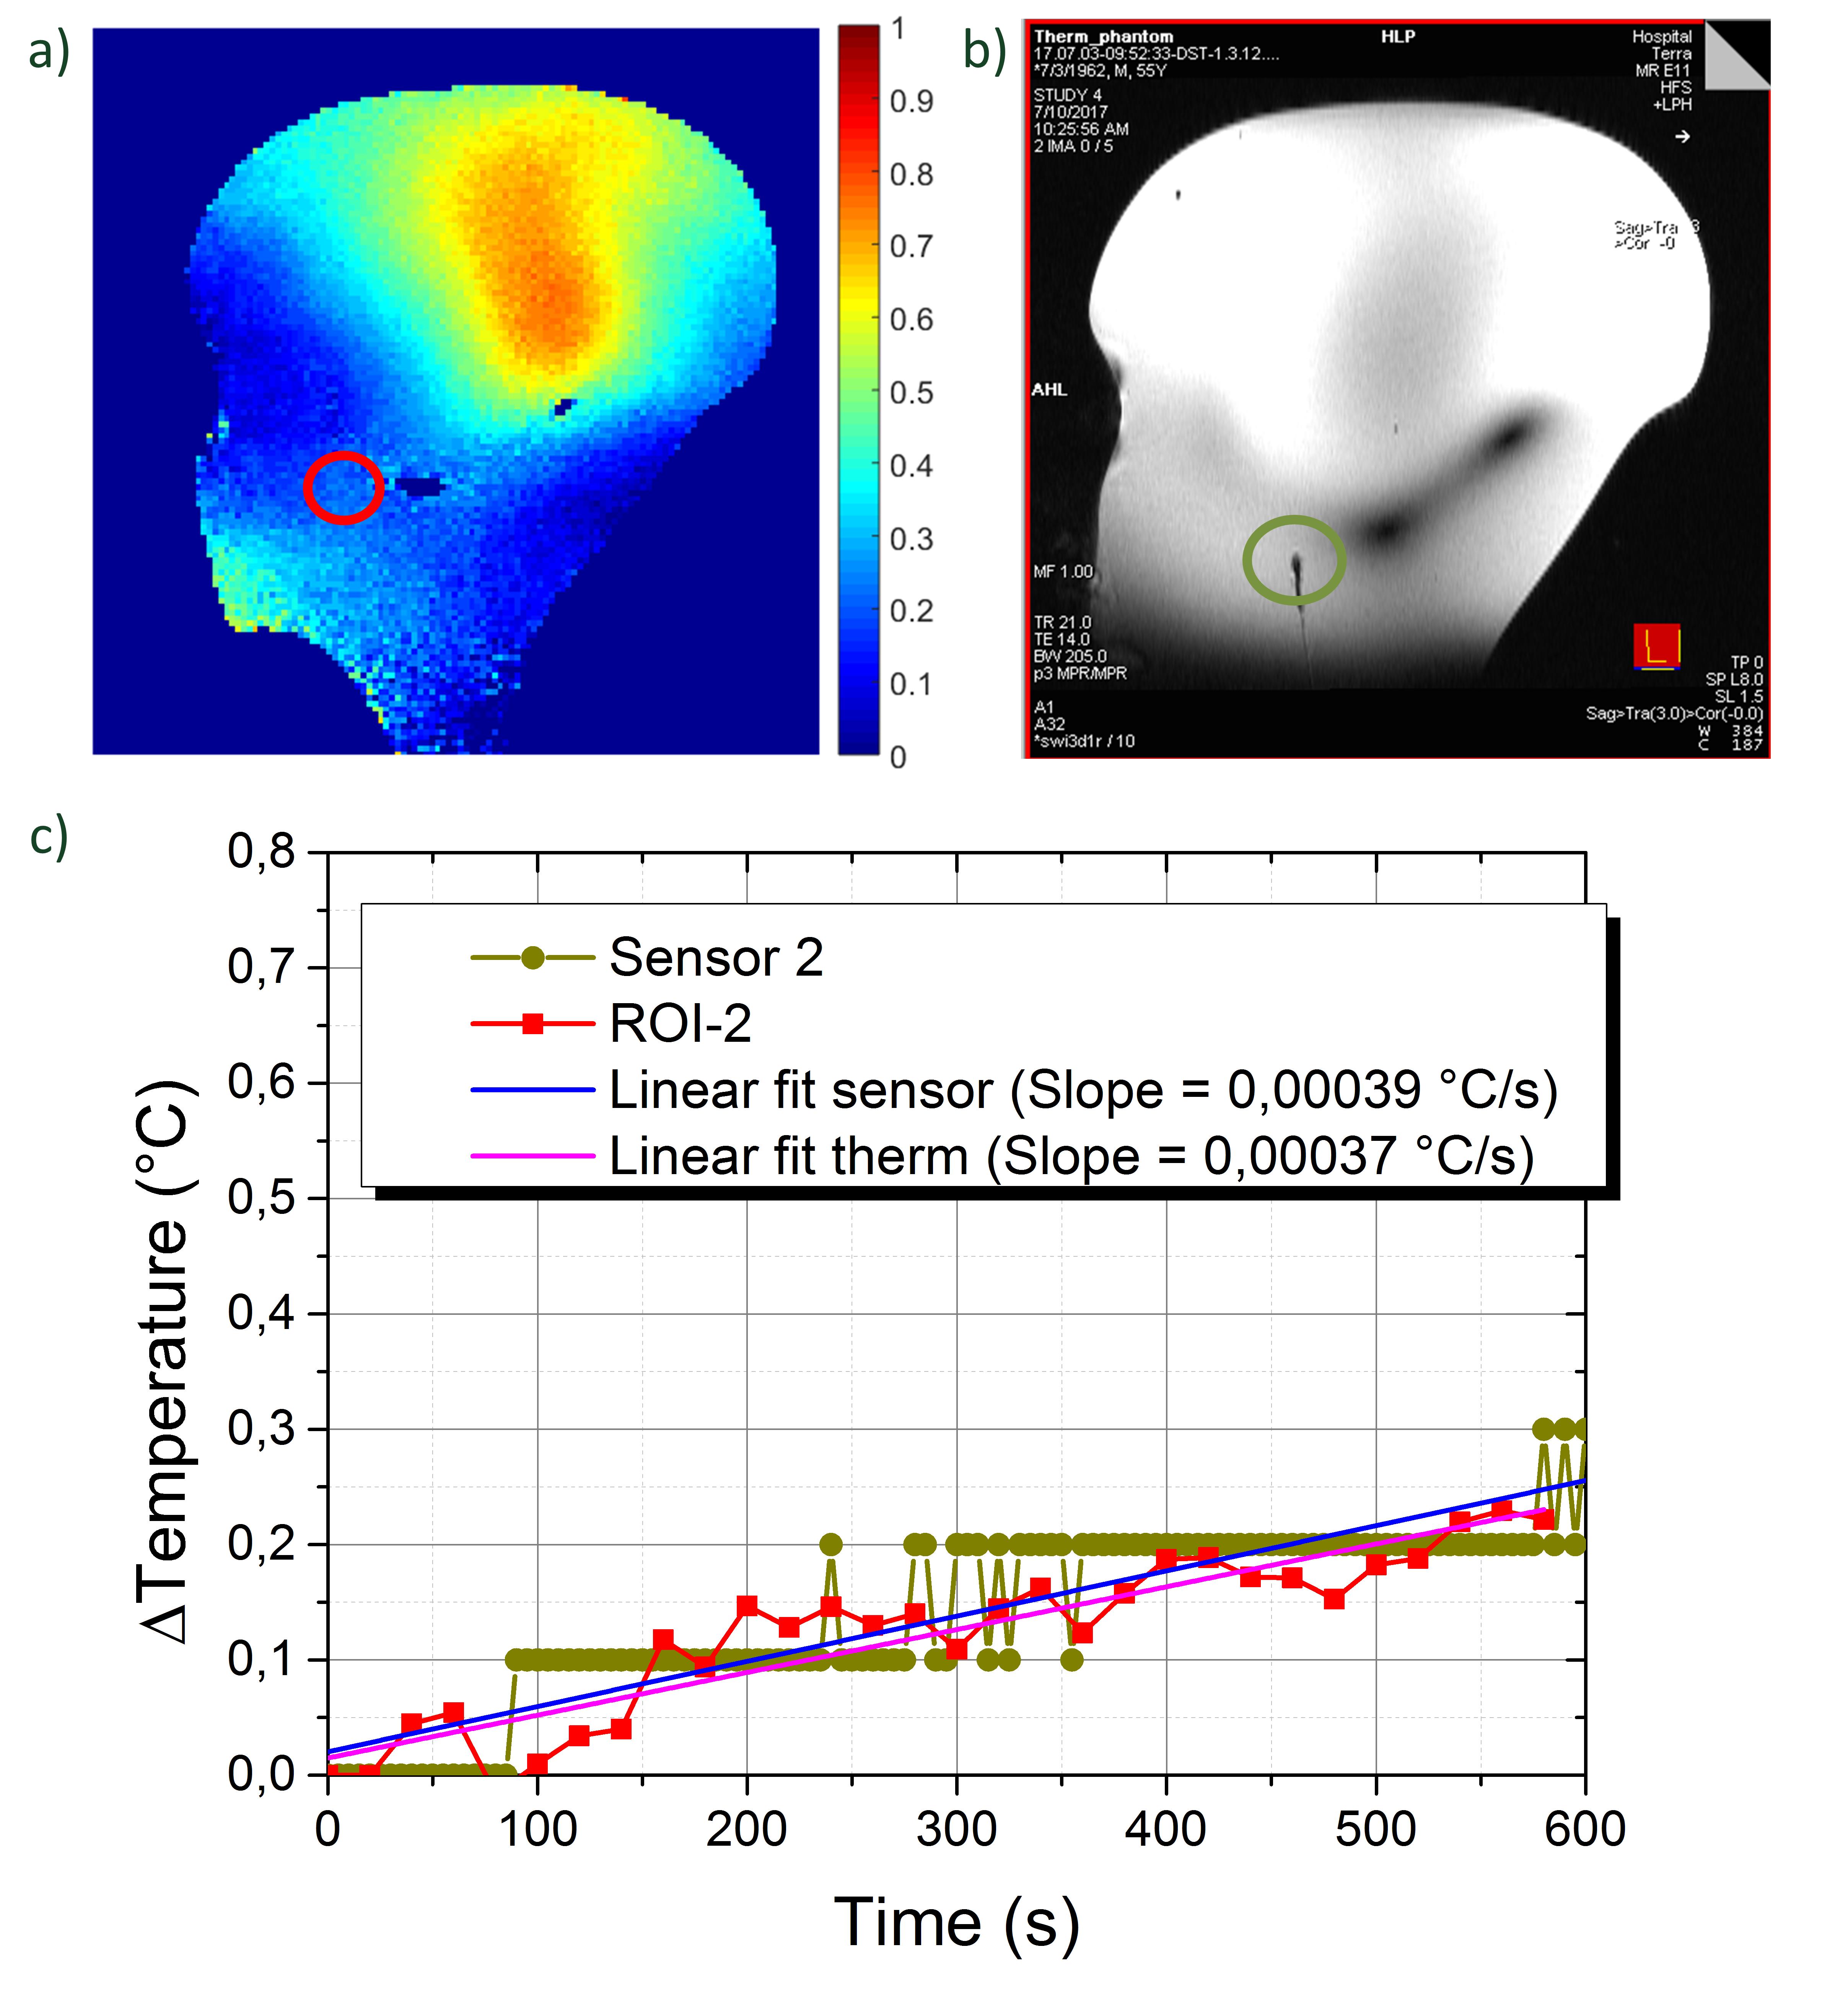
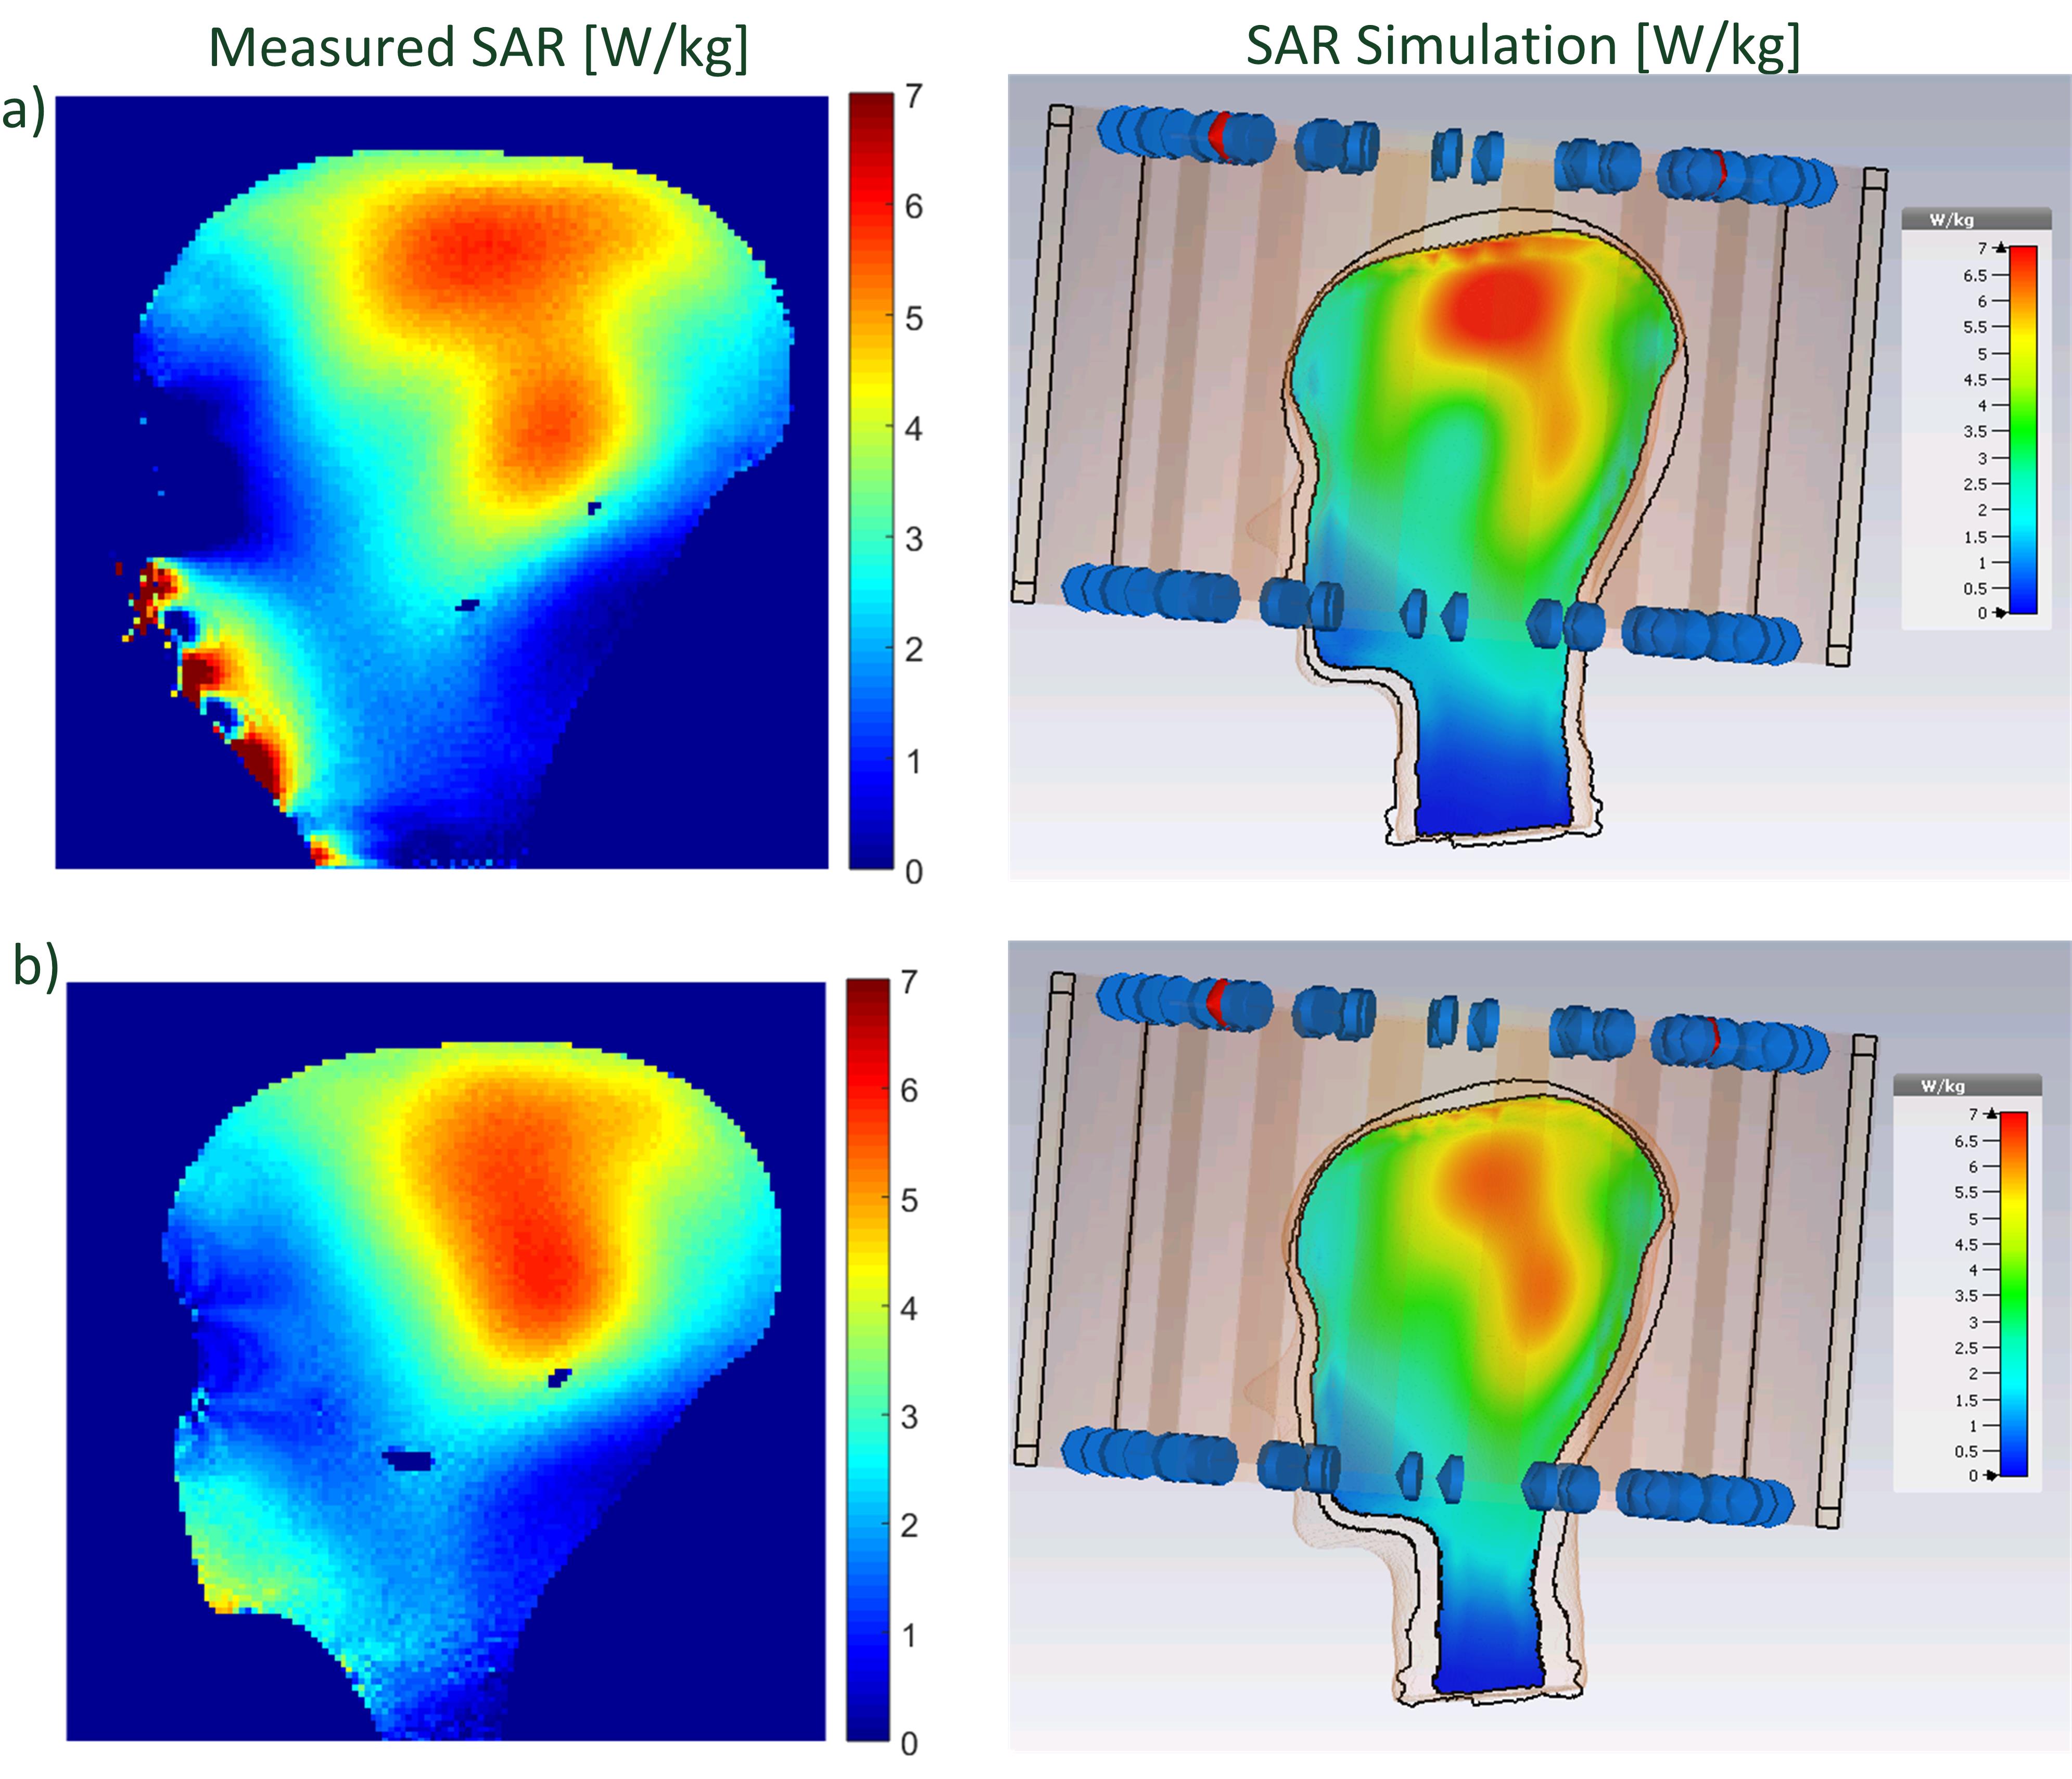
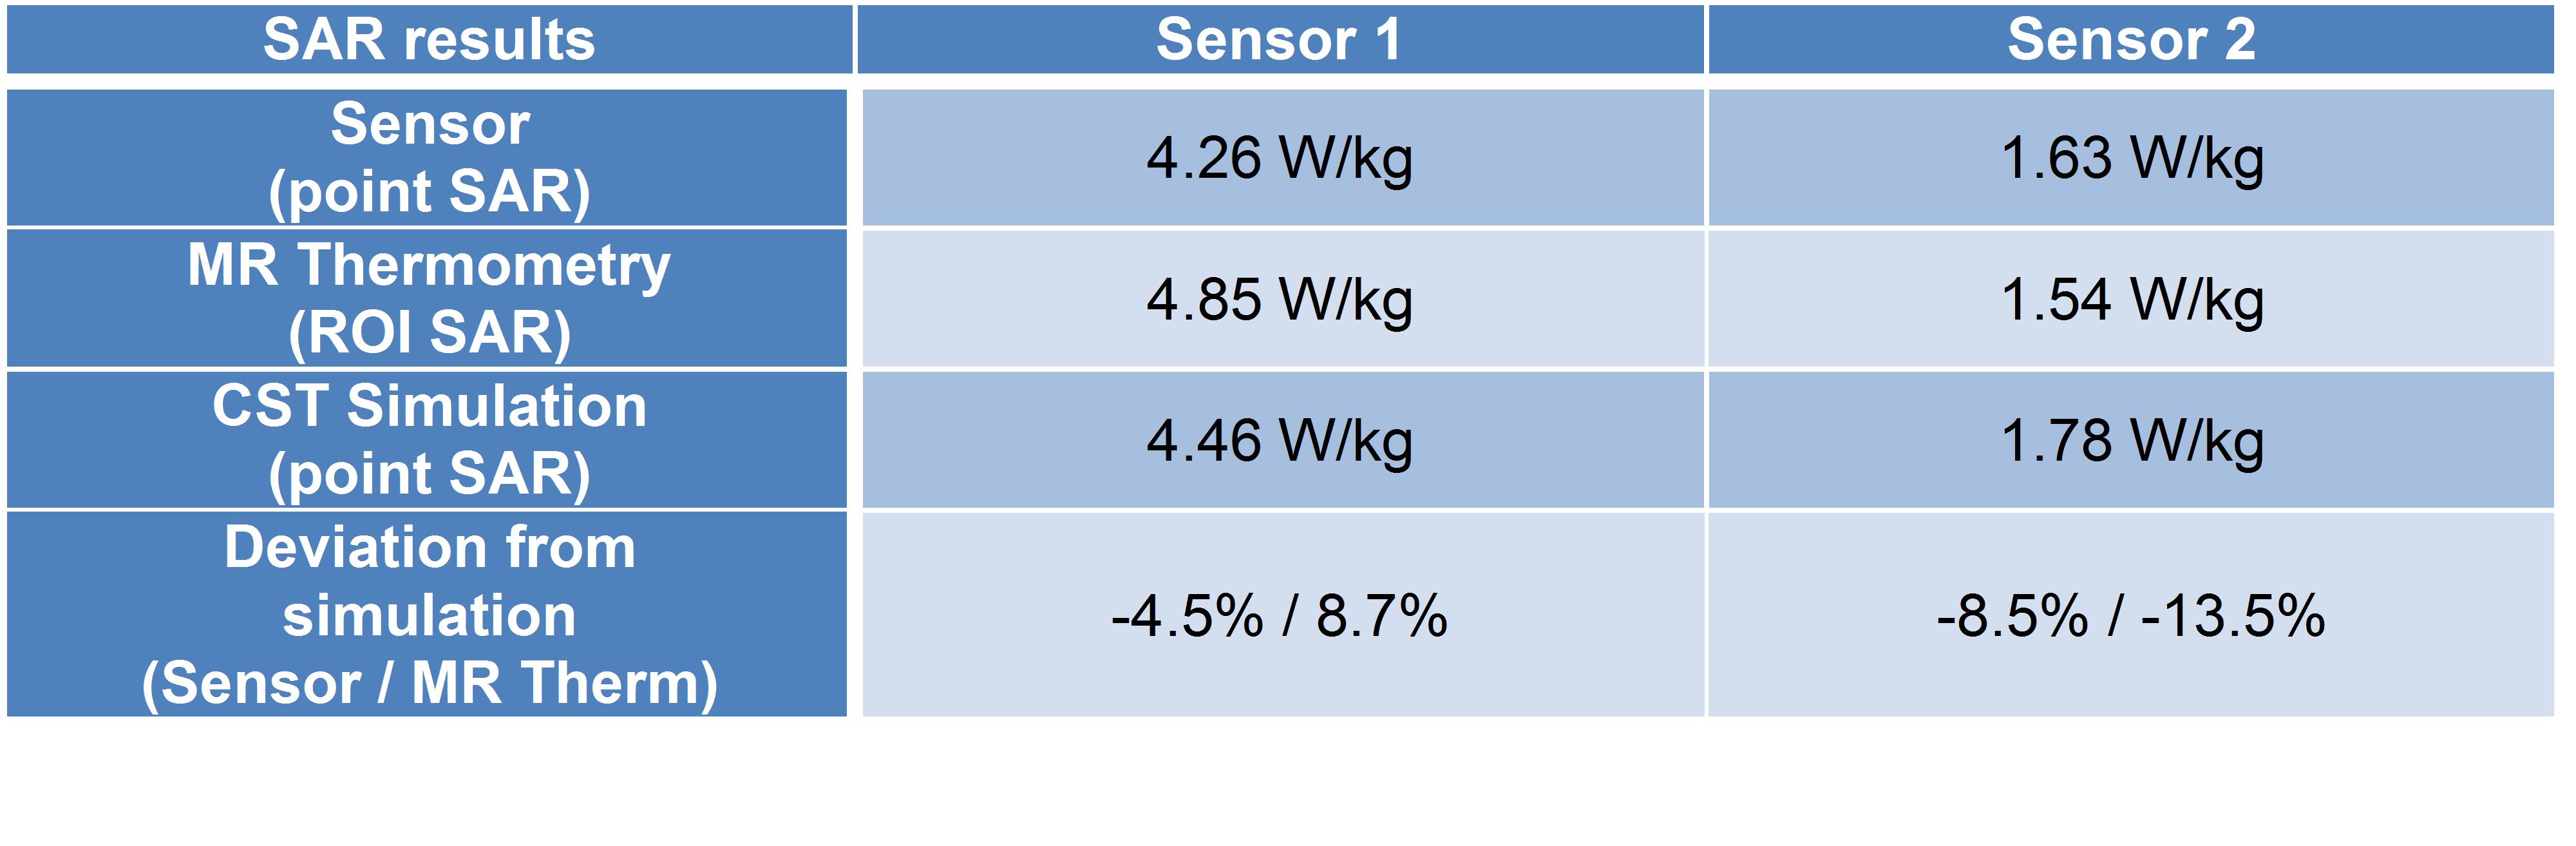
Sensor and MR thermometry data are in good agreement as shown in Figure 1 and Figure 2. With the temperature slope (i.e. temperature increase over time), the local SAR map can be calculated and compared to simulations (see Figure 3). Comparison with local SAR simulation is summarized for two sensor measurements in Figure 4. Moreover, acquired B1+ maps acquired are compared to the simulated maps in Figure 5.Discussion
There is very good agreement of the thermometry measurements with the fiber optic sensor data which suggest this method can be used to spatially locate SAR hot spots within a characterized phantom. In comparison to other methods which used expensive enhancing contrast agents (such as TmDOTMA- with short T1 and T2), this method is straight forward but limited to the MR signal which can be acquired and thus best suited for use with local TxRx coils. B1+ maps on the other hand show similar patterns but a direct quantitative comparison is hindered due to other factors such as the influence of B0 homogeneity for example.
Conclusions
MR Thermometry at 7T (and UHF in general) provides the most sensitive method to date to acquire temperature maps with very high resolution (<0.04°C), fast acquisition (5s sampling rate) and precision (standard deviation < 0.05°C). This allows the calculation of the spatial SAR distribution or other applications such as monitoring RF ablation.
Acknowledgements
No acknowledgement found.References
[1] Murbach M, Cabot E, Neufeld E, Gosselin MC, Christ A, Kuster N (2011) Local SAR enhancements in anatomically correct children and adult models as a function of position within 1.5 T MR body coil. Prog Biophys Mol Biol 3:428–433
[2] Nadobny J, Szimtenings M, Diehl D, Stetter E, Brinker G, Wust P (2007) Evaluation of MR-induced hot spots for different temporal SAR modes using a time-dependent temperature gradient treatment. IEEE Trans Biomed Eng 54:1837–1850
[3] Neufeld E, Gosselin MC, Murbach M, Christ A, Cabot E, Kuster N (2011) Analysis of the local worst-case SAR exposure caused by an MRI multi-transmit body coil in anatomical models of the human body. Phys Med Biol 56:4649–4659
[4] NEMA Standards Publication MS 8-2008 "Characterization of the Specific Absorption Rate for Magnetic Resonance Imaging Systems"
[5] NEMA Standards Publication MS 10-2010 “Determination of Local Specific Absorption Rate (SAR) in Diagnostic Magnetic Resonance Imaging”
[6] Graedel N, Polimeni J, Guerin B, Gagoski B, Wald, L.L (2015) An anatomically realistic temperature phantom for radiofrequency heating measurements. Magnetic Resonance in Medicine 73:442–450
Figures