4176
Safety of active catheters in MRI: Termination impedance versus RF‐induced heating1Department of Radiology, Medical Physics, Medical Center ‐ University of Freiburg, Faculty of Medicine, University of Freiburg, Freiburg, Germany, 2German Cancer Consortium Partner Site Freiburg, German Cancer Research Center (DKFZ), Heidelberg, Germany
Synopsis
To assess the MR safety of an active catheter, the interaction of an arbitrary E-field with an isolated transmission line was modeled analytically in cascaded lossy media. The catheter tip SAR was calculated for different E field configurations and termination impedances that were controlled by an input impedance unit integrated into the receiver interface circuit. Results of the analytical calculations were compared to transfer function (TF) measurements, and found to be in good agreement. By adjusting the input impedance, SAR at the tip of an active catheter could be reduced by 95%.
Introduction
Transfer functions (TF) are used as an efficient method to calculate radio frequency (RF)-induced heating of implants such as pacemaker leads (1,2). Alternatively, analytical modeling can be used as it offers insights into parameter dependencies that affect the MR safety characteristics. Thus, analytical modeling can guide the design of implants or devices to improve MR safety. In active catheters, so far, MR safety studies have been limited to experimental setups (3–8), and analytical modeling has only been applied to single conductor wires terminated by an electrode (9–12). To model active catheters, multi-conductor transmission line models must be created, and input and tip impedances need to be integrated into the model. In this study, we developed an analytical TF model of an active catheter. With this model we show for the first time that the input impedance, Zin, to the micro-coaxial cable of an active catheter strongly effects the specific absorption rate at the catheter tip (SARtip), and that this behavior is consistent with TF measurements.Methods
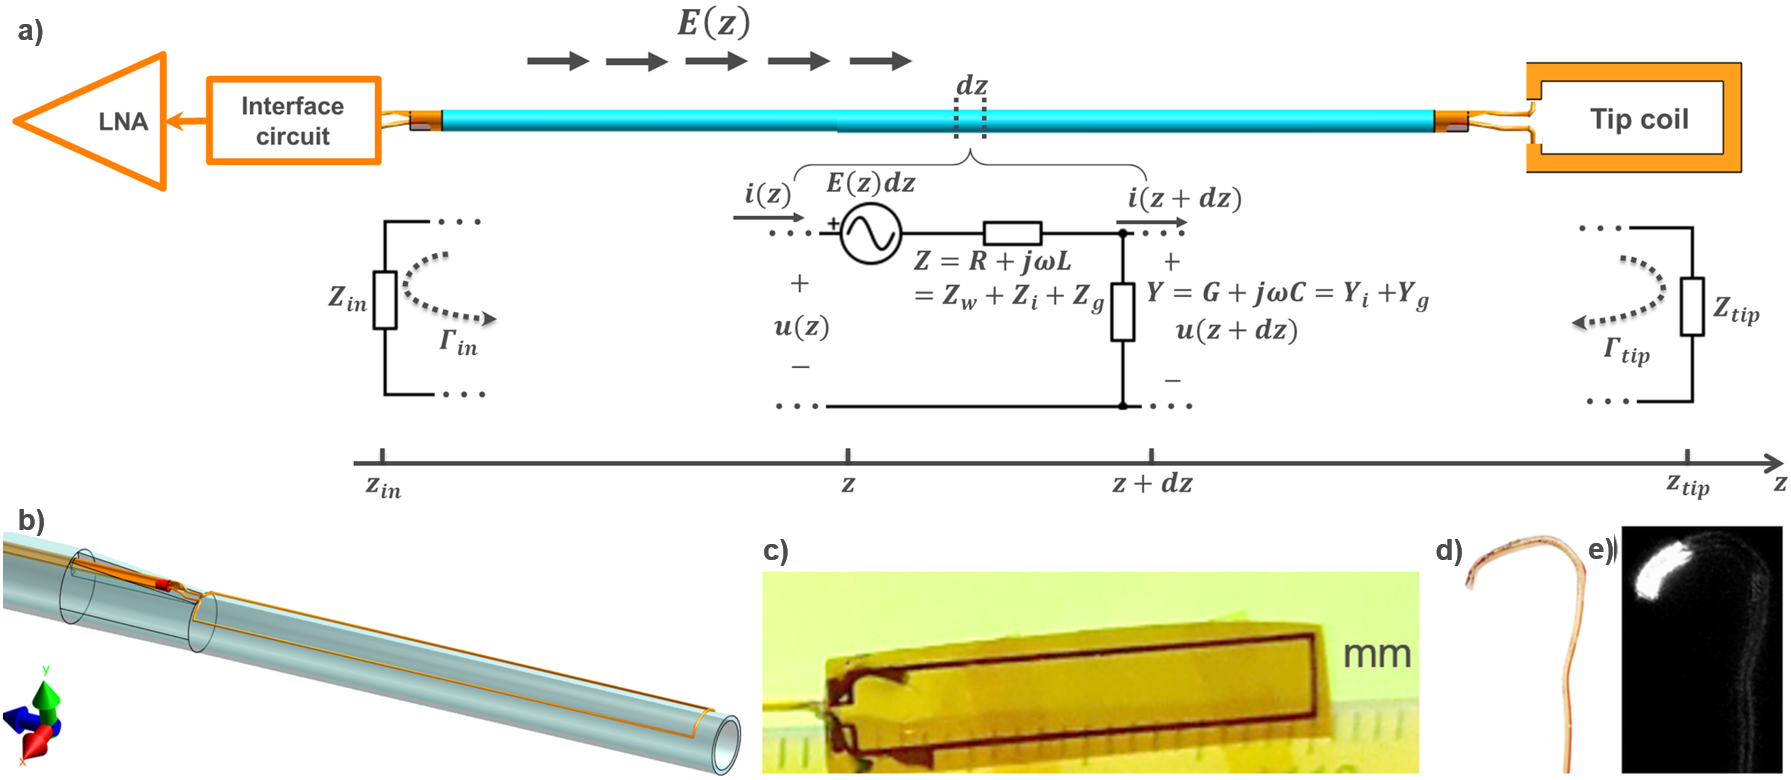
For analytical modeling a multi-conductor transmission line model (Fig.1a) was used where the impedance is the sum of the wire impedance, the insulation impedance and the characteristic tissue impedance (13). An analytical model to calculate the TF from the distributed impedance and the incident E field was implemented in Matlab R2017a (The MathWorks, Inc. Natick, MA). For the calculations, a cascaded wire model consisting of an RG174-cable and a 110cm-long catheter (i.e., micro-coax) completely immersed in lossy medium was assumed. Four incident field configurations E(z) were considered in the subsequent SAR calculations using the TF: a uniform ($$$E(z)=E_{0}=$$$1V/m), a linear phase ($$$E_{lpha}(z)=E_{0}e^{i\pi z/2}$$$), a linear amplitude ($$$E_{lamp}(z)=E_{0}z/l$$$), and a uniform E field with the worst-case phase distribution ($$$E_{worst}$$$).
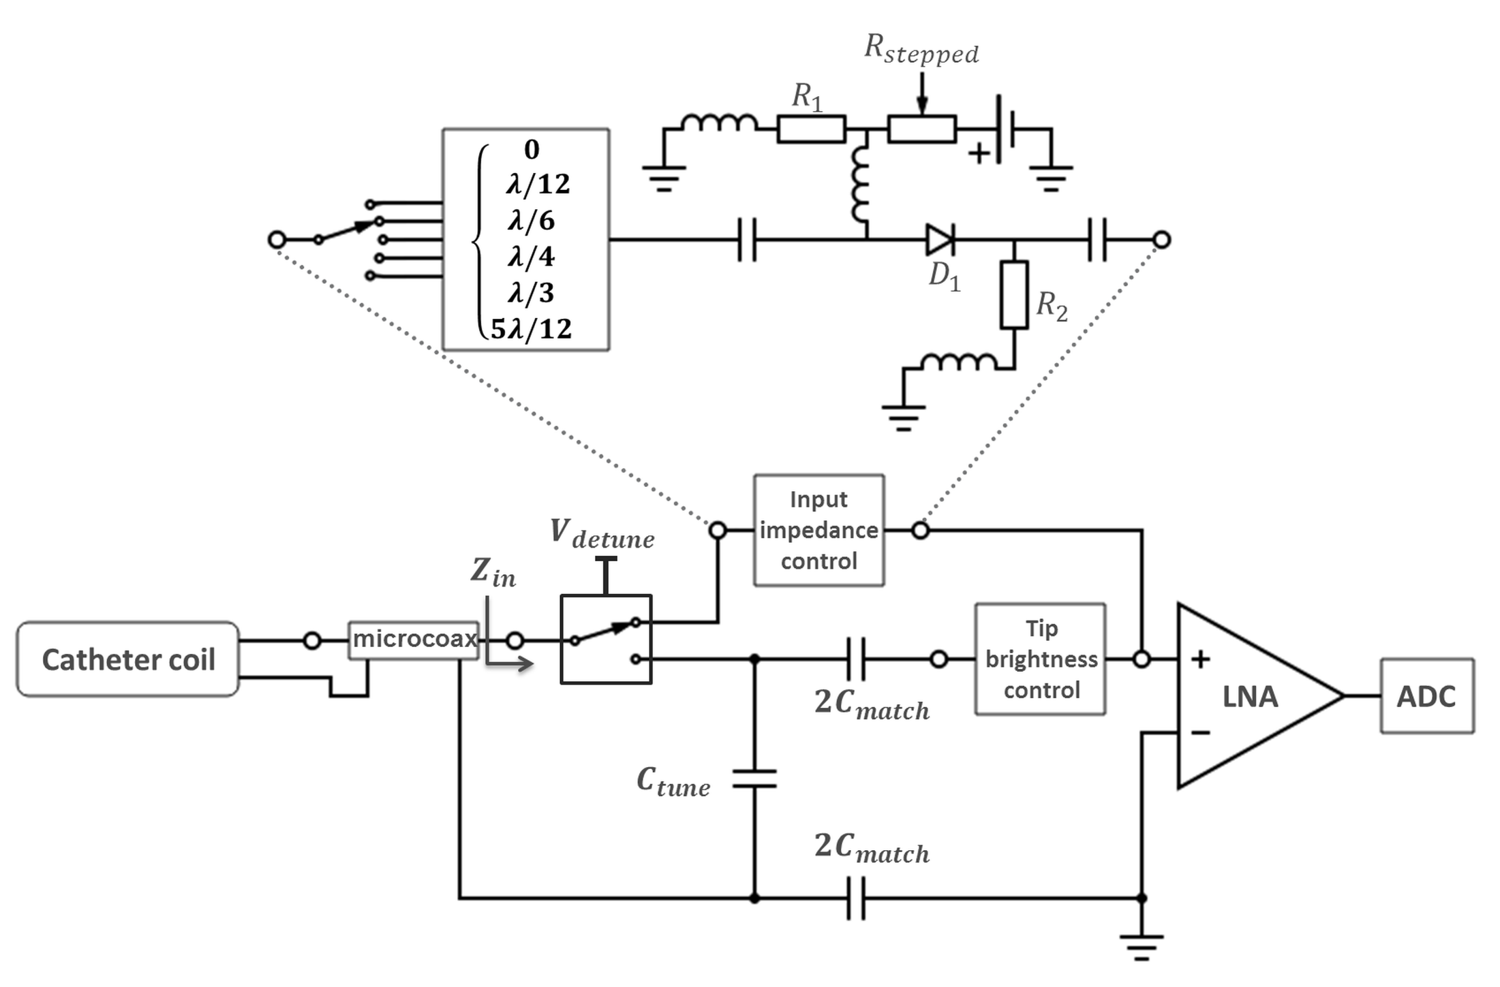
To test the analytical model, an active catheter was constructed for a 3 Tesla MRI system (resonance frequency: 128MHz). The catheter had a saddle coil at the tip (1.6x1.8mm2) made of 35μm copper etched on flexible PCB substrate (thickness: 50μm). To control Zin, an interface circuit was designed with variable Z-values (Fig.2). As a reference, TF measurements were performed at 128 MHz using a commercial setup (piX, ZMT Zurich Med Tech AG, Zurich, Switzerland) (14–17). The measurements were repeated for the 22 different Zin values of the interface circuit to cover the whole Smith chart. SARtip values for the various incident fields were plotted on the Smith chart. To demonstrate the strength of analytical modeling, also partially immersed variations of the 110 cm portion of the catheter were analyzed with an air/lossy-medium ratio of 10/100, 30/80, 55/55, 90/20.
Results
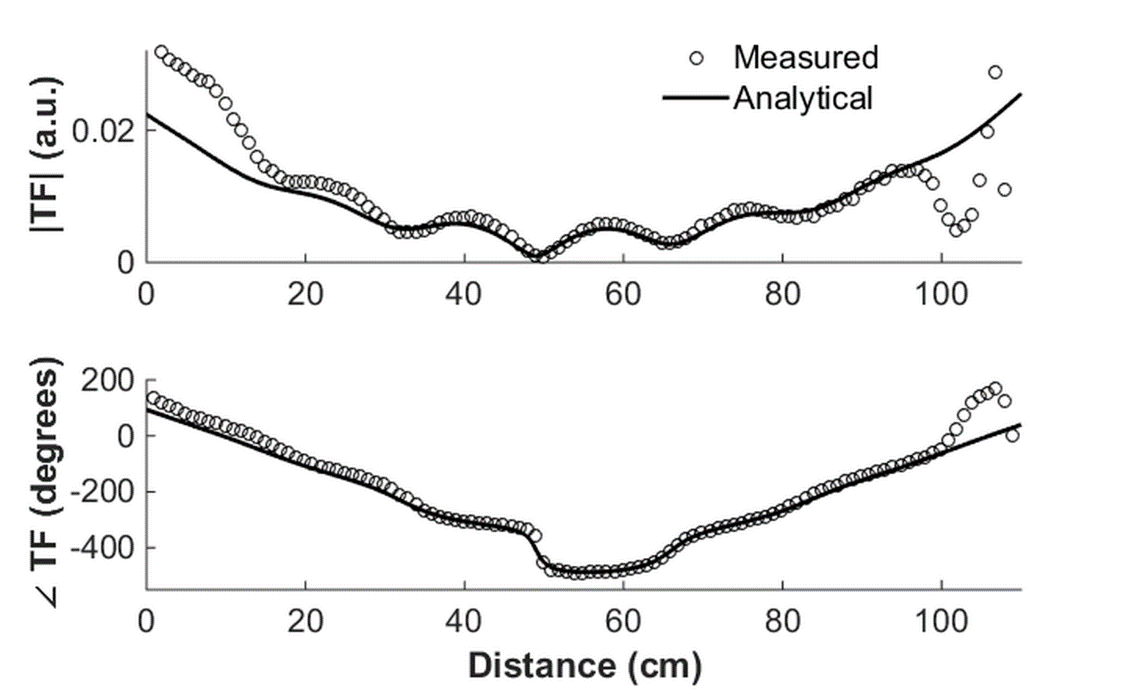
In Figure 3, the TFs from analytical model and piX setup measurements are compared for 50Ω input impedance. The amplitude of the TFs decreases from the tip position (z=0) until a minimum is reached at 50cm, after which it gradually increases again. Both analytic and measured TF additionally show oscillations with a wavelength of 17cm, which is consistent with the standing wave behavior.
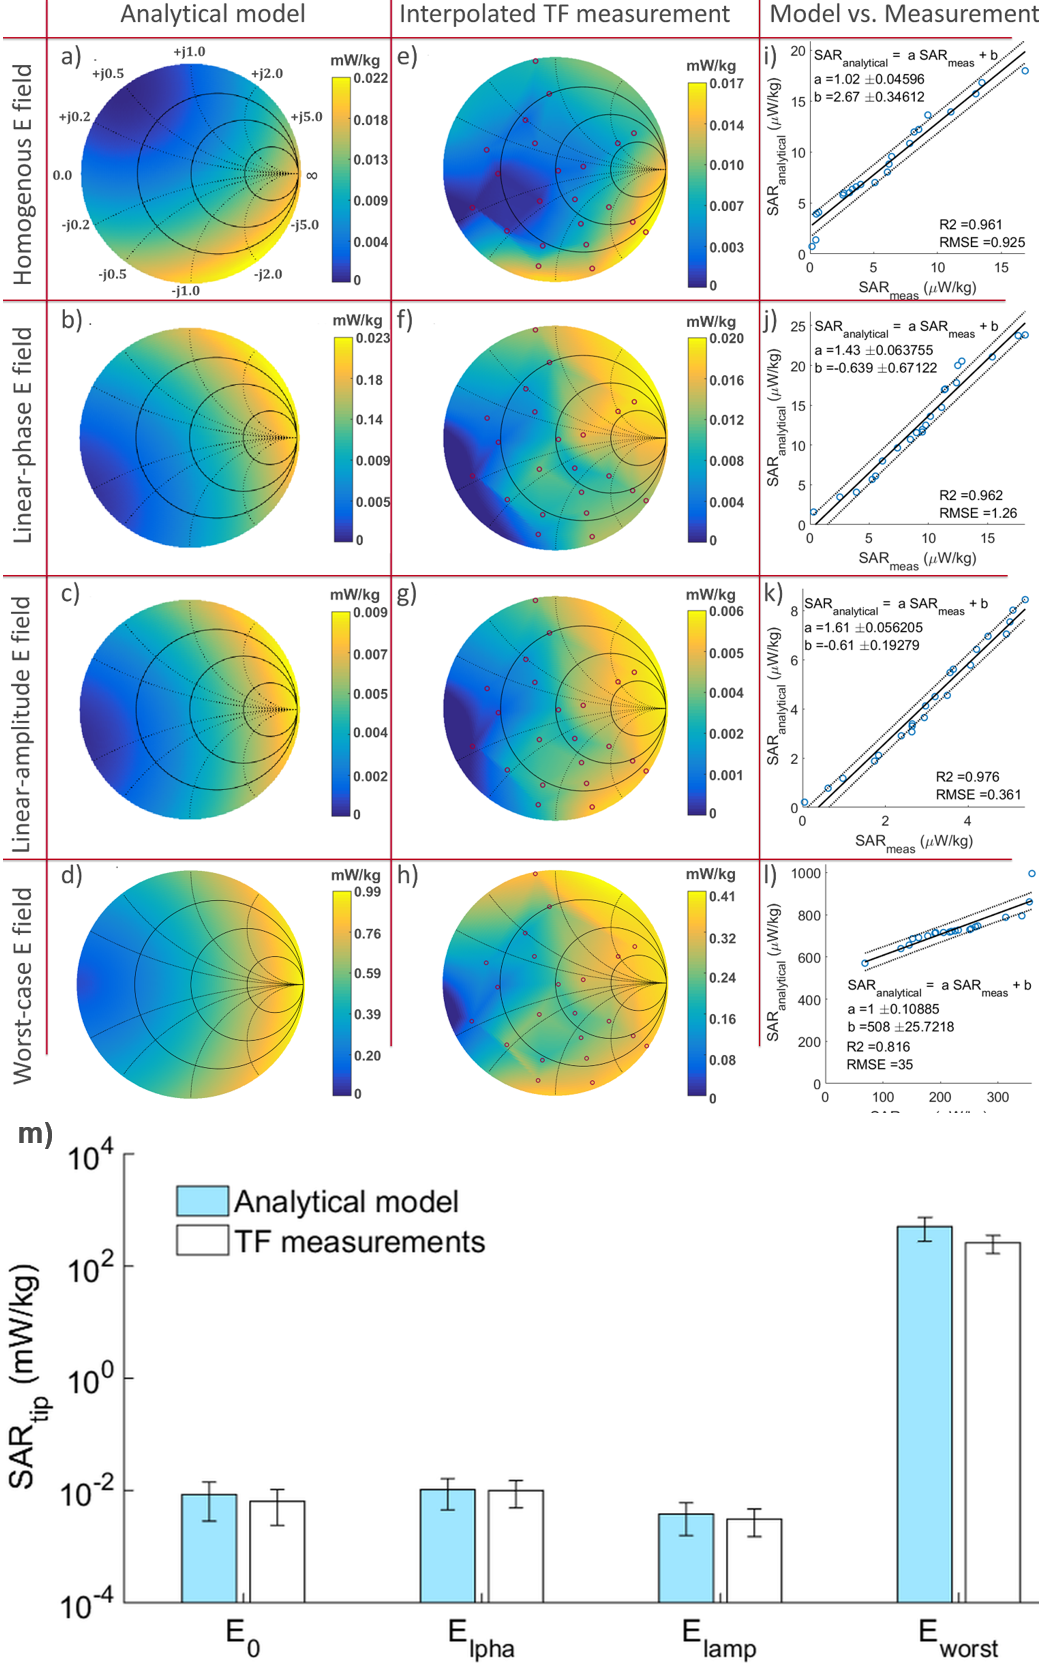
In Figure 4 color-coded Smith charts are shown that plot SARtip as a function of the input reflection coefficient ($$$(Z_{in}-50)/(Z_{in}+50)$$$) for different incident fields. A quantitative comparison is given in Figs. 4 i-l, where the 22 measured SAR values are plotted against the calculated SAR values for the same Zin . For the first three configurations, a very good linear relationship is seen with linear regression coefficients of $$$R^2\geq0.96$$$, and with a lower $$$R^2$$$ of 0.82 for the worst case configuration. To compare the absolute SAR values obtained from analytical and measured TFs, in Fig.4m, mean SARtip is plotted for each incident field $$$E(z)$$$ configuration.
In Fig.5, color coded Smith charts are shown for different air/saline ratio. The optimal and least optimal Zin depends strongly on the cascade ratio in multiple media.
Discussion
The analytic results show that it is possible to minimize tip SAR of an active catheter by a careful choice of Zin – in extreme cases the tip SAR varied by more than 95% between maximum and minimum value. A detailed analytical representation of the interaction of the tip coil with the incident electromagnetic fields might improve the results even close to the coil, especially when the coil size is becoming comparable to the RF wavelength. SAR values calculated from analytical TFs were higher than those from measured TFs, so that the analytical model overestimates SAR increase at the tip. A feedback control system that modifies Zin to minimize the temperature increase at the tip of an active catheter is desirable.Acknowledgements
We gratefully acknowledge generous support from Dr. Tolga Goren of IT’IS Foundation, Zurich, Switzerland, and Dr. Michael Oberle of ZMT Zürich MedTech AG, Zurich, Switzerland.References
1. Park SM, Kamondetdacha R, Nyenhuis J a. Calculation of MRI-induced heating of an implanted medical lead wire with an electric field transfer function. J. Magn. Reson. Imaging 2007;26:1278–1285 doi: 10.1002/jmri.21159.
2. Technical Committee ISO/TC 150. ISO/TS 10974 Assessment of the safety of magnetic resonance imaging for patients with an active implantable medical device. ed. 1, clause 10.; 2012.
3. Maier SE, Wildermuth S, Darrow RD, Watkins RD, Debatin JF, Dumoulin CL. Safety of MR tracking catheters. In: Proc Soc Magn Reson 3. ; 1995. p. 497.
4. Ladd ME, Quick HH, Debatin JF, von Schulthess GK, Mckinnon GC. Resonant heating of intravascular RF coils. In: Proc Intl Soc Mag Reson Med 6. Sydney, Australia; 1998. p. 473.
5. Krafft A, Müller S, Umathum R, Semmler W, Bock M. B1 field-insensitive transformers for RF-safe transmission lines. Magn. Reson. Mater. Physics, Biol. Med. 2006;19:257–266 doi: 10.1007/s10334-006-0055-x.
6. Hetts SW, Saeed M, Martin AJ, et al. Endovascular Catheter for Magnetic Navigation under MR Imaging Guidance: Evaluation of Safety In Vivo at 1.5T. Am. J. Neuroradiol. 2013;34:2083–2091 doi: 10.3174/ajnr.A3530.
7. Elbes D, Magat J, Govari A, et al. Magnetic resonance imaging-compatible circular mapping catheter: an in vivo feasibility and safety study. Europace 2016;19:458–464 doi: 10.1093/europace/euw006.
8. Bönner F, Haberkorn S, Behm P, et al. Magnetic resonance guided renal denervation using active tracking: first in vivo experience in Swine. Int. J. Cardiovasc. Imaging 2018;34:431–439 doi: 10.1007/s10554-017-1244-6.
9. Nitz WR, Oppelt a, Renz W, Manke C, Lenhart M, Link J. On the heating of linear conductive structures as guide wires and catheters in interventional MRI. J. Magn. Reson. Imaging 2001;13:105–14.
10. Yeung CJ, Susil RC, Atalar E. RF safety of wires in interventional MRI: Using a safety index. Magn. Reson. Med. 2002;47:187–193 doi: 10.1002/mrm.10037.
11. Acikel V, Atalar E. Modeling of radio-frequency induced currents on lead wires during MR imaging using a modified transmission line method. Med. Phys. 2011;38:6623–6632 doi: 10.1118/1.3662865.
12. Zemann D, Moertlbauer K. Using transmission line theory to analyze RF induced tissue heating at implant lead tips. In: Proc Intl Soc Mag Reson Med 20. Melbourne, Australia; 2012. p. 2710.
13. Özen AC, Lottner T, Bock M. Safety of active catheters in MRI: Termination impedance versus RF-induced heating. Magn. Reson. Med. 2018:1–12 doi: 10.1002/mrm.27481.
14. Meier K, Burkhardt M, Schmid T, Kuster N. Broadband calibration of E-field probes in lossy media [mobile telephone safety application]. IEEE Trans. Microw. Theory Tech. 1996;44:1954–1962 doi: 10.1109/22.539955.
15. Schmid T, Egger O, Kuster N. Automated E-field scanning system for dosimetric assessments. IEEE Trans. Microw. Theory Tech. 1996;44:105–113 doi: 10.1109/22.481392.
16. Pokovic K, Schmid T, Kuster N. Millimeter-resolution E-field probe for isotropic measurement in lossy media between 100 MHz and 20 GHz. IEEE Trans. Instrum. Meas. 2000;49:873–878 doi: 10.1109/19.863941.
17. Zastrow E, Capstick M, Cabot E, Kuster N. Piece-wise excitation system for the characterization of local RF-induced heating of AIMD during MR exposure. In: 2014 International Symposium on Electromagnetic Compatibility, Tokyo. Tokyo; 2014. pp. 241–244.
Figures
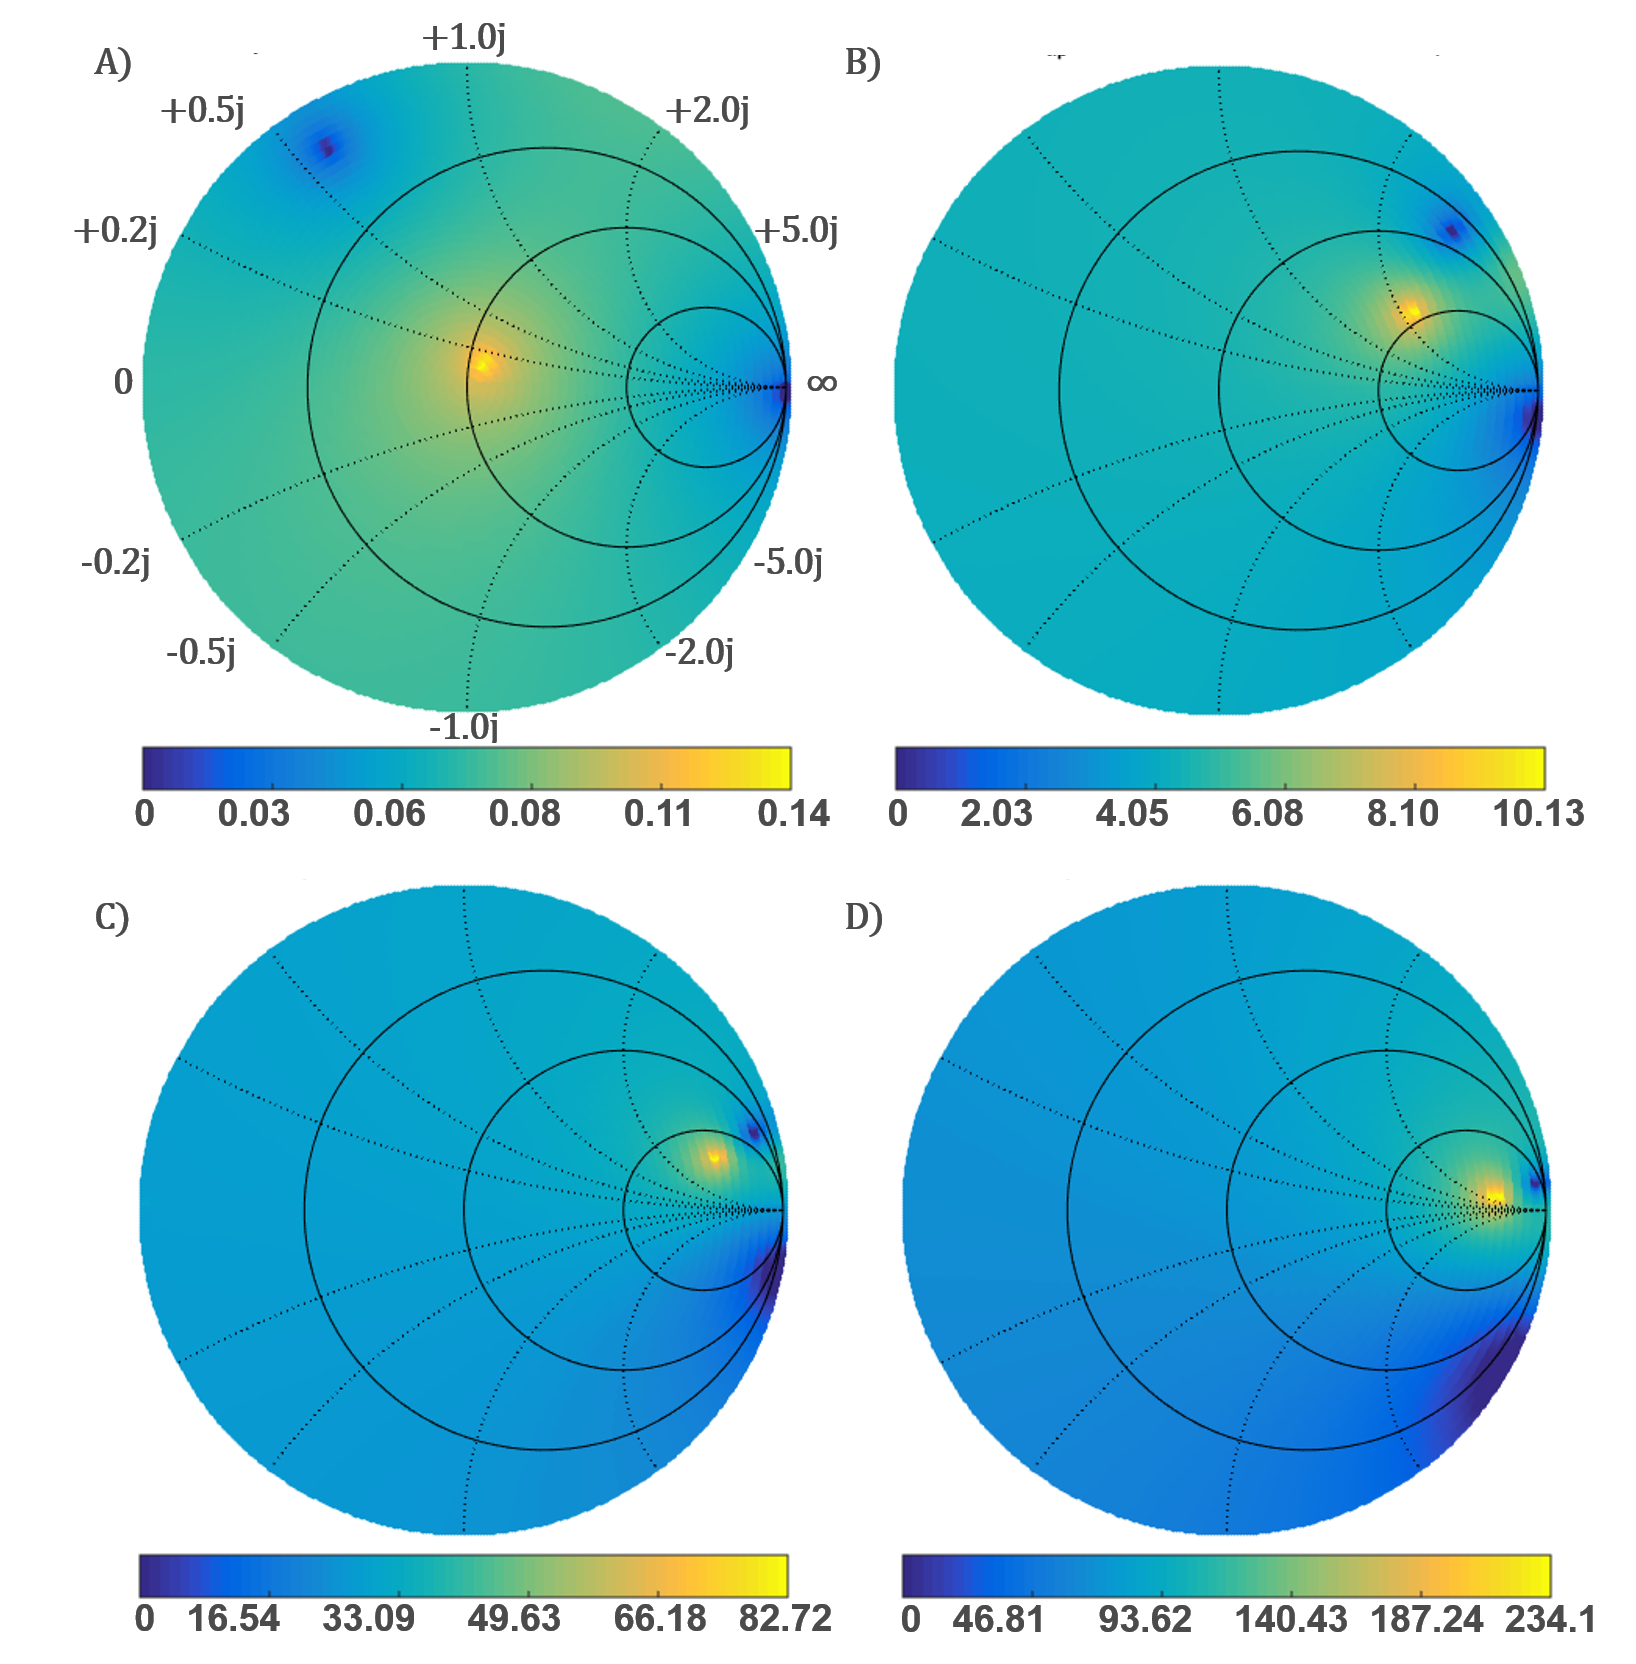
SARtip in μW/kg for an homogeneous incident field of $$$E(z)=1$$$ V/m. Color coded Smith chart plots for the catheter model partially immersed with different air/lossy medium ratio: A) 10/100 B) 30/80 C) 55/55 D) 90/20.