4174
Individualized SAR Calculations Using Computer-Vision-Based MR Segmentation and a Fast Electromagnetic Solver1Athinoula A. Martinos Center for Biomedical Imaging, Department of Radiology, Massachusetts General Hospital and Harvard Medical School, Charlestown, MA, United States, 2Harvard Medical School, Boston, MA, United States, 3Dept of Electrical Engineering and Computer Science, Massachusetts Institute of Technology, Cambridge, MA, United States, 4Institute for Medical Engineering and Science, Massachusetts Institute of Technology, Cambridge, MA, United States, 5Harvard-MIT Division of Health Sciences Technology, Cambridge, MA, United States
Synopsis
Current local specific absorption rate (SAR) calculations with offline simulated body models yield conservative safety limits on parallel transmission protocols. By using a personalized medicine approach, whereby the patient-specific body model is generated as the patient lies on the table, more accurate safety limits can be employed. In this study, we developed a fast methodology to scan the patient, segment the body, and calculate the global and local SAR. Our results from multiple volunteer scans show a 30% variation in local SAR, indicating the need for a patient-specific approach.
Introduction
The local specific absorption rate (SAR) expected in parallel transmission systems (pTx) is verified by 1) simulating a range of body models spanning the normal biological/anatomical variability; 2) computing SAR matrices for this cohort of body models; and 3) compressing the SAR matrices of all models into a small set of virtual observation points.1 This approach is reasonable and yields safe protocols but uses a conservative limit based on the worst-case SAR across models. A personalized medicine approach using the local SAR computed for the specific patient being imaged could both improve this situation and accurately protects “non-standard” patients, e.g. amputations, pregnancies and unusual body positions. We propose a methodology that computes the local SAR for the specific patient being imaged based on tissue and electromagnetic (EM) modeling that is fast enough to be practical in a clinical setting.Methods
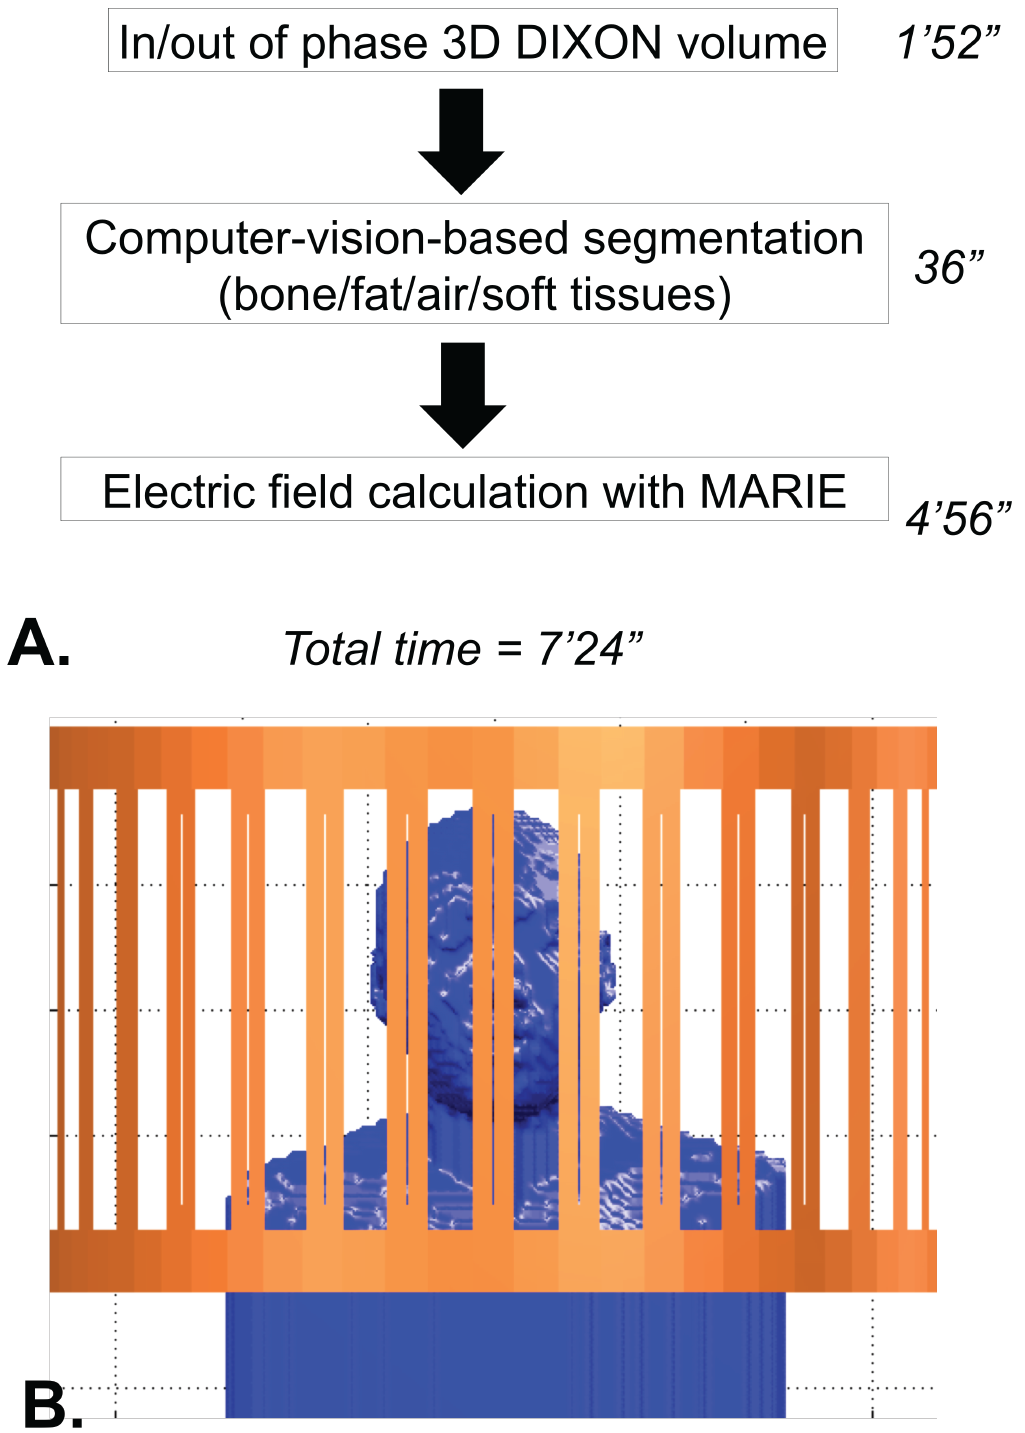
Workflow: Fig. 1 shows the method’s workflow. First a 3D DIXON in/out of phase volume acquisition provides the individualized body model. This step takes ~1.5 min using a standard, unaccelerated GRE-based DIXON sequence with resolution 2.6x2.6x3.1 mm3, but could be considerably accelerated using parallel imaging (e.g. CAIPI-DIXON is <20 seconds for this voxel size2). The image volume is then segmented into a labeled electromagnetic body model by an automatic computer-vision-based segmenter (air, bone, fat, soft tissues)3,4. Next a fast EM volume integral solver, MARIE,5,6 computes electric fields/SAR matrices and B1+ maps. The latter are used for patient-specific assessment of the simulation accuracy. The current total cumulative time of the workflow is <8 minutes.
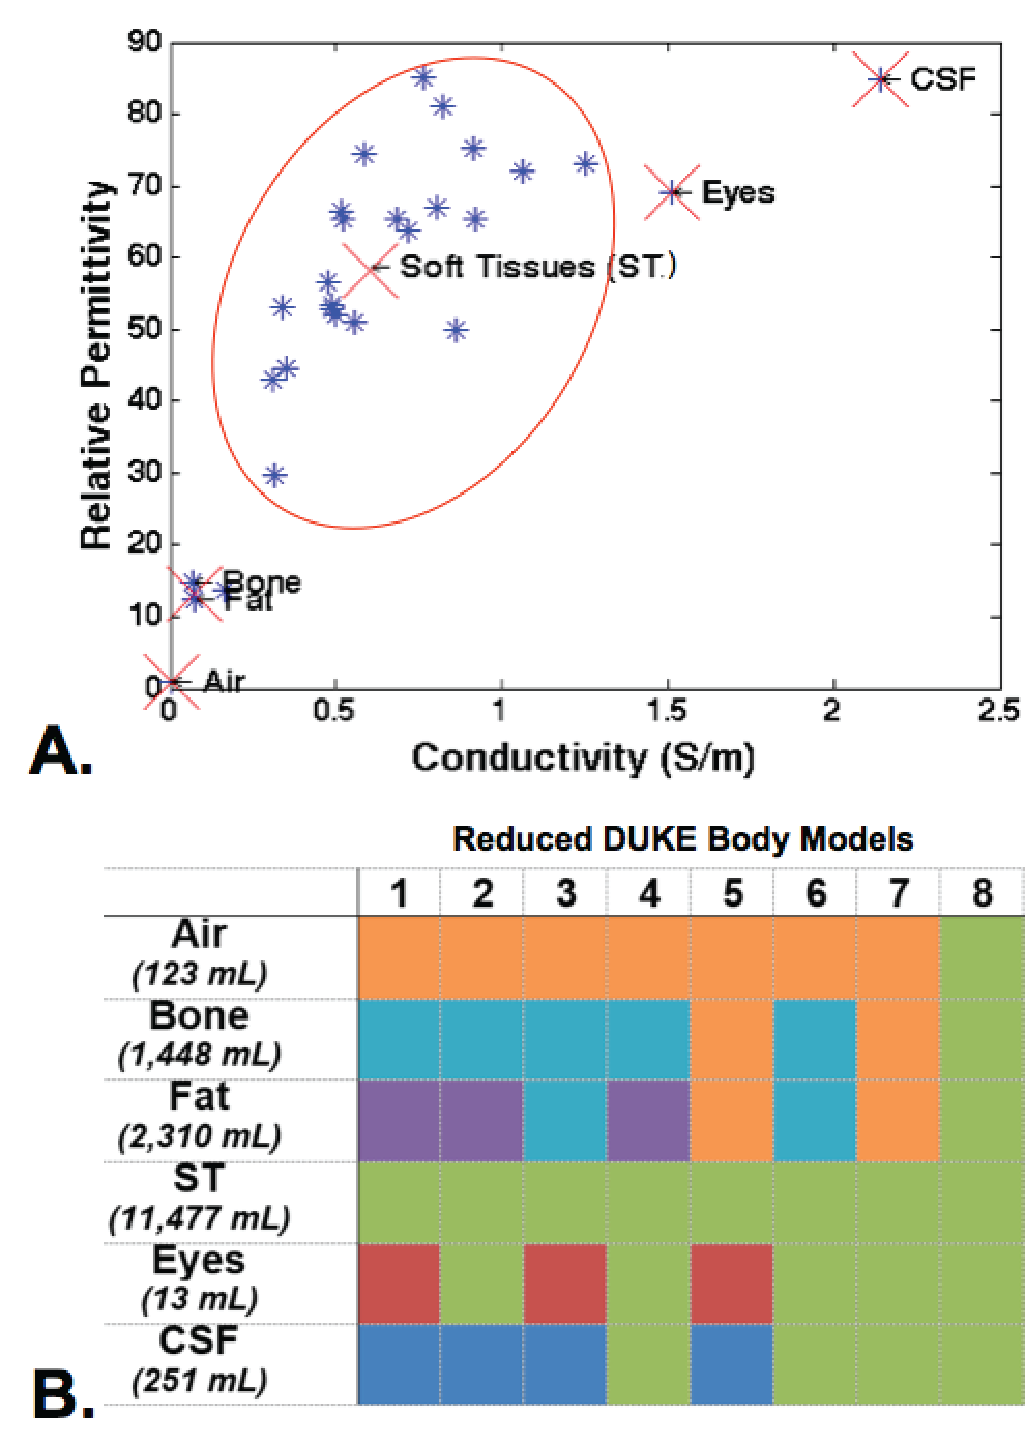
Validation of body model simplifications using the DUKE Body Model: We assessed the impact of the number of tissue classes on global and local SAR using MARIE and the DUKE body model.7 Namely, we simplified the DUKE model (5 mm isotropic voxel size) by grouping tissue classes using a weighted average depending on their conductivity and permittivity as shown in Fig. 2.8 We generated 8 simplified body models (“Reduced DUKE Body Models”) in addition to the original 52 and 77 tissue classes version (truncated DUKE and whole body DUKE, respectively).
Electromagnetic simulation using MARIE: We simulated a 32-rung high-pass body coil (Fig. 1) and all body models using the MARIE fast EM solver5 on an Nvidia Tesla P100 GPU in a high end workstation. Tuning capacitors were assigned the known values and quadrature drive was employed. A radiofrequency (RF) shield was included in all simulations, as it is present in the actual coil. The MARIE method is able to pre-compute the surface integral equation (SIE) associated with the coil model and thus accelerate the computations needed while the patient is on the table.
Volunteer acquisitions: We applied the workflow in Fig. 1 to five healthy volunteers scanned on a Siemens 3T Skyra system (age, height, weight and BMI ranges were 22-33 years old, 167-188 cm, 134-250 lbs. and 21-32.1 kg/m2).
Results
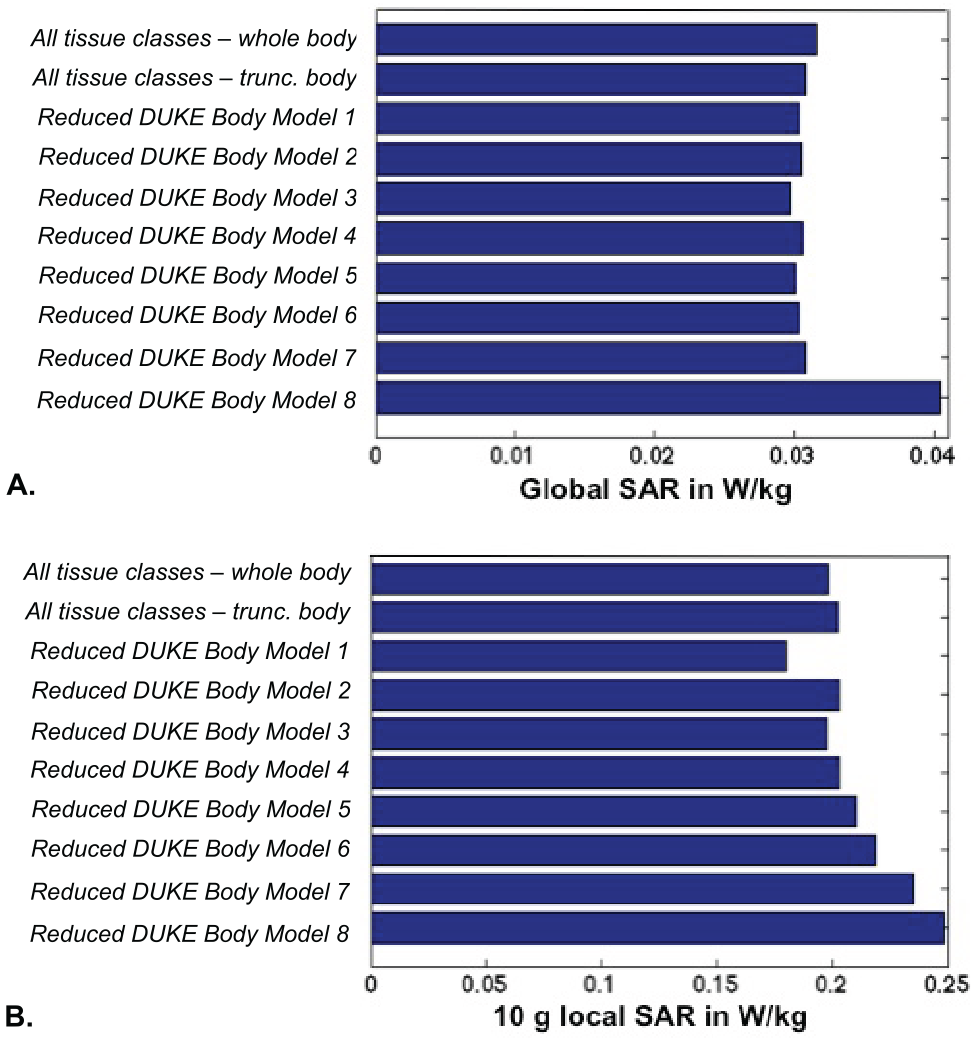
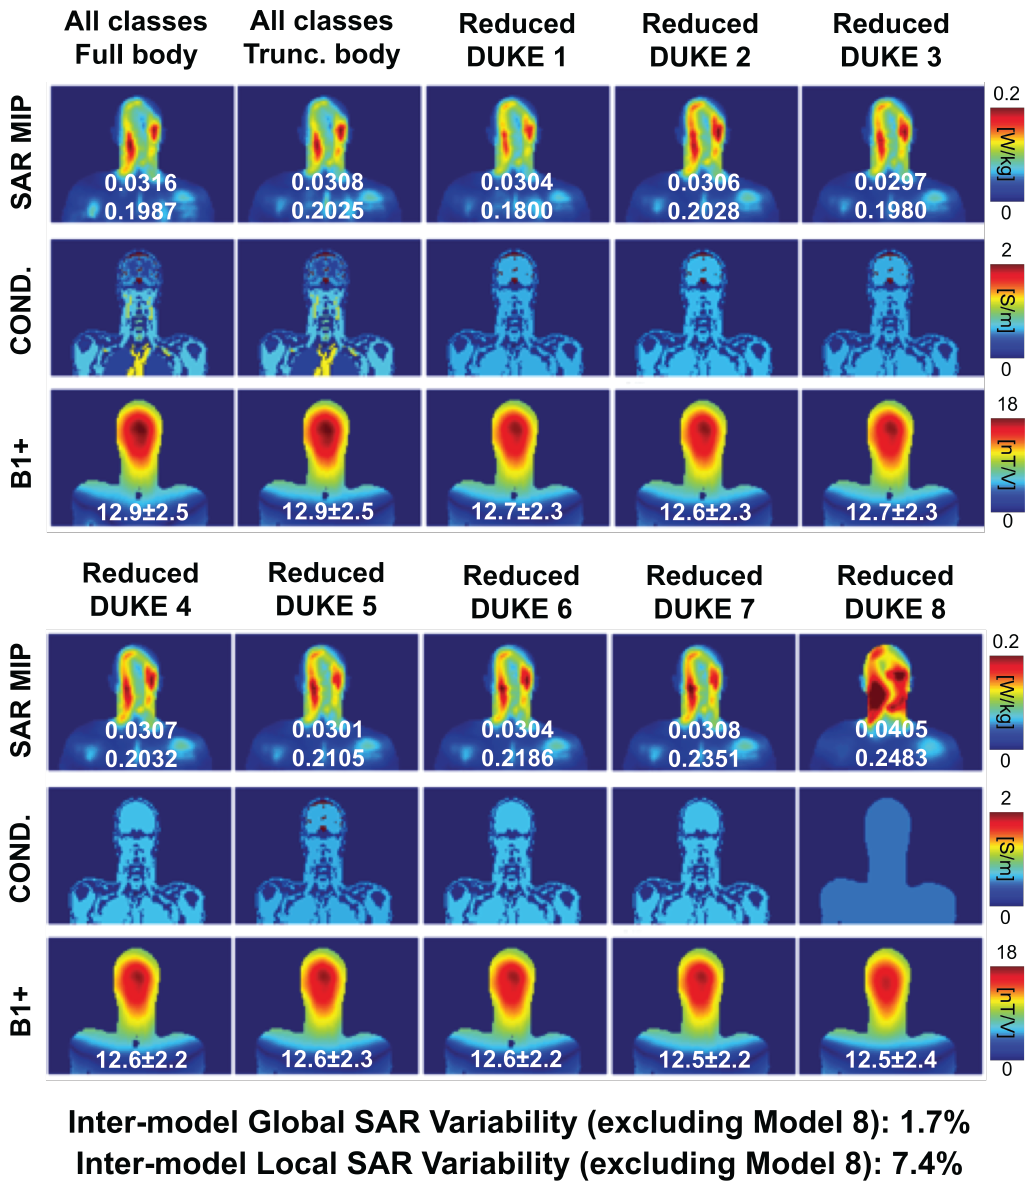
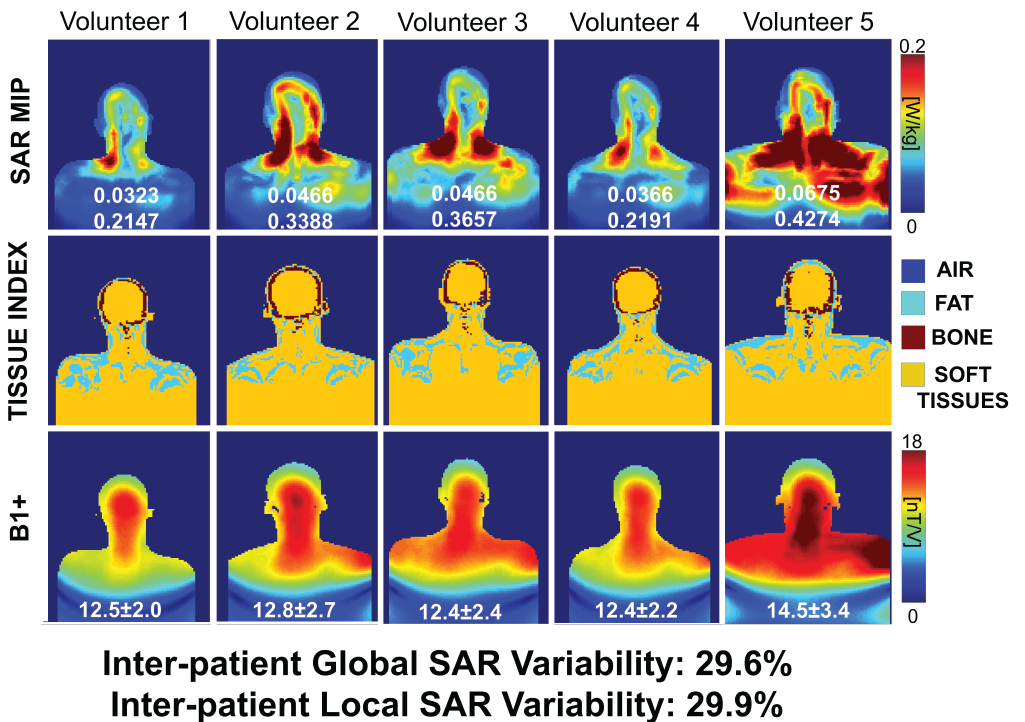
Fig. 3 shows that the global and local SAR are relatively stable across the reduced DUKE models (global SAR standard deviation (SD)/mean variation=1.7%, local SAR SD/mean=7.4% when excluding the simplest model 8). Truncation below the shoulders did not have a considerable effect. Assigning the eyes’ electromagnetic properties to soft tissues (Models 2/4) did not impact local SAR considerably either (average percent error of 2.2% from Models 2/4 compared to whole body DUKE local SAR). Changing the conductivity of CSF to that of soft tissue in Models 6/7/8 did impact local SAR by 11.4% (average percent error of Models 6/7/8), due to the fact that the SAR hotspot is in the CSF (Fig. 4). The global and 10 g local SAR SD/mean variability across volunteers were 29.6% and 29.9%, respectively (Fig. 5).Discussion and Conclusion
Our analysis indicates that modeling of CSF is important for accurate SAR prediction. This suggests that our DIXON-based imaging protocol may need to be augmented by a T2-weighted sequence for extraction of the CSF component, thus possibly lengthening the total image acquisition. However, results from our five volunteers indicate that accurately modeling the patient shape and position in the scanner is more important than attempting to model accurately all tissue classes. The current workflow can be significantly accelerated using parallel imaging (DIXON, T2-weighted images) and C++ implementation as well as a new trick that allows precomputation of the body-coil coupling matrix (MARIE).Acknowledgements
NIH grants EB019482 and EB006847.References
1. Eichfelder, G. and M. Gebhardt (2011). "Local specific absorption rate control for parallel transmission by virtual observation points." Magnetic Resonance in Medicine 66(5):1468-1476
2. Freitag, M. T., et al. (2017). "Improved clinical workflow for simultaneous whole-body PET/MRI using high-resolution CAIPIRINHA-accelerated MR-based attenuation correction." European Journal of Radiology 96: 12-20.
3. A Torrado-Carvajal et al. (2018). “Computer-Vision Techniques for Water-Fat Separation in Ultra-High Field MRI Local specific absorption Rate Estimation”. IEEE Transactions on Biomedical Engineering.
4. A Torrado-Carvajal et al. (2016). “Fast patch-based pseudo-CT synthesis from T1-weighted MR images for PET/MR attenuation correction in brain studies.” Journal of Nuclear Medicine 57(1):136-143.
5. Villena, J., et al. (2016). "Fast Electromagnetic Analysis of Transmit RF Coils based on Accelerated Integral Equation Methods." IEEE Transactions on Bio-medical Engineering.
6. Polimeridis, A., et al. (2014). "Stable FFT-JVIE solvers for fast analysis of highly inhomogeneous dielectric objects." Journal of Computational Physics 269:280-296.
7. Christ, A., et al. (2010). "The Virtual Family—development of surface-based anatomical models of two adults and two children for dosimetric simulations." Physics in Medicine and Biology 55(2):N23.
8. Gabriel, S., et al. (1996). "The dielectric properties of biological tissues: III. Parametric models for the dielectric spectrum of tissues." Physics in Medicine & Biology 41:2271–2293.
9. Wolf, S., et al. (2013). “SAR Simulations for High-Field MRI: How Much Detail, Effort, and Accuracy Is Needed?” Magnetic Resonance in Medicine 69(4):1157-68.
Figures