4173
Impact of different materials along the lead body and at the electrode on temperature rise at the electrode of an active implant1Electrical and Computer Engineering, Purdue University, West Lafayette, IN, United States
Synopsis
Temperature rise, scaled to the square of
Introduction
The lead wire (lead body) of an implanted active implant interacts with the electric field induced during MRI to yield a temperature rise at the electrode. The purpose of this work is to analyze the impact of different materials along the lead body and at the electrode on temperature rise at the electrode of an active implant.Methods
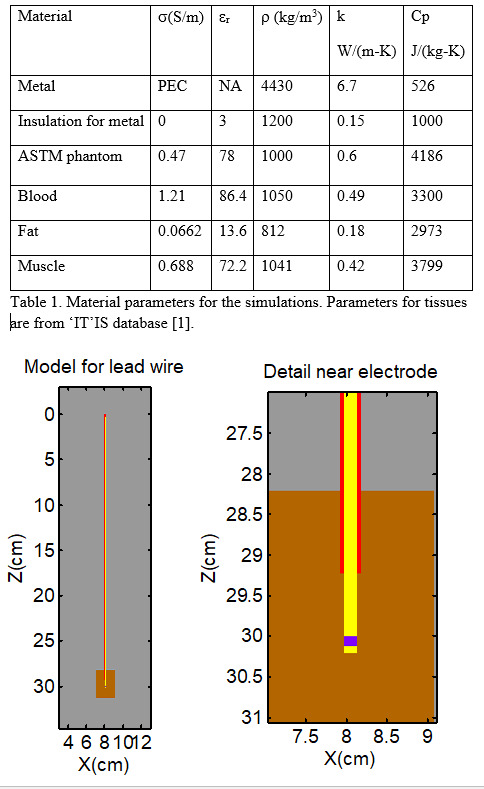
Calculations presented here were performed with a custom FDTD program and thermal solver. Figure 1 shows the model for the calculations. A lead is modeled as a 30-cm length of wire with a diameter of 1.6 mm and insulation diameter of 2.5 mm. 1 cm of insulation was removed from the end to represent an exposed electrode. A region of 1 cm beyond the electrode represents the medium surrounding the electrode. Materials of different electrical properties (ASTM phantom, blood, fat, and muscle) were used in the calculations. Table 1 lists the electrical and thermal properties of the materials. The incident electric field was a plane wave with a polarization parallel to the length of the lead. The electric field, and hence the SAR, around the electrode was calculated with the FDTD program. Temperature rise at the electrode is calculated by applying the bio-heat equation to the SAR distribution.
The electric field transfer function was determined by inserting a voltage source near the end of the electrode, as indicated by the violet section near the end of the electrode in Figure 1. The transfer function is then proportional to the current distribution along the length of the lead. The electric field transfer function was measured with an apparatus that utilized a current sensor and a vector network analyzer.
Results and Discussions
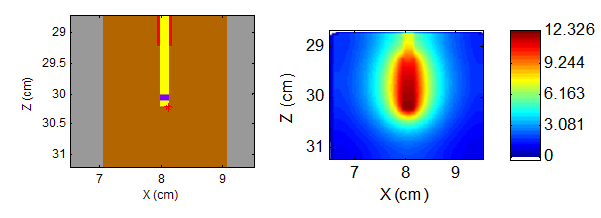
Figure 2 shows a sample plot for the calculated temperature rise at the electrode. A similar calculation was done for the other 15 combinations of the lead body material and material surrounding the electrode.
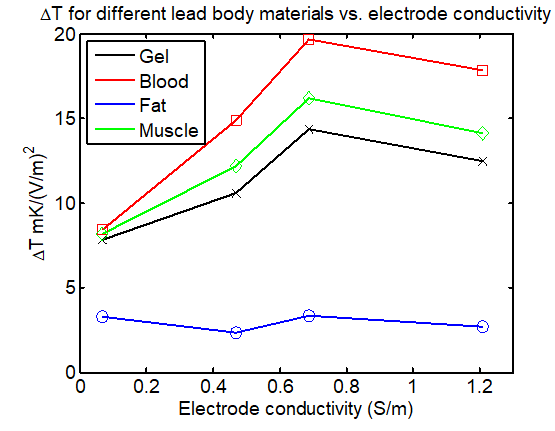
Figure 3 shows the temperature rise for different lead body materials vs. electrode conductivity, scaled to the square of the background electric field. Temperature rise is greatest for blood and least for fat. For materials other than fat, the greatest rise occurs for muscle. This is because muscle yields electrode impedance that provides the best match to the source impedance of the lead [3].
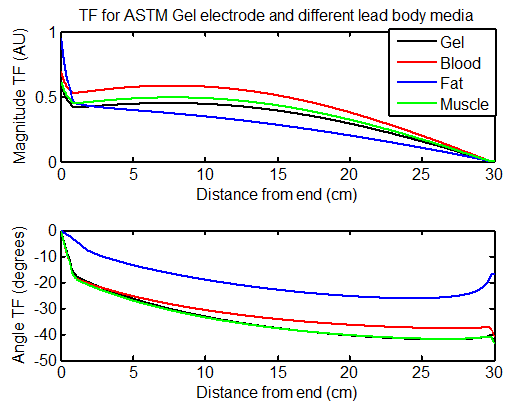
Figure 4 shows the transfer function plots for ASTM gel electrode and different lead body materials. The magnitude of the transfer function is maximum at the distal end and zero at the proximal end, due to the insulating cap. The magnitude of the transfer function is consistent with the temperature rises from Figure. 3, as the temperature rise and transfer function S are related through the equation[2] $$\triangle T=|\int_{0}^{L} S(z)E_{tan}(z)dz|^2$$
where Etan is the tangential electric field and z is the distance along the lead.
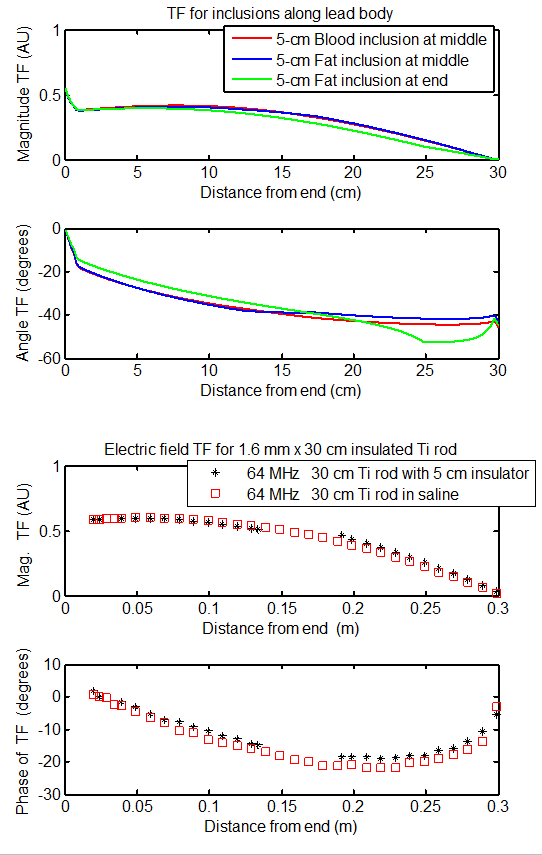
In the in-vivo situation, the lead body will have tissues with different electrical properties along its length. Figure 5 shows calculated transfer functions for blood and fat inclusions along the lead body with a background ASTM phantom. In the calculations, the transfer function is minimally impacted with a section of material with conductivity higher or lower than the background ASTM phantom material. However, the magnitude of the transfer function is reduced by as much as 20% at some locations when a 5-cm length of relatively insulating fat is placed at the proximal end. In the measurements, the transfer function was measured for an insulated titanium rod with and without a 5-cm insulation around the center. The measured transfer functions for these two configurations are nearly the same, consistent with the calculations. The transfer function changed by about 10% when the insulator was moved along the length of the rod, a finding that is consistent for the calculation.
Conclusions
1) Electric field transfer function magnitude and phase, and hence electrode heating, are impacted by the material along the lead body. We expect the impact of the lead body material on the transfer function to be greater for thinner insulation. The generator impedance is also expected to the temperature rise at the electrode.
2) Temperature rise at the electrode depends on the electrical properties of the surrounding tissue. The greatest rise occurs when the electrode impedance matches the source impedance of the lead.
3) Short (< 5 cm) sections of heterogenous tissue along the lead body appear to have minimal impact on the transfer function. The impact of the included tissue on the temperature rise depends on its location along the lead.
Acknowledgements
No acknowledgement found.References
1) Hasgall PA, Di Gennaro F, Baumgartner C, Neufeld E, Lloyd B, Gosselin MC, Payne D, Klingenböck A, Kuster N, “IT’IS Database for thermal and electromagnetic parameters of biological tissues,” Version 4.0, May 15, 2018, DOI: 10.13099/VIP21000-04-0.
2) S-M Park, R. Kamondetdacha, J.A. Nyenhuis, " Calculation of MRI induced heating of an implanted medical lead wire with an electric field transfer function," J. Magn Reson. Imag., vol. 26, no. 5, pp- 1278-1285, 2007
3) Langman, D. A., Goldberg, I. B., Judy, J. , Paul Finn, J. and Ennis, D. B. (2012), The dependence of radiofrequency induced pacemaker lead tip heating on the electrical conductivity of the medium at the lead tip. Magnetic Resonance Medicine, 68: 606-613. doi:10.1002/mrm.23235
Figures