4171
Standardized, Validated and Effective Safety Assessment of Patients with Medical Implants under MRI Exposure Using a Comprehensive Data Library Combined with an Analytics Toolset1IT'IS Foundation, Zurich, Switzerland, 2ETHZ, Zurich, Switzerland
Synopsis
The radiofrequency (RF) induced heating for patients with implants during exposure to magnetic resonance imaging (MRI) is a complex function of multiple factors, e.g., implant characteristic, patient anatomy, imaging position, RF coil, etc. A comprehensive safety assessment cannot be derived from the limited scenarios possible in clinical trials. We have established an in silico safety assessment trial that comprises a comprehensive data library with a data analytics toolset to perform a complete evaluation in a timely and traceable manner. We demonstrate the workflow for RF-induced heating evaluation for patients with medical implants.
Introduction
For patients with medical implants, the magnitude of radiofrequency (RF) induced heating during magnetic resonance imaging (MRI) amounts to a multitude of variables specific to the MRI system (e.g., RF-coil design and manufacturing details), patient anatomy, and imaging positions. The actual exposure scenarios to be considered for any safety evaluations are generally several thousands. Therefore, clinical trials performed with a very reduced number of these scenarios are likely to be insufficient to ensure patient safety as conservative exposure situations cannot conclusively be determined a priori. It is therefore essential that a standardized framework that provides not only relevant but also comprehensive, consistent, extendable, and traceable results be established to facilitate the establishment of a corroborated knowledge base built upon existing and emerging results. We report the formulation of a standardized workflow which facilitates in silico trials. In this work, an in silico trial for RF-heating evaluation of generic implants during 1.5T MRI exposure is demonstrated.Methods
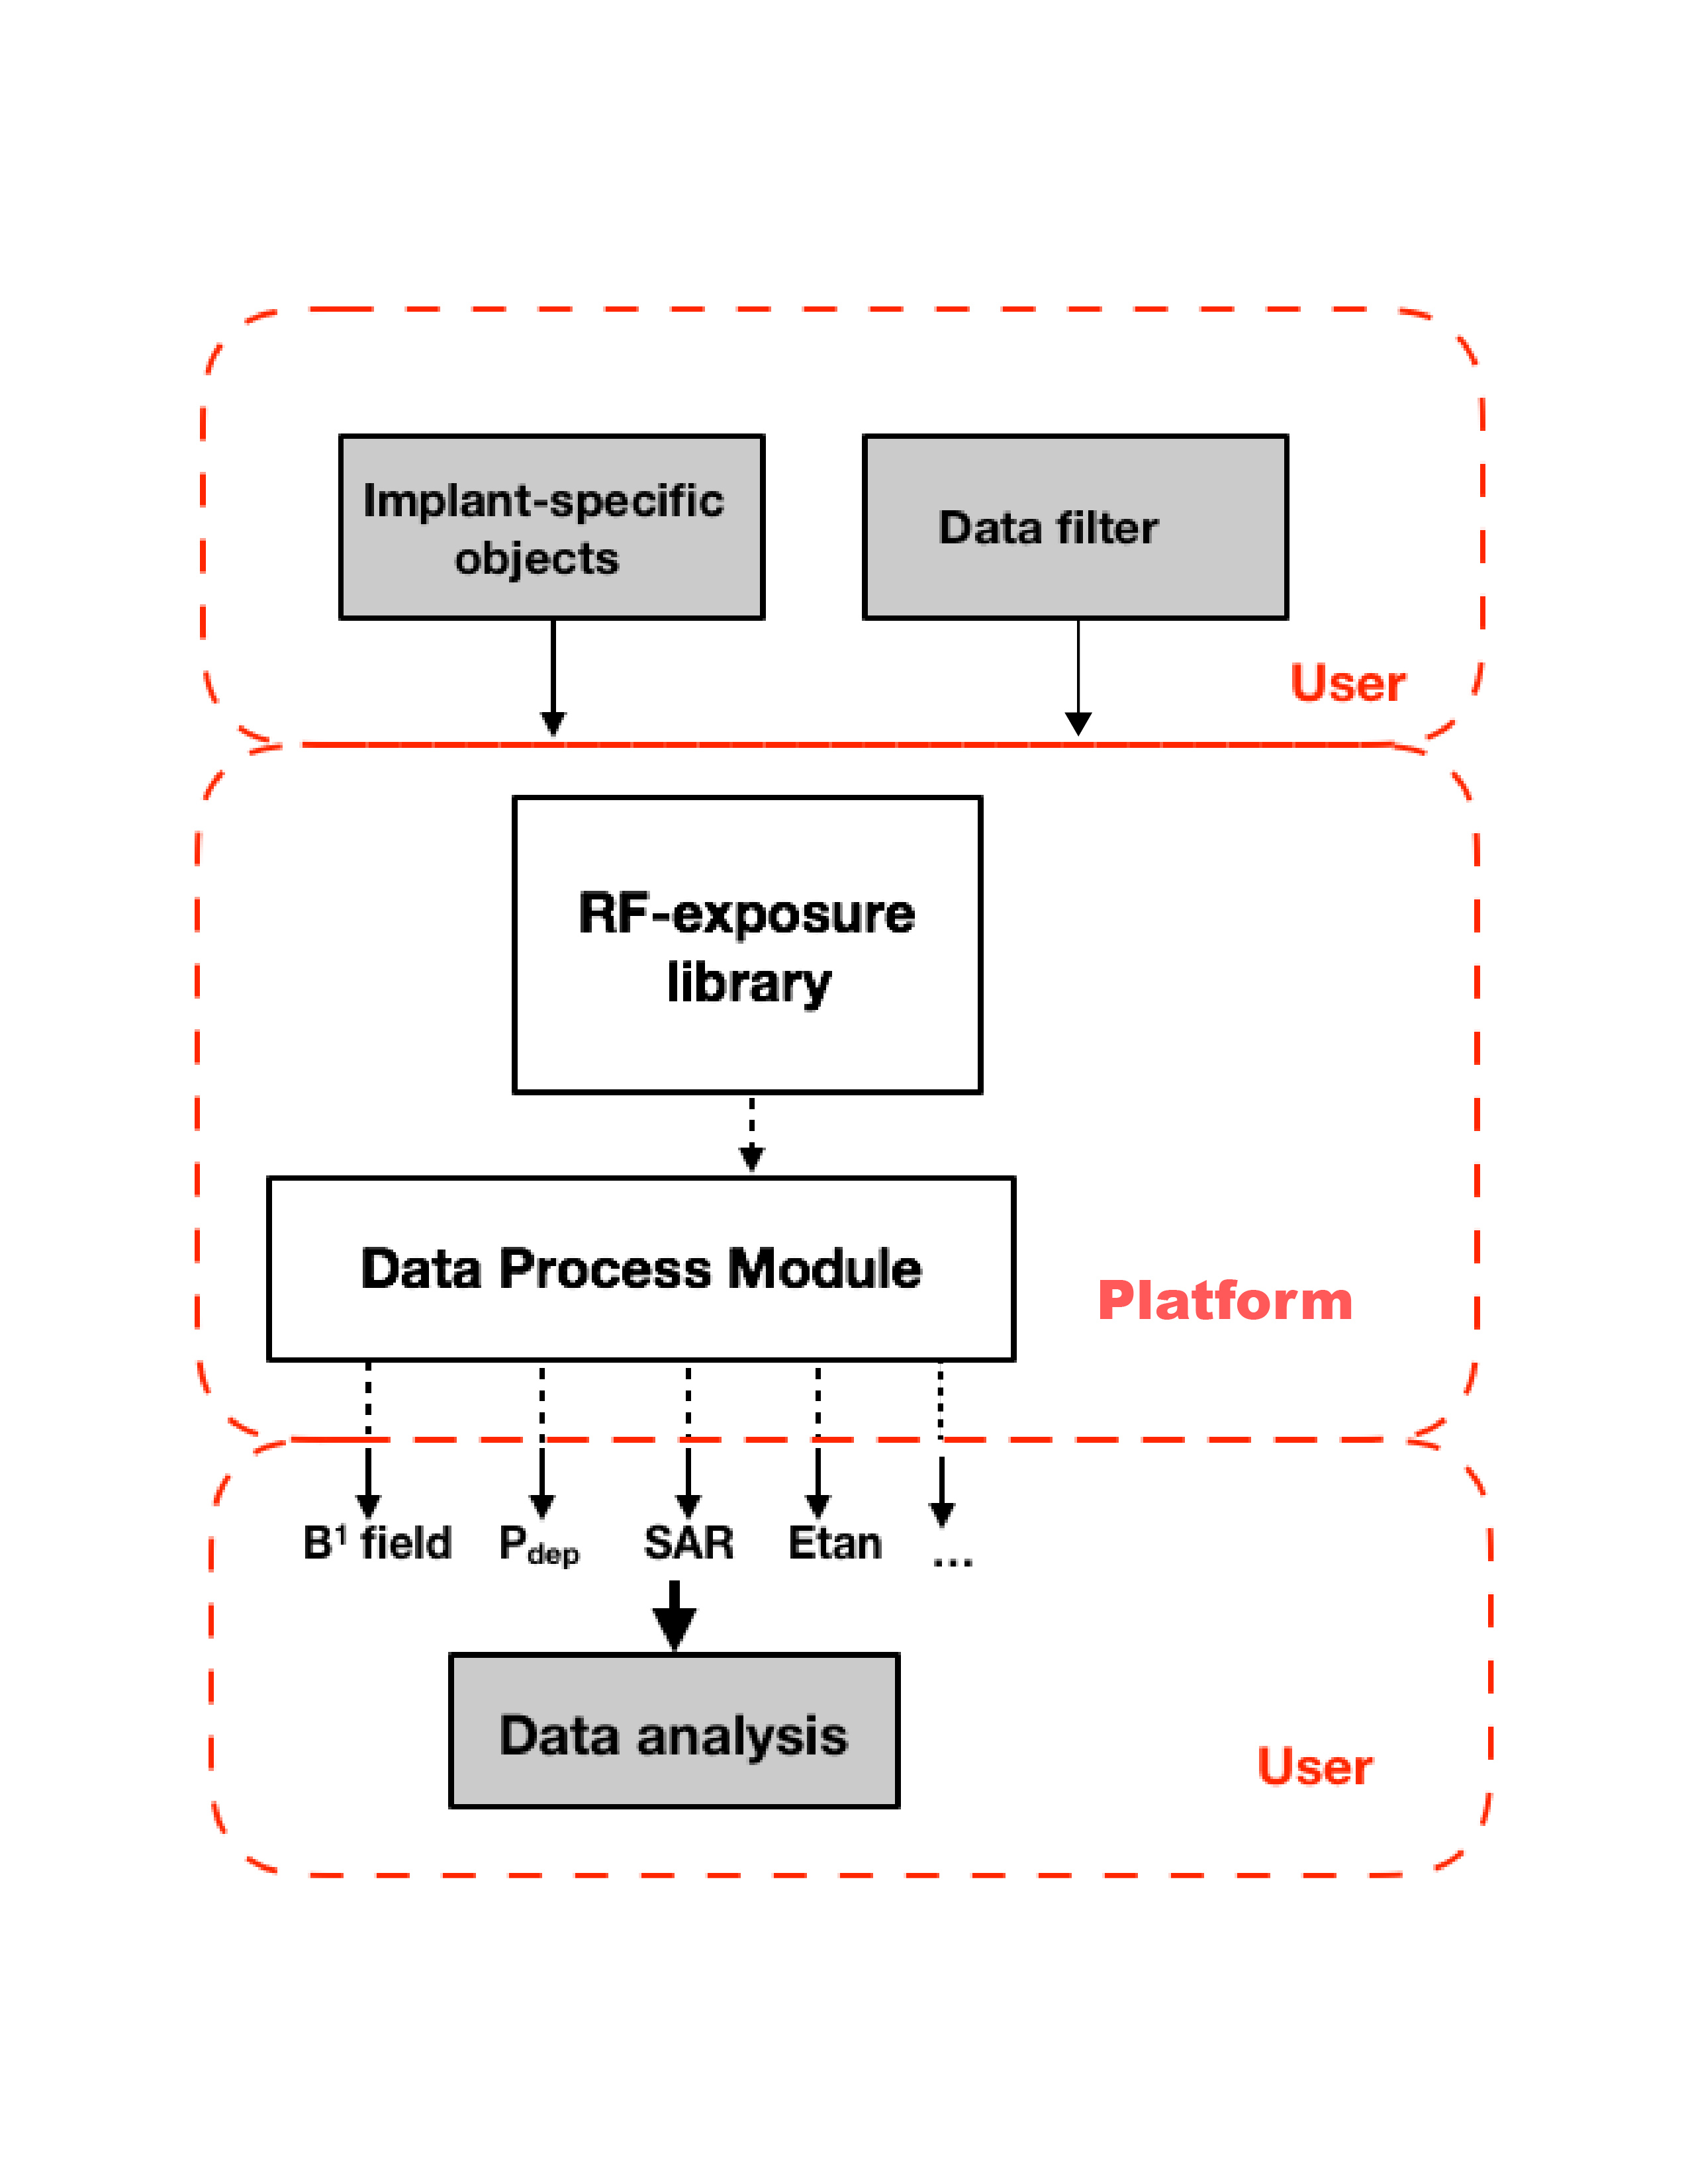
The proposed workflow consists of five components. It is designed such that each component can be revised and evolve independently (see also Figure 1):
1. RF-exposure data library: A collection of pre-computed RF-induced fields inside a variety of patients during MRI exposures. This component is the pre-computed RF-induced fields during MRI exposures inside multiple patients. The library comprises the exposure of a set of computational phantoms (different patient anatomy) of the Virtual Population (ViP)1 to a set of generic RF body-coils at different clinical imaging positions.
2. Implant-specific objects: This component includes the digital representations of clinical routings of the implants under test (IUT) as well as the Tier 3 model for RF-induced heating of the IUT 2.
3. Data filter: This component allows the user to select the specific dataset for each in silico trial.
4. Data processing module: A software module with a clear and traceable digital evidence.
5. Output data/results: The results of the trial as a traceable output available for analysis.
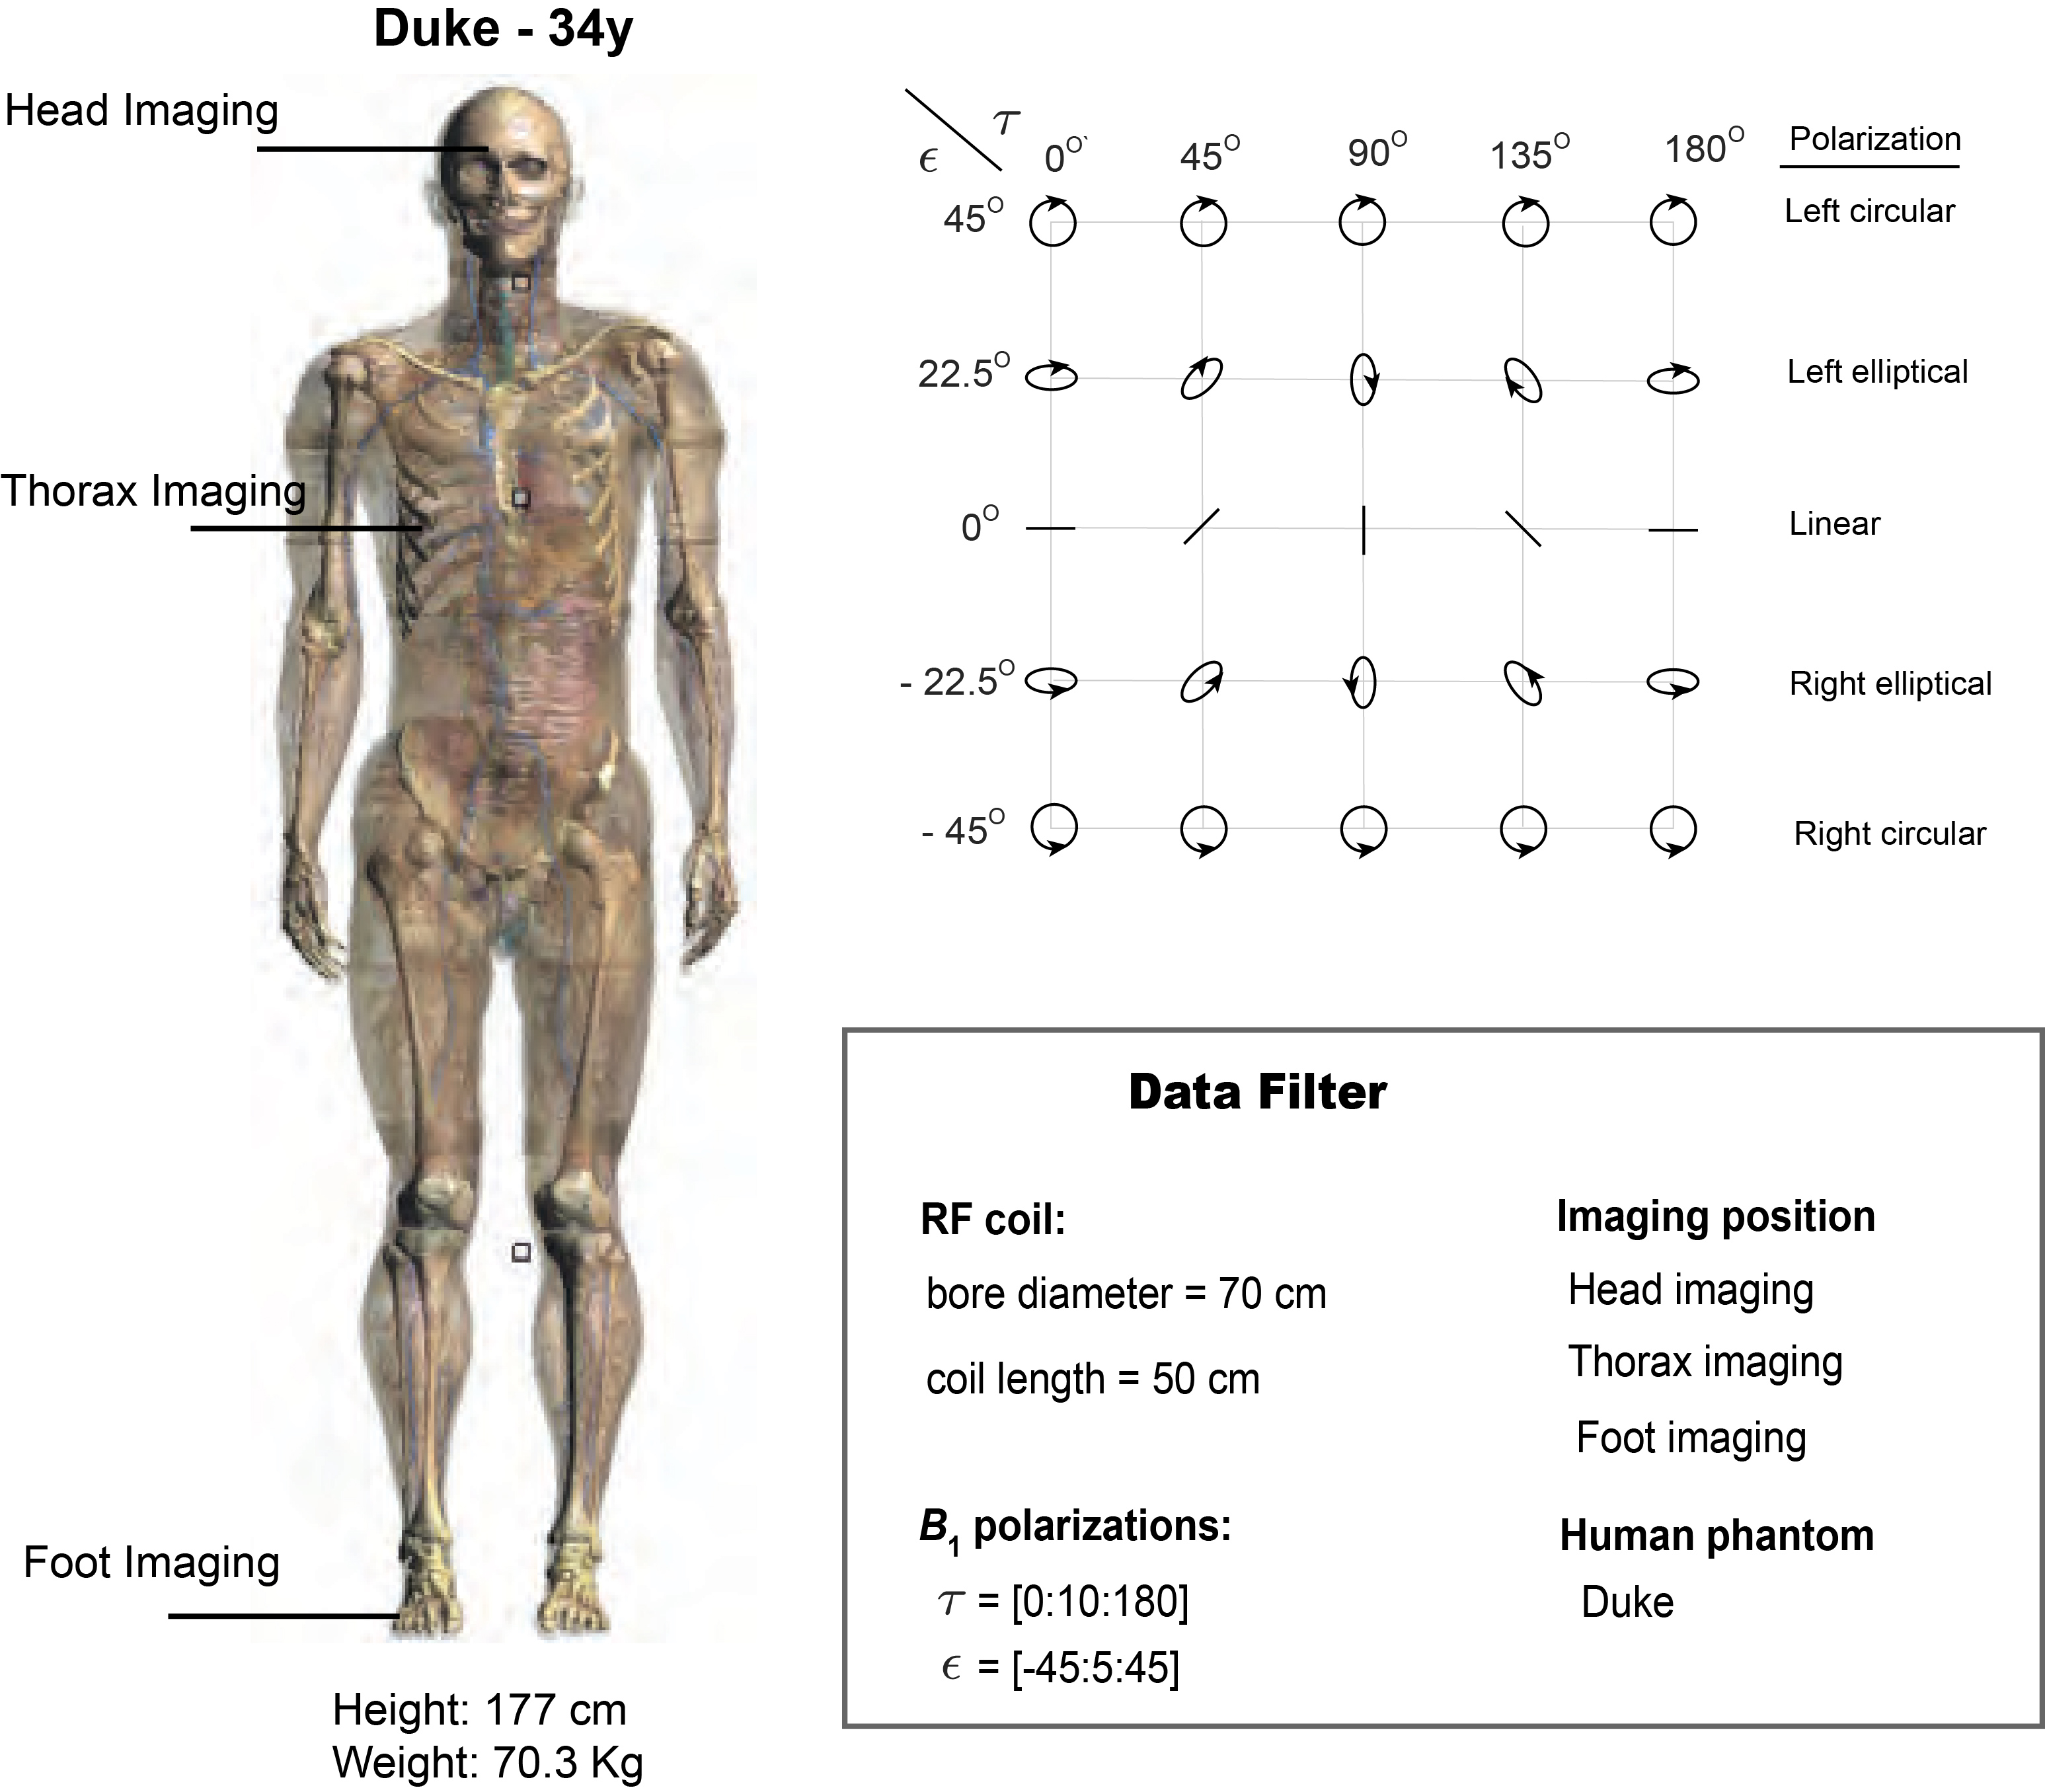
We apply the workflow to evaluate the RF-induced heating of an IUT during 1.5 T MRI. The IUT is a 60-cm generic spinal cord stimulator. Figure 2 summarizes the data filter which defines the selection of the trial.
Safe RF exposure conditions for commercial active implantable medical devices (AIMDs) are expressed in terms of both specific absorption rate (SAR) and B1+ level3. Therefore, the local deposited power of the IUT is evaluated at the normal operating mode SAR limits4 and as well as at a fixed B1+ level.
The results are investigated further to indicate scenarios that may improve patient safety and image quality. As an example, a set of the following constraints on the IUT power deposition, B1+ homogeneity, and B1+ magnitude, is imposed on the output data/results of the RF-induced heating assessment:
1. B1+ level, measured by the average magnitude of B1+ over the isocenter slice of the RF-coil, is at least 90% of that provided by circular-polarized B1.
2. B1+ homogeneity, measured by the coefficient of variation of B1+ 5 over the isocenter slice of the RF-coil, does not exceed 10%.
3. The power deposition of the IUT does not exceed 300 mW.
Concisely:
<|B1+(ϵ,τ)|> ≥ 0.9* <|B1+(45o, τ)|> (1)
B1+,cov(ϵ,τ ) ≤ 0.1 (2)
Pdep(ϵ,τ ) ≤ 0.3 (3)
Results
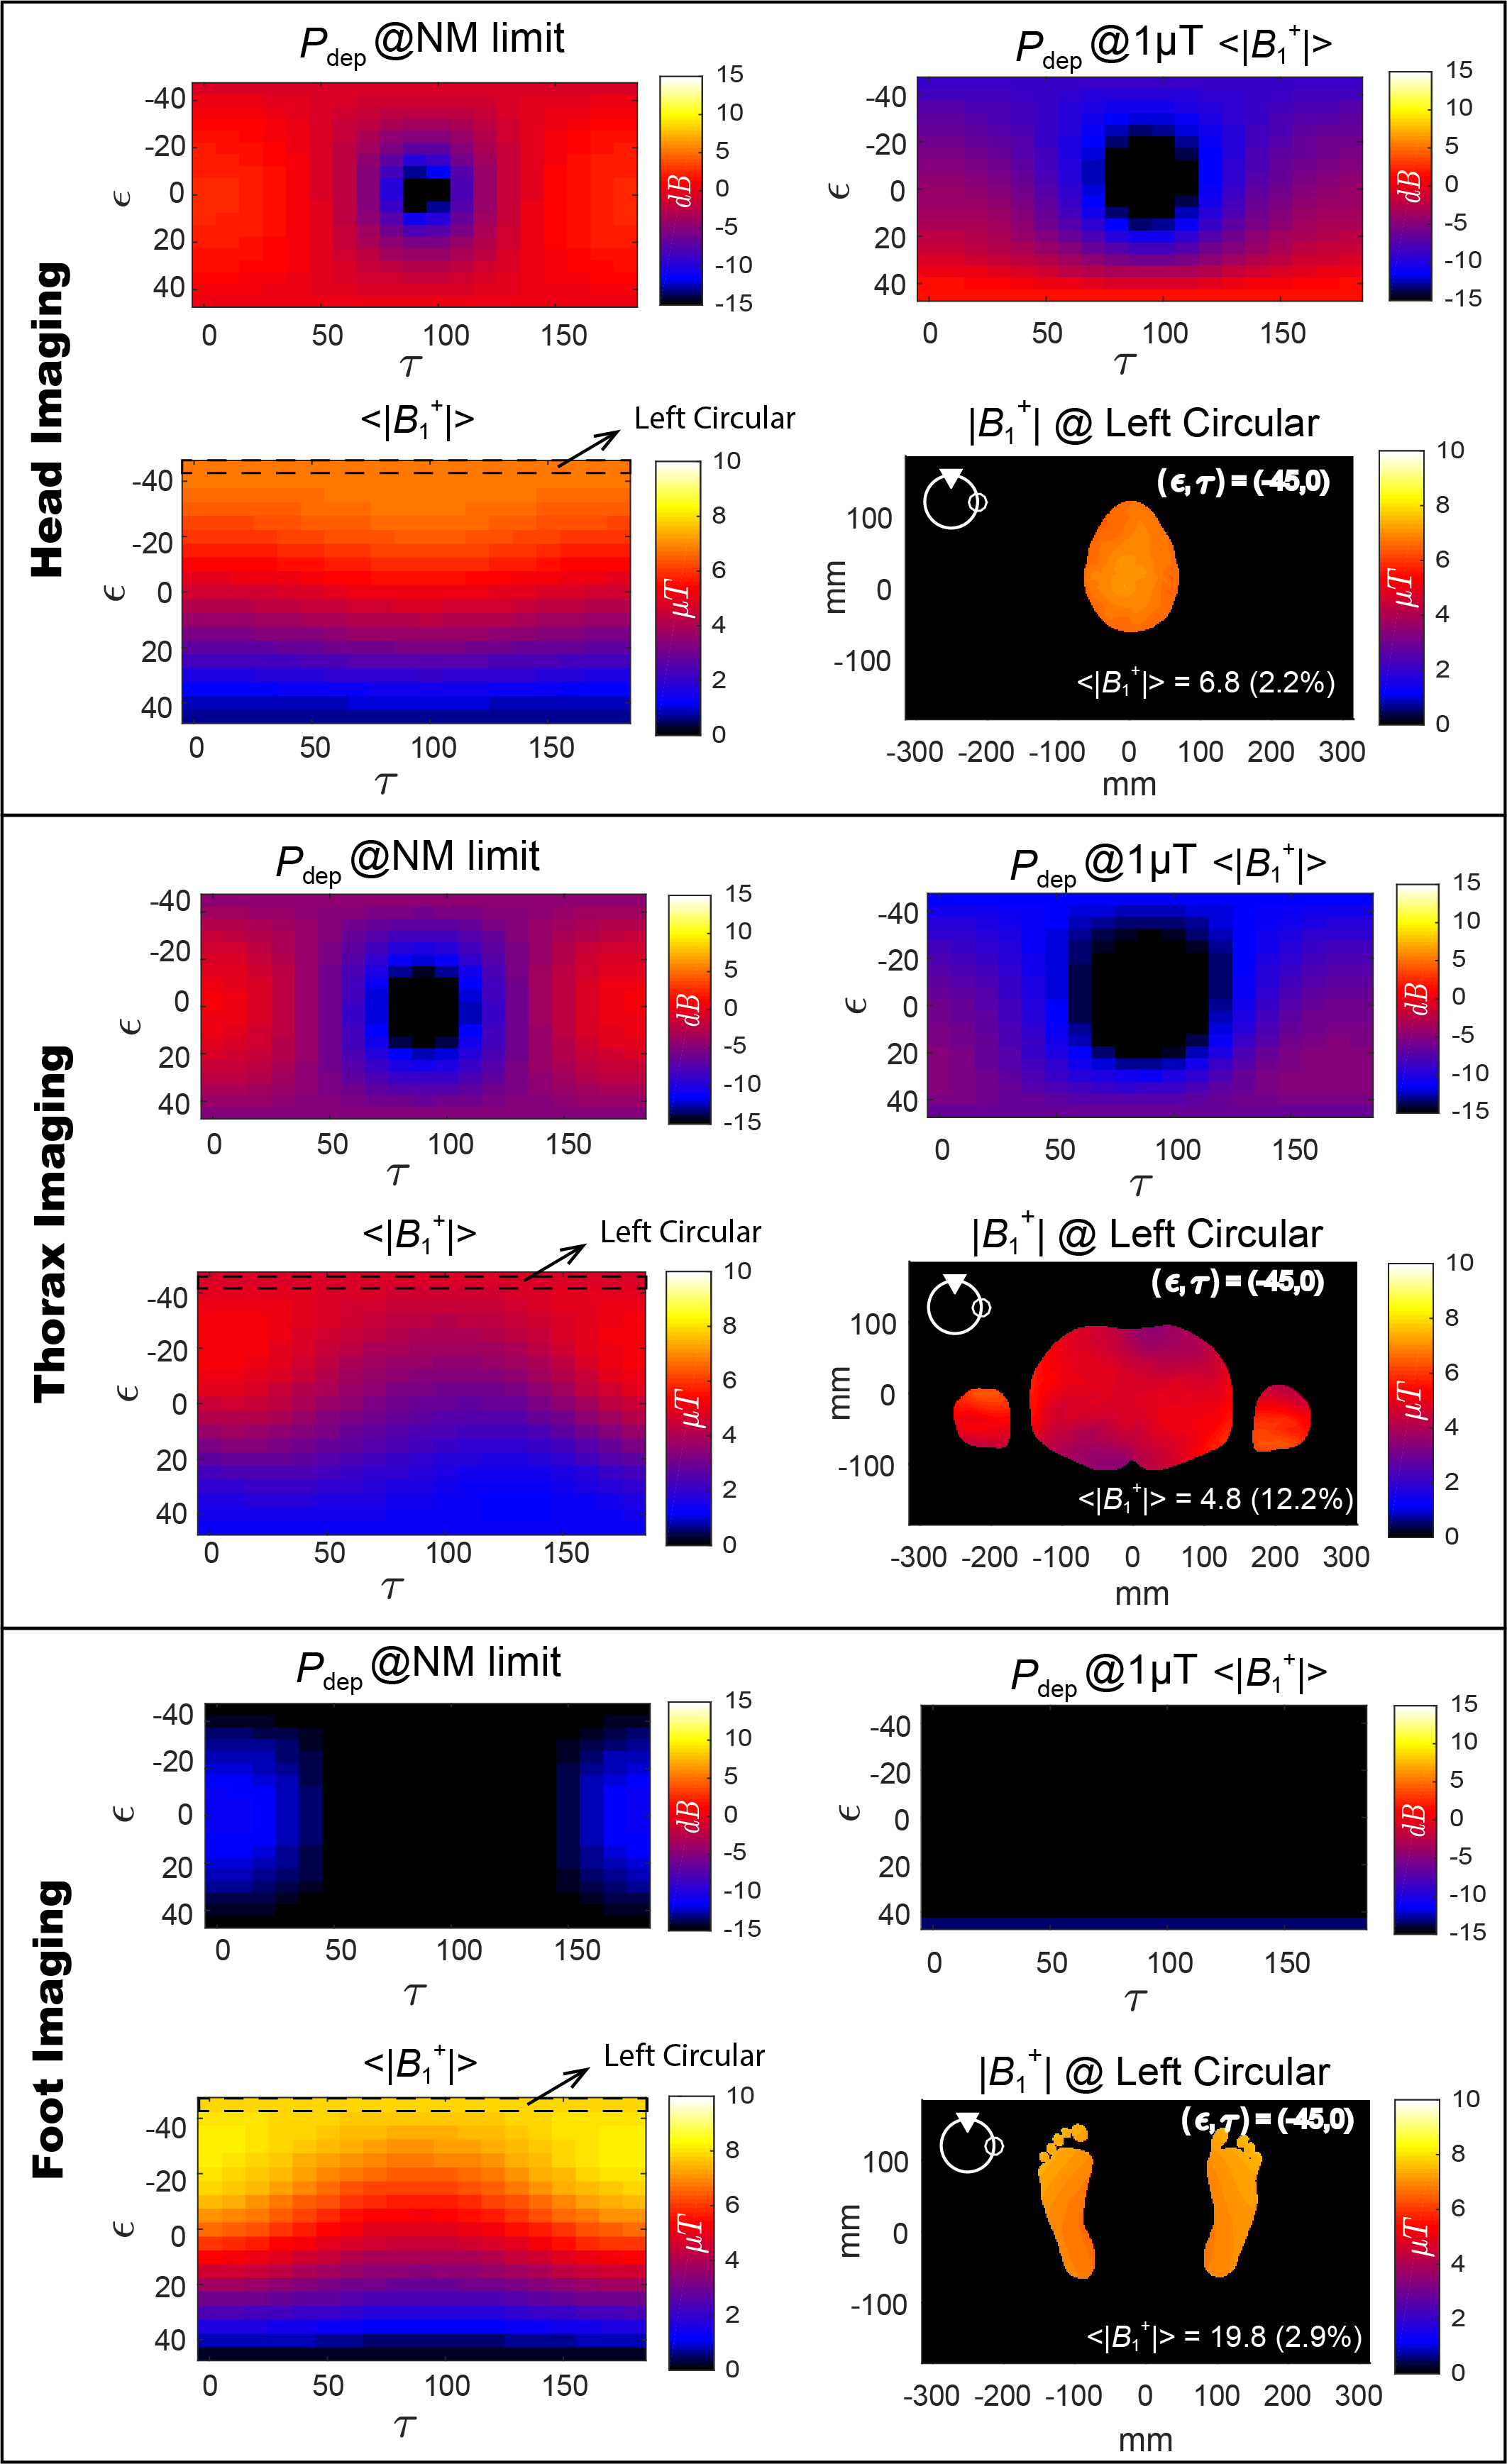
Figure 3 shows the distributions of power deposition of the IUT as a function of B1-polarizations, Pdep(ϵ,τ), evaluated at the normal operating mode SAR limits and at a fixed B1+ level of 1 µT.
Figure 3 also indicates that the circular-polarized B1 guarantees neither maximum <|B1+|> nor minimum Pdep. Therefore, the above set of constraints (1) – (3) is imposed on the output of the trial to identify exposure scenarios that may improve either imaging quality and/or patient safety, while complying with normal operating mode SAR limits.
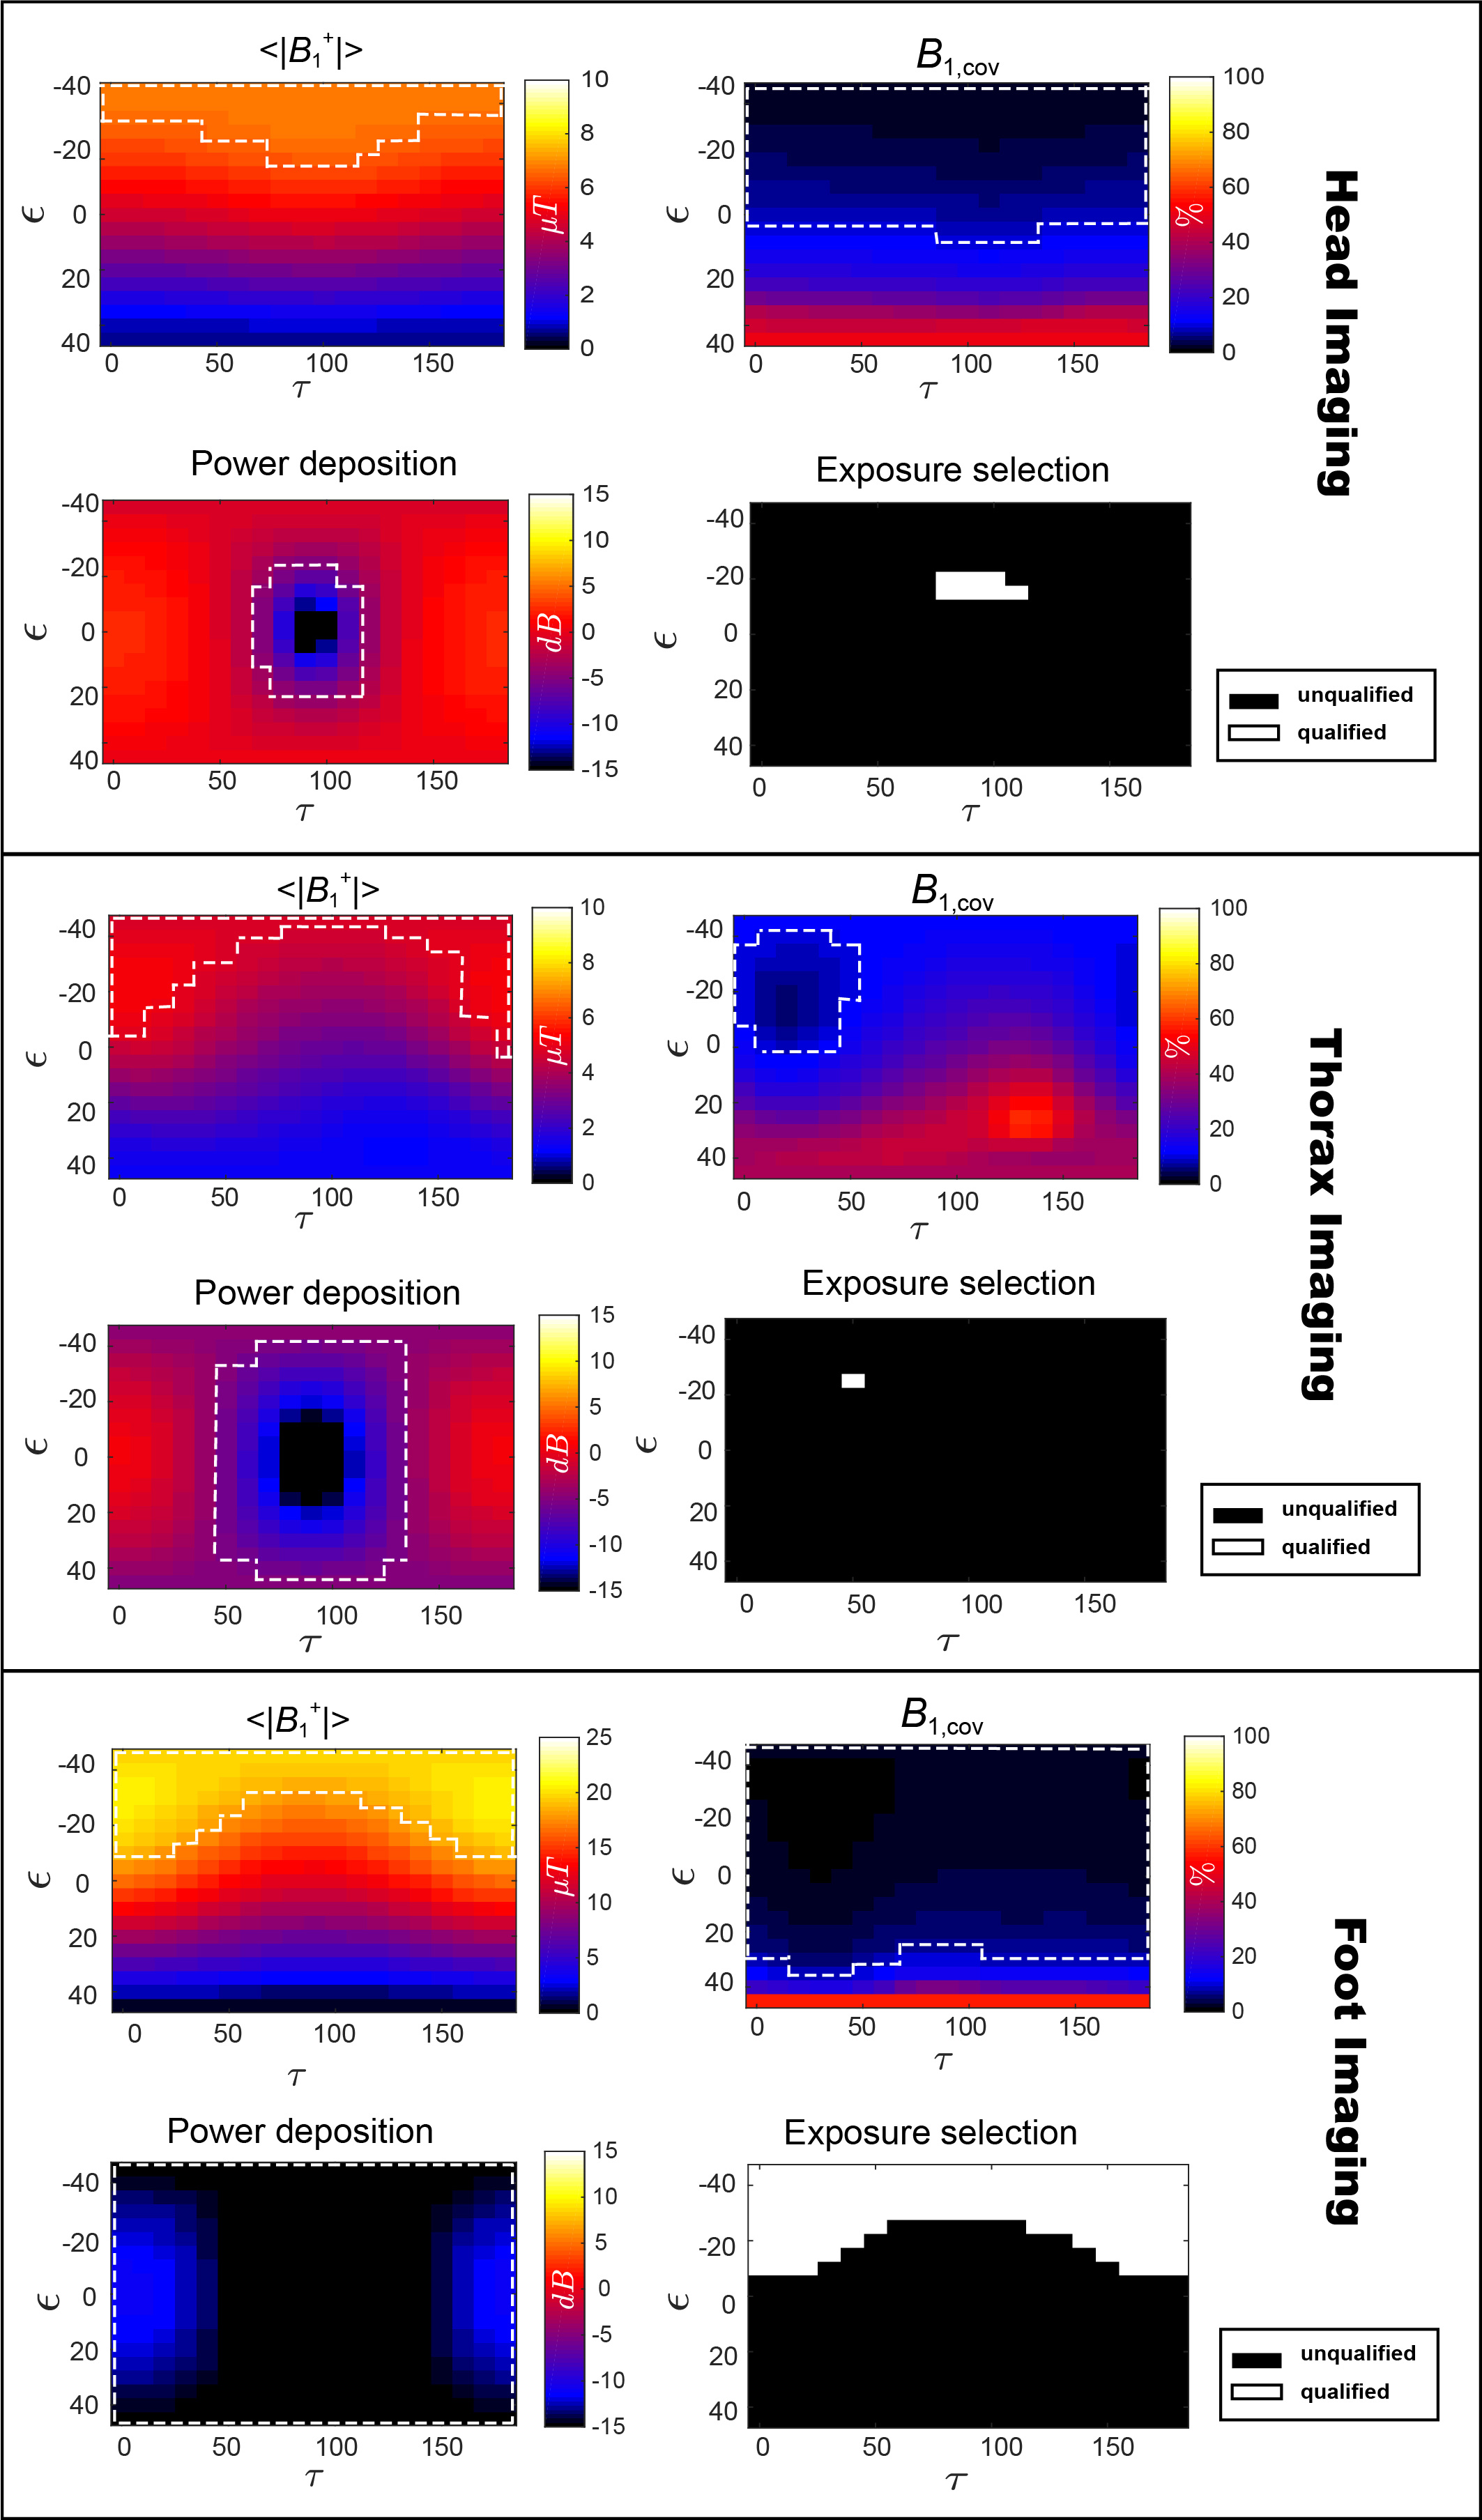
<|B1+(ϵ,τ)|>, B1+,cov(ϵ,τ), and Pdep(ϵ,τ) that satisfy constraints (1) – (3) are enclosed within regions marked by the white dashed lines in Figure 4. The candidate exposures that may further improve scanning of patients equipped with this IUT are identified as intersections of the three qualified regions for each scenario.
Conclusions
Through the establishment of a common data library and analysis tools, large clinical scenarios based on permutations of patients, imaging positions, RF coils, and implant clinical routings can be considered with a clear and traceable digital chain of custody. We provide here an example in silico trial where a subset of the data from the common library was selected for IUT RF-heating evaluation. Further, the established workflow facilitates exploratory data analysis (EDA). EDA was performed on the trial’s output and exposure conditions, where both imaging quality and patient safety can be maximized, were identified.Acknowledgements
No acknowledgement found.References
1.Gosselin MC, Neufeld E, Moser H, Huber E, Farcito S, Gerber L, Jedensjo M, Hilber I, Gennaro F.D, Lloyd B, Cherubini E, Szczerba D, Kainz W, and Kuster N. Development of a new generation of high-resolution anatomical models for medical device evaluation: the Virtual Population 3.0. Phys Med Biol. 2014: 59(18):5287-530.
2 ISO/TS 10974. ISO requirements for the safety of magnetic resonance imaging for patients with an active implantable medical device, 2nd edition, 2018.
3 1.5 and 3T MRI checklist: SureScan pacing, defibrillation, CRT-D and CRT-P systems. 2018. http://europe.medtronic.com/content/dam/medtronic-com/xd-en/hcp/documents/SureScan%20Checklist%20EN.pdf
4. IEC. Medical electrical equipment - particular requirements for the basic safety and essential performance of magnetic resonance equipment for medical diagnosis, 3rd edition. IEC standard 60601-2-33, 2010.
5. Homann H, Graesslin I, Eggers H, Nehrke K, Vernickel P, Katscher U, Doessel O, and Boernert P. Local SAR management by RF shimming; a simulation study with multiple human body models. Magn Reson Mater Phy. 2012: 25(3): 193-204. 6. Kraus JD and Carver KR. Electromagnetics. NewYork: McGraw-Hill, 1973.
Figures