4161
Temperature-based MRI safety assessment with a simplified body model1Radiology, Center for Advanced Imaging Innovation and Research (CAI2R), New York, NY, United States, 2Radiology, Bernard and Irene Schwartz Center for Biomedical Imaging, New York, NY, United States, 3Flywheel Exchange, Minneapolis, MN, United States, 4Radiology, Columbia University, New York, NY, United States
Synopsis
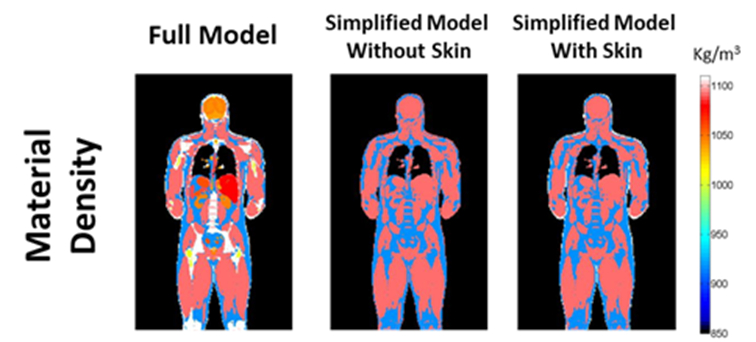
The shape of the patient affects the distribution of the electromagnetic fields used in MRI. Therefore, it is important to run simulations on body models similar to the shape of the patient. While it was previously shown that a simplified model obtained with automatic segmentation tools could be used to perform a safety assessment based on SAR, we investigate through numerical simulations the possibility to perform temperature-safety assessment with a simplified model. We compare the results obtained with a detailed model comprising 35 tissues, one with 3 tissues (lungs, muscle, fat), and one with 4 tissues (lungs, muscle, fat, skin).
Purpose
To evaluate the possibility of performing a temperature-based safety assessment with a simplified body model.Introduction
Absorption of radiofrequency power causes tissue heating, which can be source of discomfort or even tissue damage in an MRI patient. For this reason safety guidelines limit the maximum whole-body and local power absorbed (SAR), and the maximum core and local temperature reached during an MRI exam. SAR and temperature values can be predicted through numerical simulations where the geometry of the system, including patient and coil geometries, is accurately represented. Different human subjects result in different field distributions in the patient, and consequently different SAR and temperature distributions: therefore, it is important to use body models as similar as possible to the shape of the individual patient to have accurate estimations of SAR and temperature. Although a selection of body models of different shapes and ages is available, an actual representation of the body of the specific patient should provide the optimal model for accurate simulations. It was previously shown that automatic segmentation tools can be used with fast MRI sequences to provide a simplified segmented model of the patient where all the tissues have been assigned to three different categories: muscle, fat and lungs1. In the same work, it was also shown that with the simplified segmentation, the SAR distribution was still similar to the one obtained with a model representing many more tissues of the body1. In this work we compare the temperature distributions when a detailed body model and when a simplified body model are simulate within a birdcage coil.Methods
Temperature distributions were computed with a combination of Pennes’ bioheat equation2 with consideration of effects on core body temperature3 and including various physiological responses4. Core body temperature was allowed to depend on many parameters such as whole-body SAR, respiration, perspiration, heat lost by radiation, conduction and convection. Blood perfusion was allowed to vary according to local temperature.Temperature distributions were computed for three different body models: 1) the original body model where all 35 tissues are represented; 2) the simplified model where only 3 tissues are present: muscles, fat and lungs; 3) the simplified model where 4 tissues are present: muscles, fat, lungs and skin (Figure 1). For all the three different models, first an equilibrium temperature with no SAR exposure was computed, and then the SAR from a 16 legs birdcage coil, normalized so that the whole-body SAR is equal to 2 W/kg (maximum allowed normal mode value in safety guidelines), was applied for 1 hour.Results and Discussion
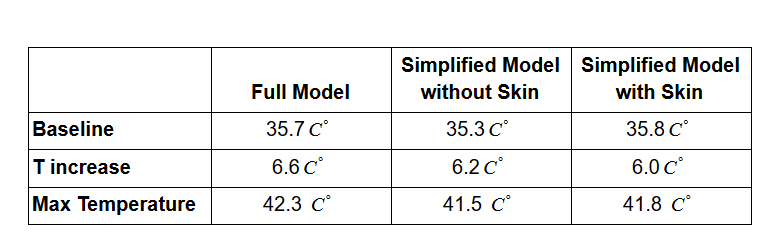
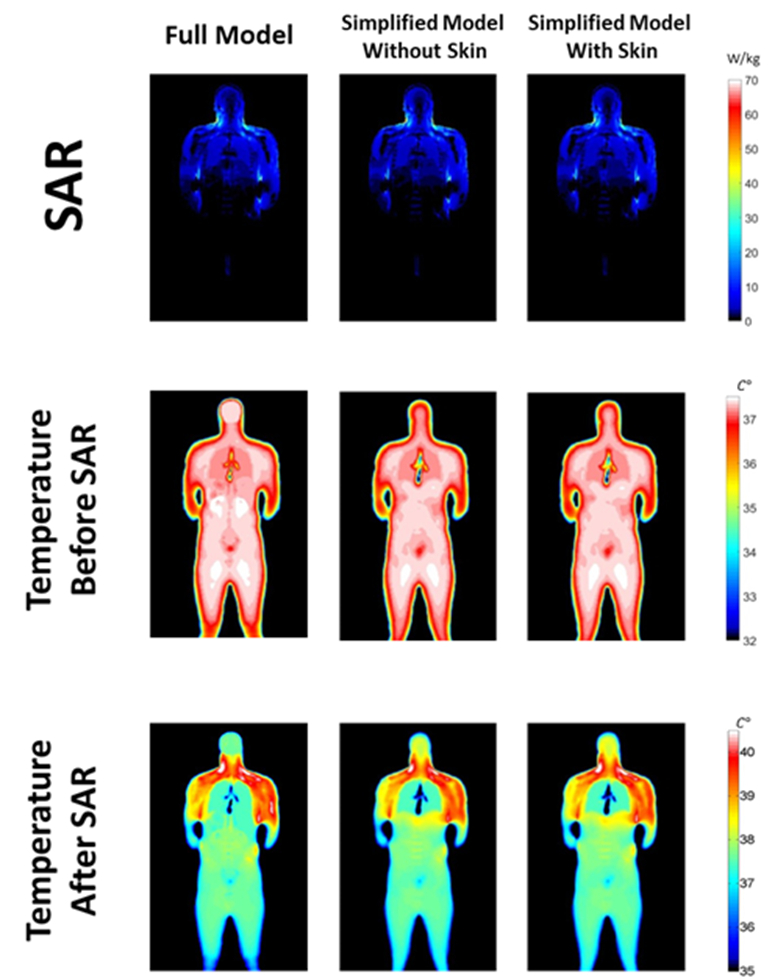
Figure 2 shows the baseline temperature, the temperature increase, and the maximum temperature at the location where the maximum temperature occurs for the three body models. In all three cases, the maximum temperature occured in the shoulder of the patient. Temperature distributions before and after the SAR application are reported in Figure 3. Although temperature distributions are still similar, the simplification of the model affects temperature more than it does SAR. This is mainly due to the impact of physiological parameters on temperature. In fact, while SAR is affected only by electrical properties of the tissues, temperature is also conditioned by thermal properties. In particular, blood perfusion has a significant impact on temperature distribution, especially in brain and other highly-perfused tissues. We found that automated addition of a thin layer of skin helps to increase temperature in the extremities to bring them closer to the values in the original model. Although baseline value is lower in the simplified models, lower average perfusion causes faster temperature rise in the simplified model, especially in the brain.Conclusions
Simplified models can be used for patient-specific MRI safety assessment based on temperature. In future work, incorporation of many readily-available tools for identifying and segmenting brain should increase accuracy of automatically-segmented models further.Acknowledgements
This work has benefitted from funding by the National Institutes of Health through NIH P41 EB017183 (CAI2R)References
1.Homann H, Börnert P, Eggers H, Nehrke K, Dössel O, Graesslin I. Toward individualized SAR models and in vivo validation. Magnetic resonance in medicine. 2011 Dec;66(6):1767-76.
2.Pennes HH. Analysis of tissue and arterial blood temperatures in the resting human forearm. Journal of applied physiology. 1948 Aug 1;1(2):93-122.
3.Adair ER, Berglund LG. On the thermoregulatory consequences of NMR imaging. Magnetic resonance imaging. 1986 Jan 1;4(4):321-33.
4.Carluccio G, Bruno M, Collins CM. Predicting long‐term temperature increase for time‐dependent SAR levels with a single short‐term temperature response. Magnetic resonance in medicine. 2016 May;75(5):2195-203.
Figures