4157
Repeatability of FDTD simulations for determining local SAR and B1+ distributions for UHF abdominal imaging.1SPMIC, Physics, University of Nottingham, Nottingham, United Kingdom, 2University of Nottingham, Nottingham, United Kingdom
Synopsis
This study assessed the repeatability of FDTD simulations used to calculate local specific absorption rate (SAR) and B1+ distributions for abdominal imaging on a 7T (UHF) parallel transmit (pTx) system when subjected to typical small displacements of the an eight channel transmit dipole body array experienced when repositioning subjects. Simulations were repeated on two subject-based models and the maximum local 10g averaged SAR (SAR10g,av), B1+ distributions and scattering matrices (S-matrices) were compared to assess variation. The consequences that this has for MR safety, RF shimming and coil loading is discussed.
Introduction
The electromagnetic (EM) fields produced by individual
transmit elements vary spatially and temporally on a pTx system [1] and can interact
with each other in a way that leads to unexpected SAR10g,av hotspots
and inhomogeneous B1+ distributions. It’s not possible to predict these distributions
analytically, therefore numerical methods are employed to simulate them when
assessing the safety of abdominal imaging at UHF.
Typically, simulations are run with a body
array in a fixed position [2] using a pre-defined body model [3]. However, in
real life the body array (and subject) do not always remain in the same
position throughout the scan session due to respiration [4] and movement. In
addition, the coil position will vary between separate scan sessions (see Figure
1). As such, investigating how sensitive the SAR10g,av results are
to realistic displacements will give insight into the repeatability of maximum SAR10g,av
and increase confidence in the values that ordinarily form the final limit for
safety protocols. This study looked at the repeatability of SAR results when
the body array is displaced in five separate simulations for two different subject-based
models.
Methods
Simulations were performed using REMCOM XFdtd
software (v7.7.1) with a NVIDIA GPU (Titan Xp). Optimised gridding was used with
a minimum [maximum] cell size of 3.4x1.8x0.4 [7.8x7.9x22.8] mm3.
Simulations were run to a convergence of -30 dB and took approximately 20
minutes per transmit element. A broadband excitation waveform was used. Each
simulation was scaled to 1 W input power per transmit channel for SAR
calculation and the B1+
fields were scaled to 3W input power per channel to match the maximum available
power allowed experimentally.
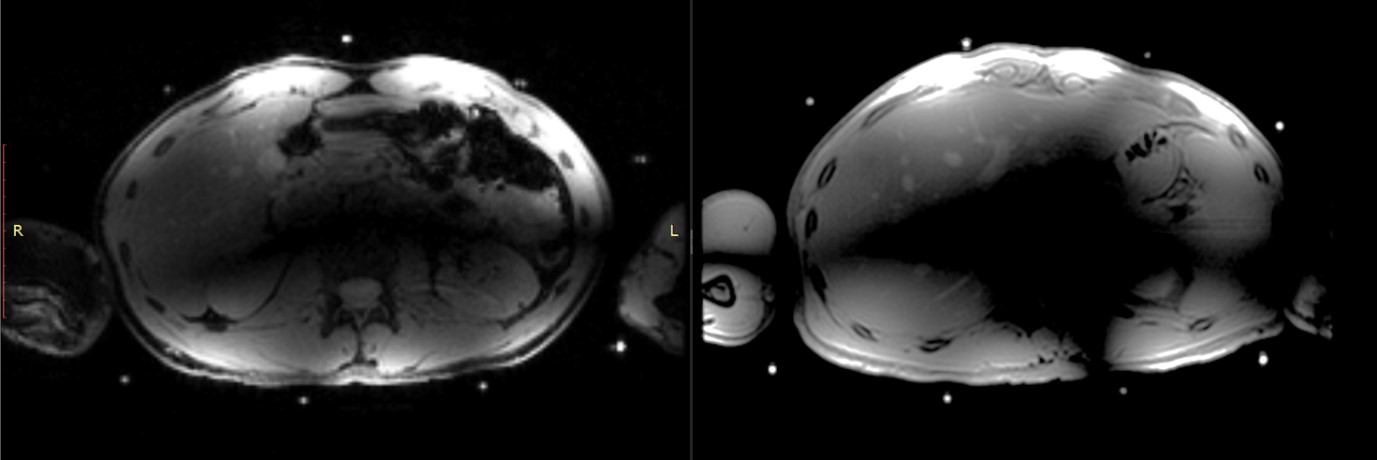
One male and one female on a 3T Philips
Ingenia system using mDIXON acquisition and images were manually segmented into
different tissue types using Analyze software. These were labelled and
constructed into 3D body models (resolution 1.5x1.5x5 mm3) encompassing
the torso and arms of each subject in Matlab, then imported into the EM
software.
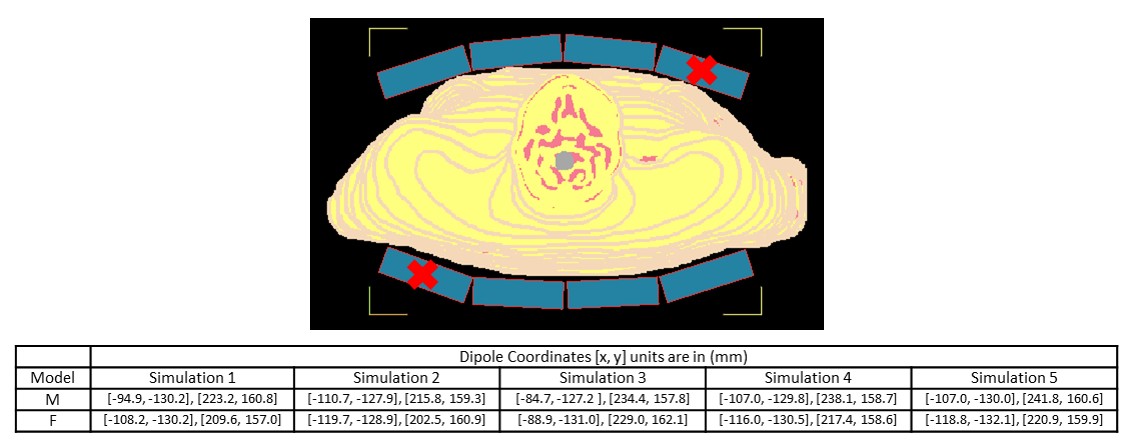
A wire-based model [5] was
used to simulate an 8TX/32RX fractionated dipole array (MRCoils). Simulations were performed with each model to
generate EM fields from individual transmit elements, and were repeated four
times with the body array displaced in ±x directions and conformed around the
body at the new position. The EM fields and additional information were
exported to Matlab to calculate the SAR10g,av and B1+ profiles for the worst-case scenario where all
fields are in-phase and there is maximum constructive interference. S-matrices
were also exported for each simulation. An example of a simulation is shown in
Figure 2(a) and array displacements are summarised in Figure 2(b).
Results
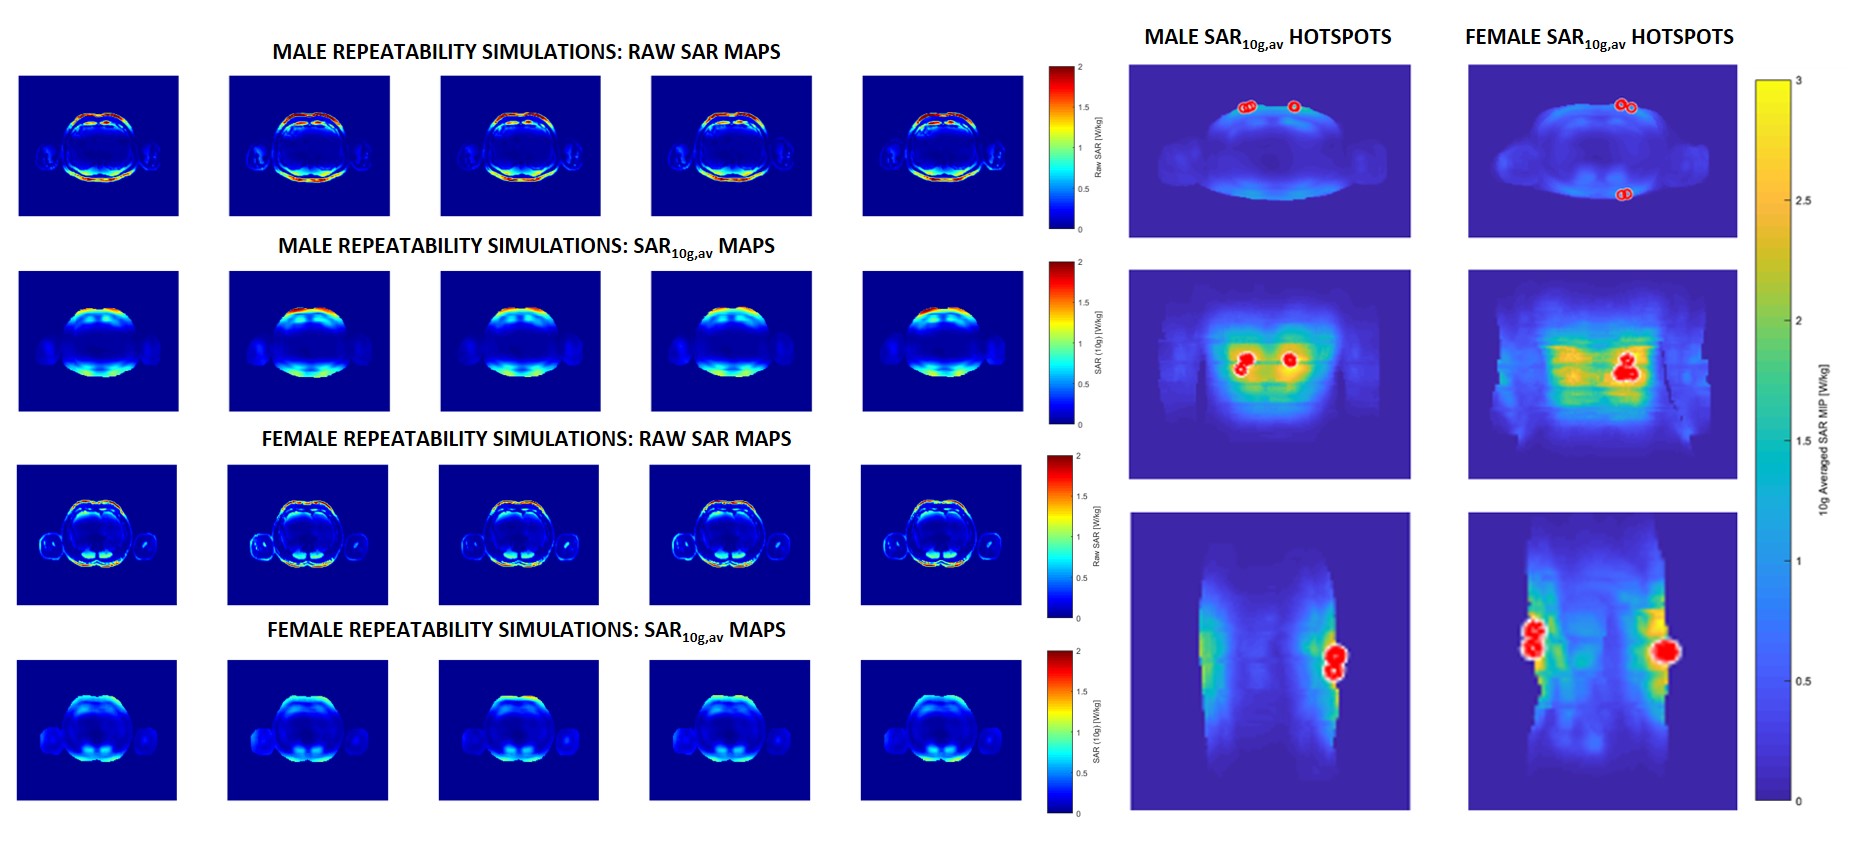
Figure 3(a)
shows the final SAR results from each simulation. Figure 3(b)
shows the location of the SAR10g,av hotspots from each simulation as
they varied. The mean maximum SAR10g,av value was 2.0±0.3Wkg-1
(16% variation) and 1.2±0.1Wkg-1 (13% variation) for male/female
simulations respectively. For the location of the hotspot in each model the
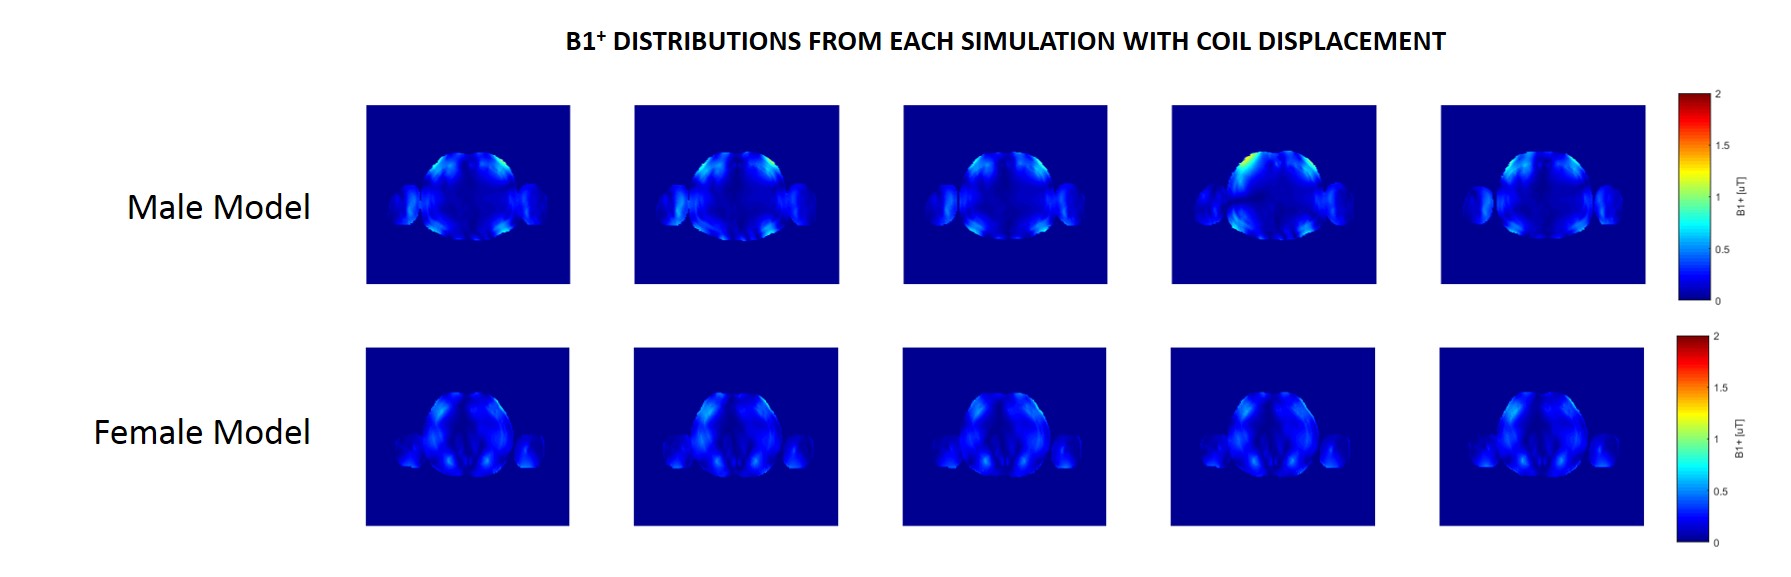
other models were all within 15% of their maximum SAR10g,av value. Figure 4
displays the B1+ in the slice containing
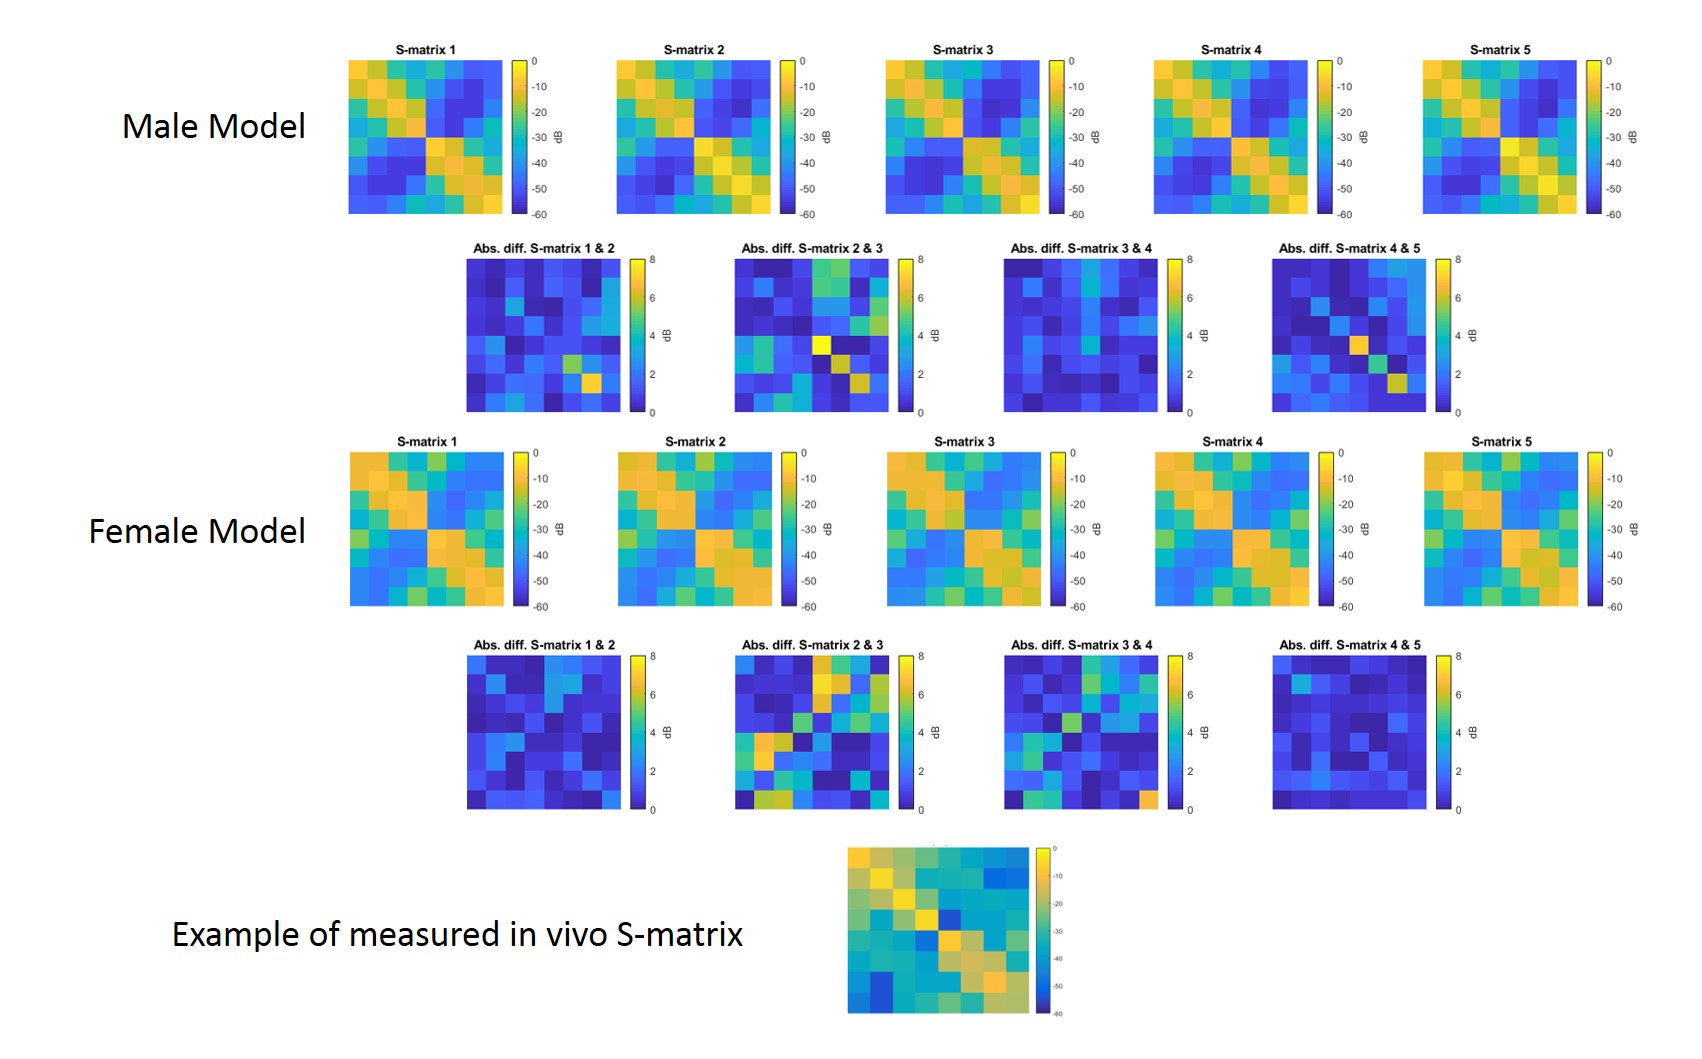
the maximum SAR10g,av value. Figure 5 shows the S-matrices from each
simulation and the absolute difference matrices showing the change between
consecutive simulations. The maximum coupling differences for each simulation
were 8.2 and 7.3dB.
Discussion and Conclusion
The SAR results showed good repeatability except for the changes in location of the SAR10g,av hotspots. This is to be expected if the array was reoriented around the geometry of each body model. The variation in maximum SAR10g,av values due to array displacement suggests that repeatability should be taken into account as an additional safety factor [6] when performing SAR assessments based on FDTD simulations. The B1+ profiles didn’t vary significantly between each simulation, although intensity did increase on the model surface in some cases where the array was repositioned. The similarity of B1+ interference patterns provides confidence that RF shimming calculations are robust against small movements. The maximum differences in S-matrices implies there is limited variation in coupling between array movements and the loading of the body array is not significant. The variation in the S-parameters due to array movement are nonetheless much larger than changes due to physiological motion measured by Hess et al, and Jaeschke et al [7, 8].Acknowledgements
We gratefully acknowledge the support of NVIDIA Corporation with the donation of the Titan Xp GPU used for this research.References
- Padormo et al. Parallel transmission for ultrahigh-field imaging, NMR Biomed. 2015
- Raaijmakers et al. The Fractionated Dipole Antenna: A New Antenna for Body Imaging at 7 Tesla, MRM. 2016;75:1366-1374
- Homann et al. Toward Individualized SAR Models and In Vivo Validation, MRM. 2011;66:1767-1776
- Doran et al., Effects of Respiration on B1+ and SAR in Whole-Body Imaging at 7 Tesla, In Proc. ISMRM (Paris). 2018
- Bawden et al. Electrical lengthening to improve electromagnetic simulations and SAR calculations of meandered body dipole elements at 7 T, In Proc. ISMRM (Paris). 2018
- Le Garrec et al. Probabilistic Analysis of the Specific Absorption Rate Intersubject Variability Safety Factor in Parallel Transmission MRI, MRM. 2017;78:1217-1223
- Hess et al. Diaphragm Position Can Be Accurately Estimated From the Scattering of a Parallel Transmit RF Coil at 7 T, MRM. 2018;79:2164-2169
- Jaeschke et al. Cardiac Gating Using Scattering of an 8-Channel Parallel Transmit Coil at 7T, MRM. 2018;80:633-640
Figures