4154
Assessment of the Alleviating Impact of Perfusion on RF-induced Heating due to Artificial Cardiac Valves1Center for Image Sciences, UMC Utrecht, Utrecht, Netherlands, 2Department of Biomedical Engineering, Eindhoven University of Technology, Eindhoven, Netherlands
Synopsis
Artificial cardiac valves or stents can cause
Introduction
Cardiac MRI for patients with ischaemic heart disease and high stroke risk is a valuable contributor to diagnosis, guiding clinical decision making and improving risk stratification. This patient group often also has a cardiac implant. Implants can pose a contraindication for MRI because of associated safety hazards. One of the safety hazards is RF induced heating. The radio frequency fields produced by the MRI system can couple with the implant. This can locally increase the power that is deposited in the tissue, creating temperature hotspots.
Current implant safety assessments, by manufacturers and in literature, are done with homogeneous gel phantoms. For artificial cardiac valves these studies report temperature increases ranging from 0°C to 1.6°C, with the largest difference between background temperature and implant temperature being 0.3°C.1-5 However, these studies ignore perfusion and blood flow. The blood acts as an efficient cooling mechanism because the heat is transferred throughout the body. Since these implants are partially in contact with blood we expect that RF heating is not a safety hazard.
Methods
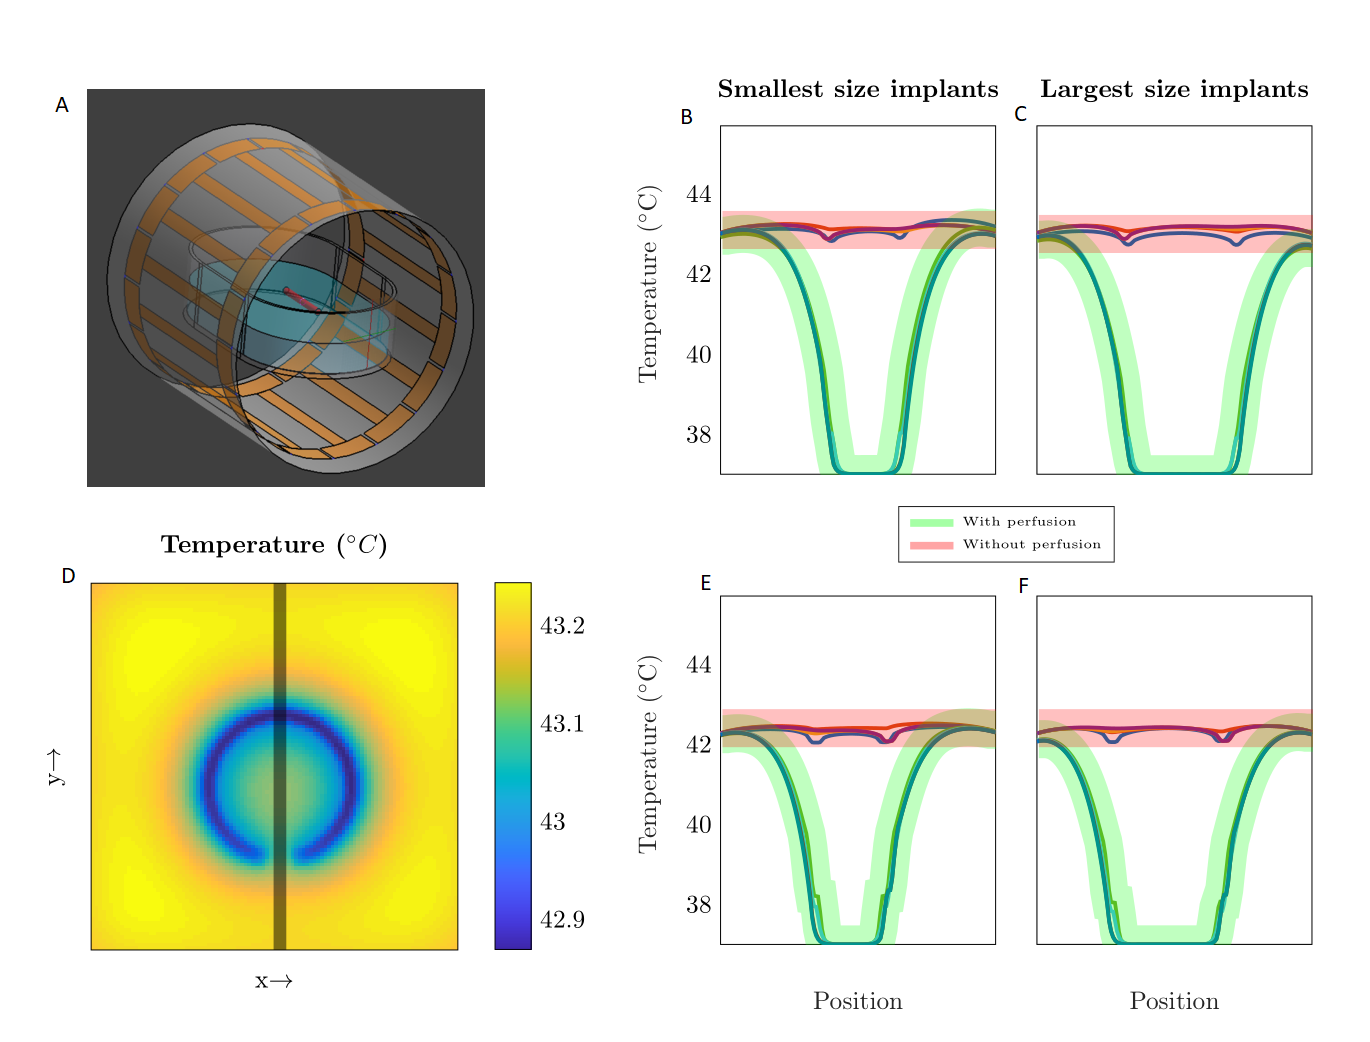
The cooling effect of blood on RF induced heating by artificial cardiac valves was assessed by numerical simulations at 1.5T with and without perfusion using Sim4Life (ZMT,Zurich,CH). For the electromagnetic simulations, a birdcage body coil was used for transmitting. The produced electric field was the source for the thermal simulations.
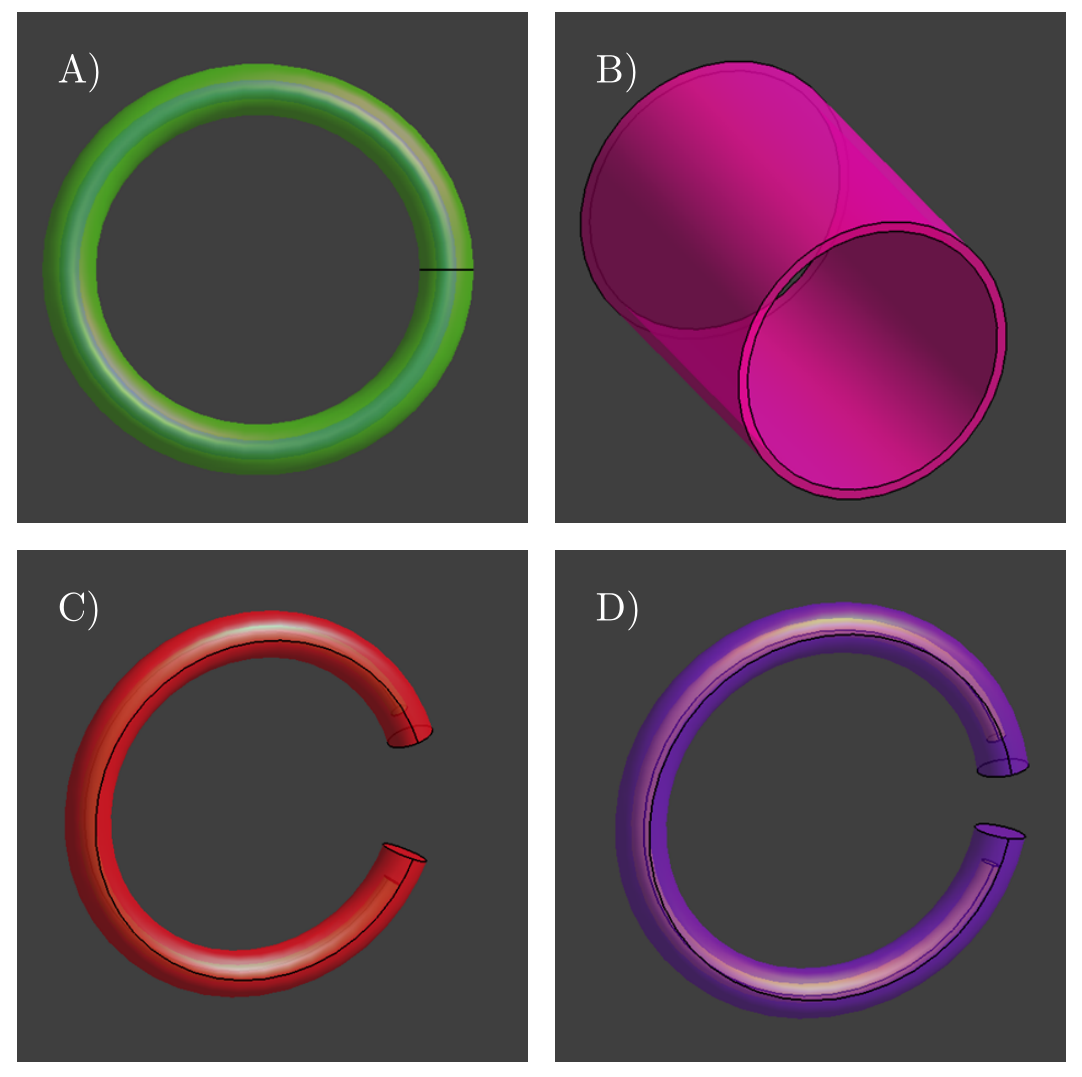
Four valve- or stent-like structures were simulated: a ring, a C-shaped ring with a small and large gap and a stent replacement6 (Figure 1). First, the structures are simulated in a homogeneous gel phantom filled with Hydroxyethyl Cellulose gel, relative permittivity=77 and conductivity=0.35S/m. The effect of blood flow was simulated by defining a cylindrical region within the implant with a high perfusion (10 L/kg min-1). Furthermore, the implants were simulated in two orientations: axis parallel to the $$$B_0$$$-field (similar to placement orientation inside patients) and axis orthogonal to the $$$B_0$$$-field (capturing more flux). The electric and magnetic fields were scaled with the input power to a $$$B_1^+$$$ magnitude of 3$$${\mu}T$$$. This value for $$$B_1^+$$$ corresponds to 30$$${\mu}T$$$ at 1% duty cycle, while normally at 1.5T a 10$$${\mu}T$$$ $$$B_1^+$$$ and a 1% duty cycle can be expected. The scaling was exaggerated to demonstrate the effectiveness of perfusion. For the thermal simulations 9 min of constant RF was simulated (Steady-state was reached between 2-3mins).
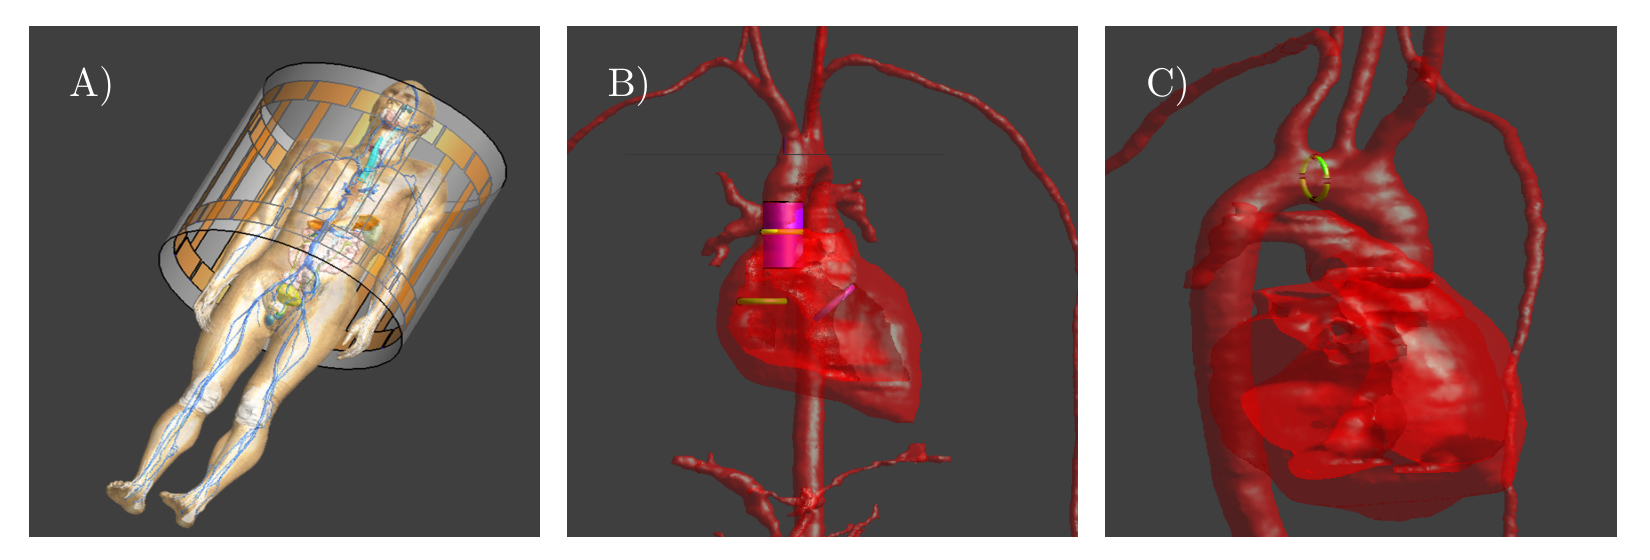
Afterwards, the same cardiac implants were placed in a human model, Duke (virtual family, IT'IS), Figure 2. Likewise, thermal simulations were performed with and without perfusion.
To remove all doubt a new extremely conservative situation was simulated where the cardiac valve was replaced by a resonant ring inside Duke, Figure 2. The ring was made resonant using four capacitors, (~450pF). The high required capacity demonstrates that natural resonance for these sizes of cardiac implants is not feasible at 1.5T. This was used as a worst-case scenario. If blood flow can cool such a structure to safe temperatures then any realistic structure is safe too.
Results & Discussion
Figure 3 shows line profiles through the implants taken from the thermal simulations done with the HEC filled phantom. Each graph shows the temperature with perfusion (green) and without perfusion (red). It is seen that the perfusion introduced by the tube through the implant cools the implant significantly, up to 6°C. This holds for all scenarios.
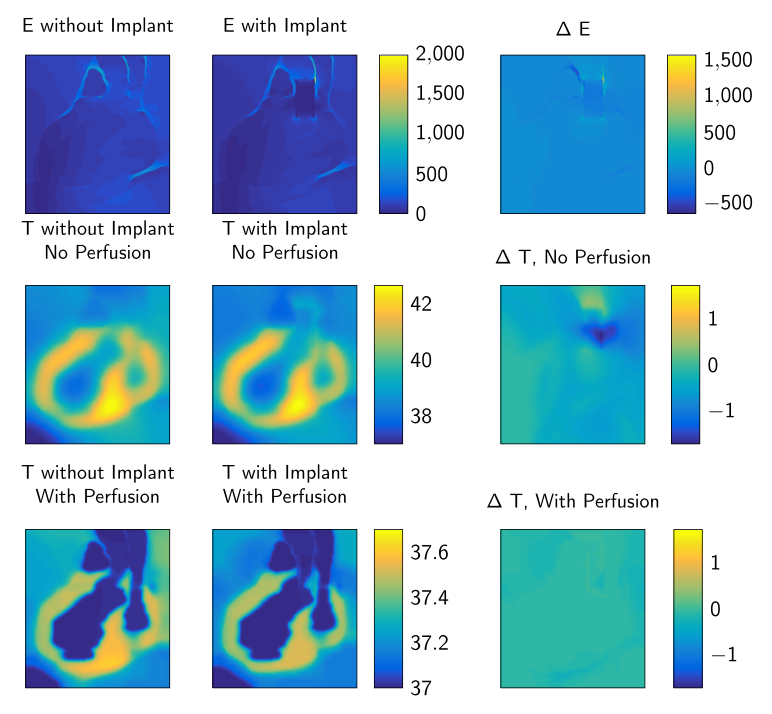
Figure 4 shows the electric field with and without an implant present. As can be seen by the difference plot the implant creates a peak in the electric field in one of the arteries. Furthermore, the temperature distributions with and without perfusion are shown. They show that the temperature peaks in the heart muscle and not near the implant.
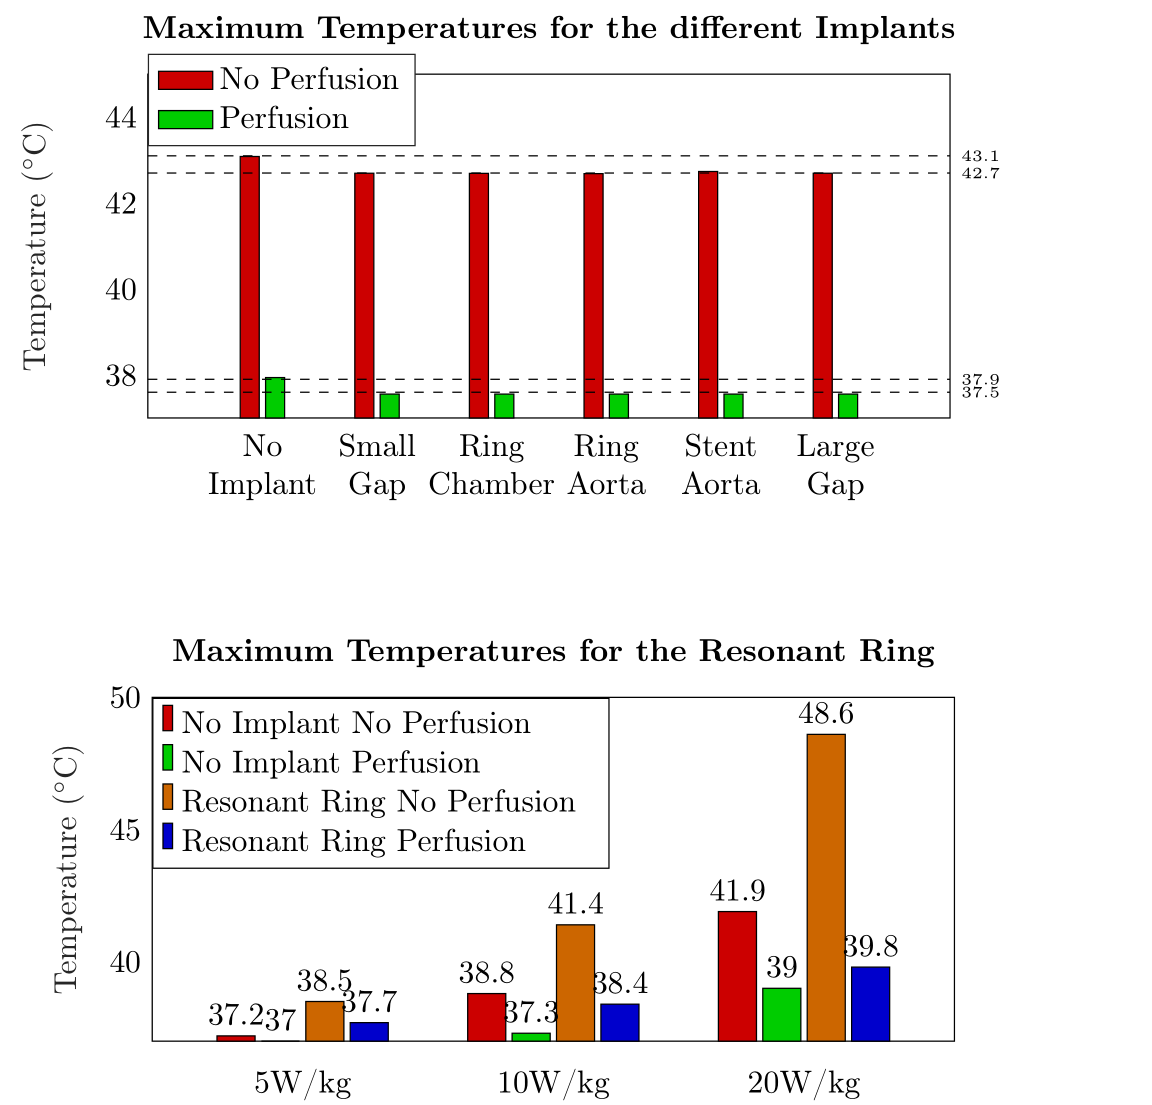
Figure 5 shows the maximum temperatures in the entire domain taken from the thermal simulations done with Duke. Again it is clear that perfusion is an excellent cooling mechanism. Furthermore, it is shown that for a high global SAR level (5 W/kg), neither of the four situations realizes a hazardous temperature rise. For the higher SAR values the strong impact of perfusion on the temperature can be observed. This shows that RF safety assessments of cardiac valves result in a severely overestimated temperature increases if the perfusion is not considered.
Conclusion
For passive cardiac implants, not taking perfusion into account severely overestimates the RF induced heating. The perfusion acts as a very efficient cooling mechanism. When perfusion is taken into account none of the implants studied in this work poses a safety hazard with respect to RF heating; not even a resonant ring for a high global SAR level (5W/kg).Acknowledgements
The project was funded by The Netherlands Organisation for Scientific Research (NWO) under project number: 15739References
1. M.-B. Edwards, K. M. Taylor, and F. G. Shellock, “Prosthetic heart valves: Evaluation of magnetic field interactions, heating, and artifacts at 1.5T”, Journal of Magnetic Resonance Imaging, vol. 12, pp. 363-369, 2000.
2. F. G. Shellock and V. J. Shellock, “Metallic stents: Evaluation of mr imaging safety”, American Journal of Roentgenology, vol. 173, 1999.
3. D. Pruefer, P. Kalden, W. Schreiber, M. Dahm, M. Buerke, M.Thelen, and H. Oelert, “In vitro investigation of prosthetic heart valves in magnetic resonance imaging: Evaluation of potential hazards”, The Journal of Heart Valve Disease, vol. 10, 2001
4. F. G. Shellock and S. M. morisoli, “Ex vivo evaluating of ferromagnetism, heating, and artifacts produced by heart valve prostheses exposed to a 1.5-T mr System”, Journal of Magnetic Resonance Imaging, vol. 4, pp. 756-758, 1994.
5. M. Saeedi, A. Thomas, and F. G. Shellock, “Evaluation of mri issues at 3-tesla for a transcatheter aortic valve replacement (tavr) bioprosthesis”, Journal of Magnetic Resonance Imaging, vol. 33, pp. 497-501, 2015.
6. D. Santoro, L. Winter, A. Müller, J. Voigt, W. Renz, C. Özerdem, A. Grässl, V. Tkachenko, J. Schelz-Menger and T. Niendorf, “Detailing Radio Frequency Heating Induced by Coronary Stents: A 7.0 Tesla Magnetic Resonance Study.” Public Library of Science, Vol.7(11), 2012.
Figures