4153
SAR and temperature distributions in a database of realistic human models for 7T cardiac imaging1Image Sciences Institute, University Medical Center Utrecht, Utrecht, Netherlands, 2Biomedical Image Processing, Eindhoven University of Technology, Eindhoven, Netherlands
Synopsis
A database of 10 realistic human models was generated to study inter-subject local SAR variation for a 7T cardiac coil array. 10 volunteers were scanned at 1.5T after which DIXON imaging data was segmented in five tissue types. SAR and temperature rise were simulated for these models and 10,000 random phase settings. With 99.9% confidence the local SAR levels will not surpass 3.32 W/kg for 8x1 W input power and after 6 minutes of exposure, the maximum temperature rise is 0.19 ⁰C (99.9% confidence). For 20 seconds of exposure (long
Introduction
The improved signal-to-noise ratio at 7T allows for cardiac imaging at increased resolution as compared to 1.5T or 3T1–3. Cardiac imaging at 7T is commonly performed with a local transmit array, consisting of multiple phase/amplitude controlled transmit channels. To ensure that local SAR limits are not exceeded, average power limits per channel are typically derived from finite difference time domain (FDTD) simulations on generic human models. To account for inter-subject variability, an additional safety factor needs to be taken into account which ensures that SAR limits are never exceeded but which often leads to overly conservative power limits. In this work, a database of multiple human models is generated for a 7T cardiac array3 to calculate peak SAR levels while considering intersubject variability4. Additionally, the database is used to calculate potential temperature rise in a typical cardiac imaging exam.Methods
After obtaining IRB approval, 10 subjects (age: 25-54, BMI: 18-26) were scanned on 1.5T (Philips Ingenia, Philips Healthcare, Best The Netherlands) with a mockup array in place for realistic body deformation. A multi-echo DIXON scan (TR/TE1/TE2 = 5.56/1.64/3.76ms, resolution 1.7x1.7x2.5mm3) was acquired to calculate water, fat, in-phase and out-phase images which were segmented into 5 tissue types (fat, lung tissue, muscle and skin). The resulting segmentations were imported in Sim4Life and realistic material properties were assigned to the tissues5. A model of a 7T dipole/loop-array3 for cardiac imaging was imported and simulated in Sim4Life. 10g averaged Q-matrices and virtual observation points were calculated for every model. An online available temperature solver was used to solve Pennes Bioheat Equation for every entry of the Q-matrix to calculate temperature VOPs6,7. Pennes Bioheat equation was solved for a total heating time of 20 and 360 seconds, which correspond to an upper-limit breath-hold time, and the conventional averaging time in safety guidelines8 where temperature equilibrium has been realized. The temperature and SAR VOPs were used to calculate local peak SAR and peak temperature rise for a total of 10,000 drive vectors with equal input power (1 W per channel) and random phase. Gamma-distributions were fitted to the resulting data, and were used to calculate peak SAR and temperature rise levels which are not exceeded in 99,9% of the scans.Results
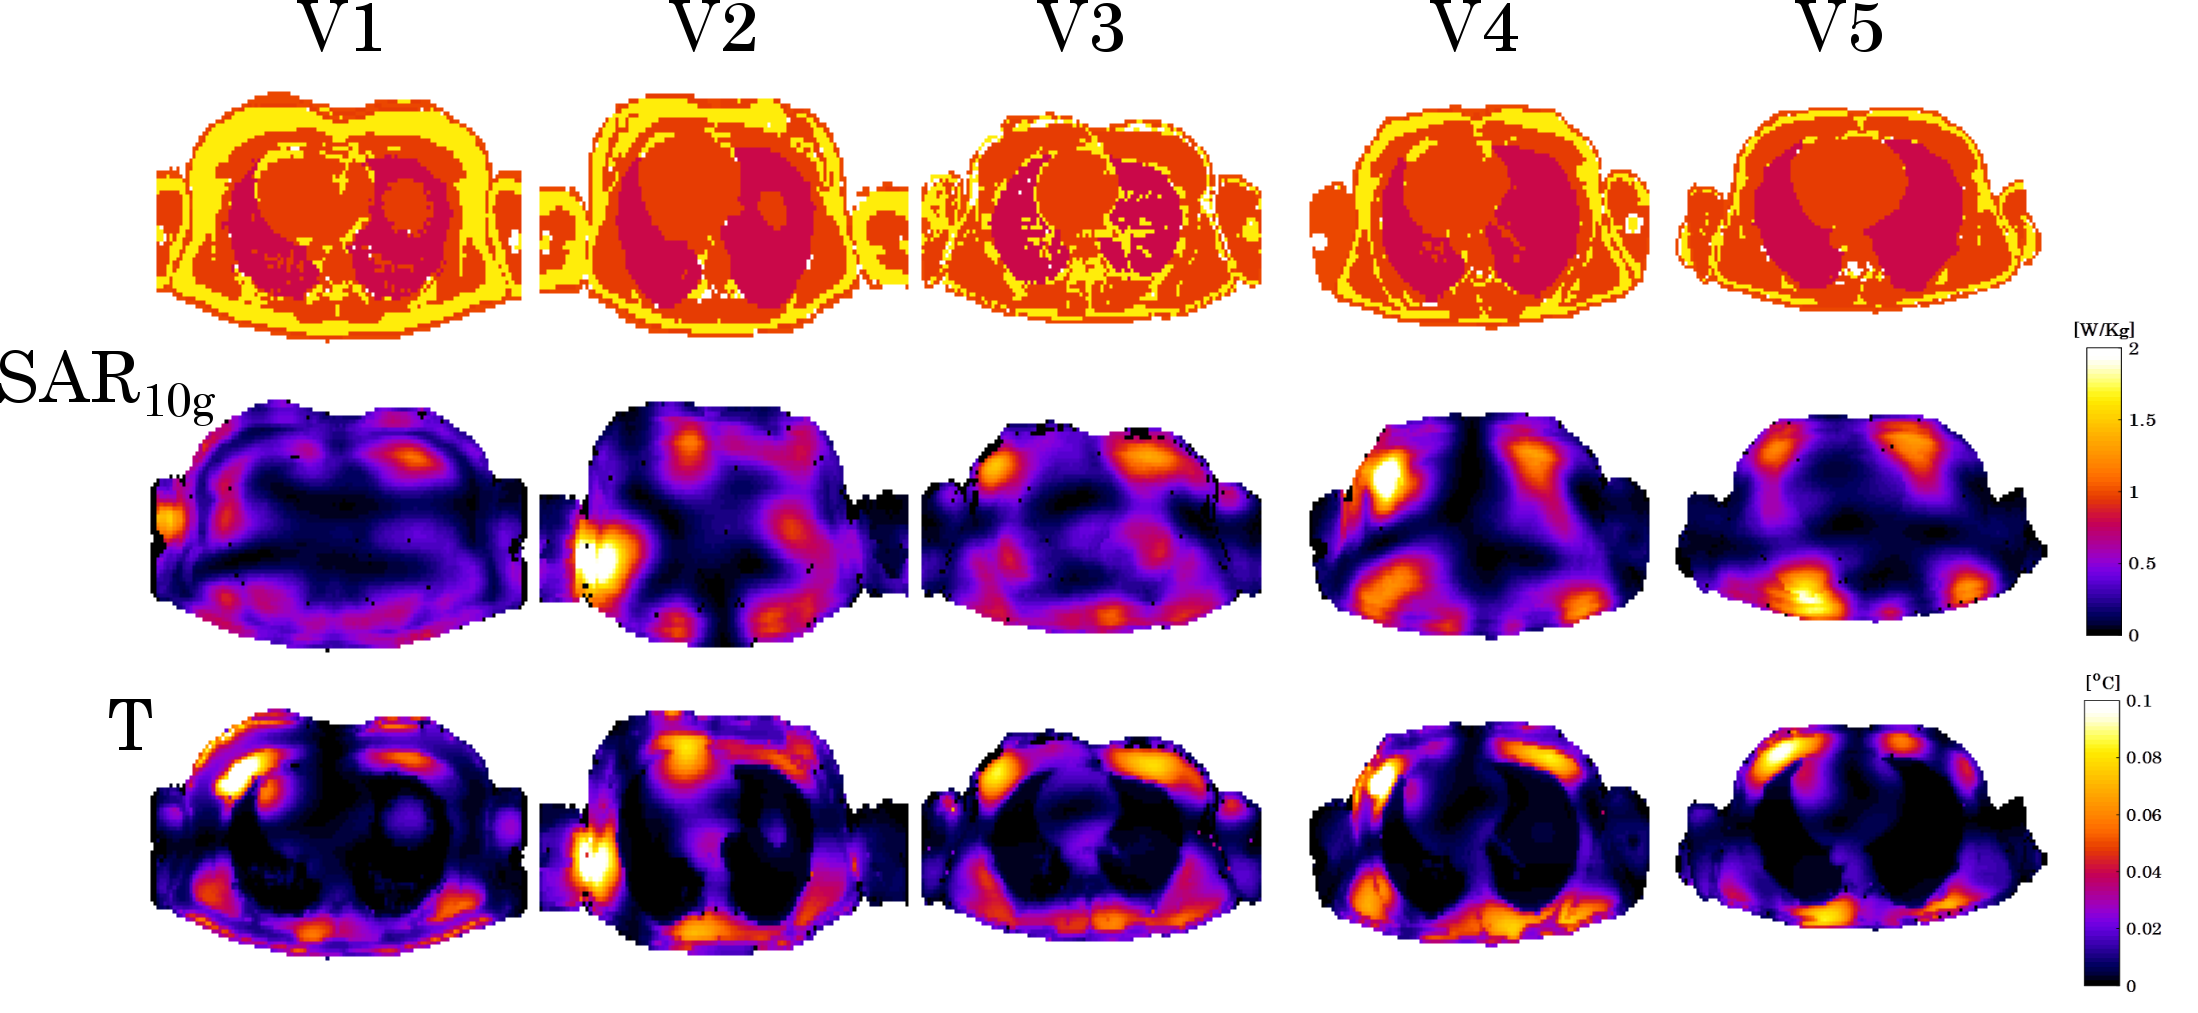
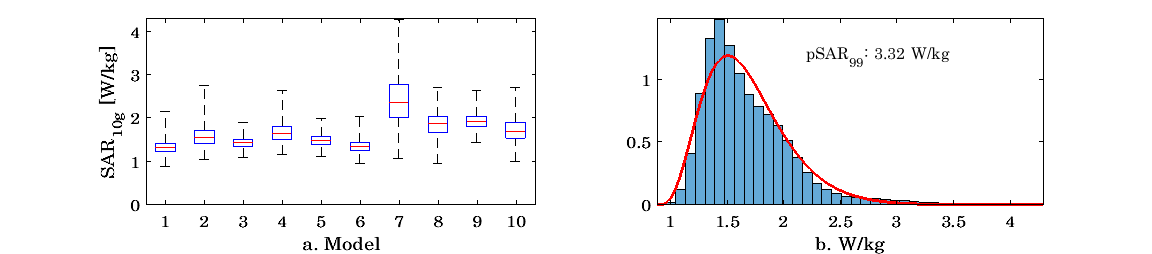
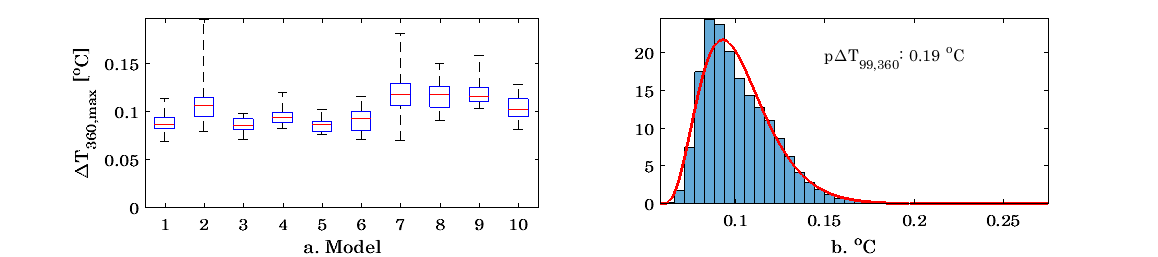
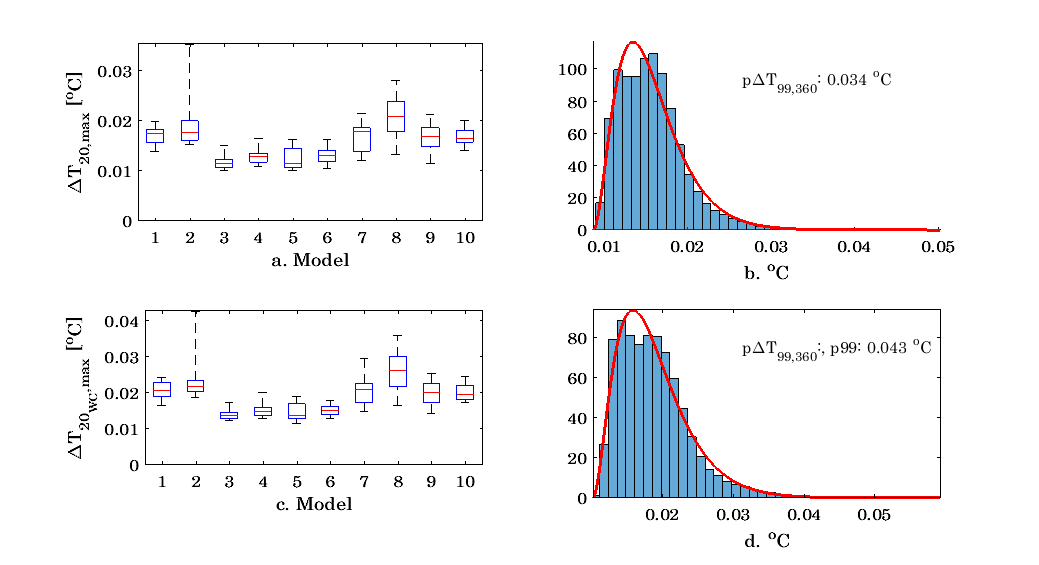
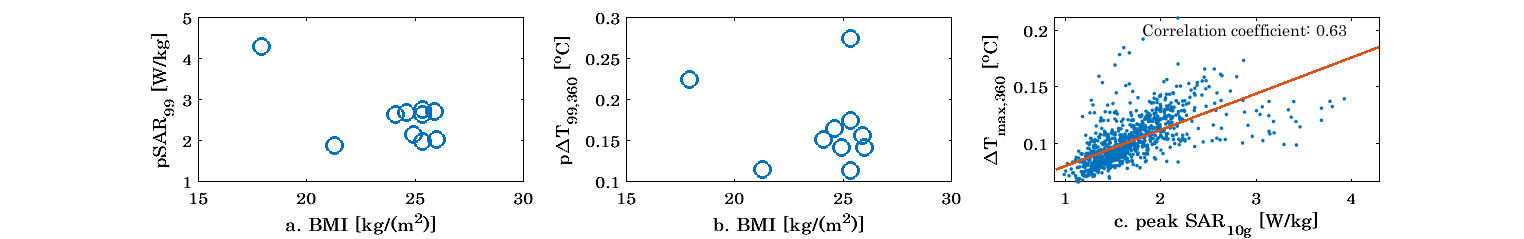
Figure 1 shows an overview of all segmented models, and resulting maximum SAR and temperature distributions. Figure 2 shows resulting peak SAR10g values for all volunteers for 10,000 random drive vectors per model (2a), and a histogram (2b) of these SAR10g values for all models. A gamma distribution was fitted to this histogram, which was then used to calculate the peak SAR10g value which is not to be exceeded for 99.9% of all drive vectors. The resulting pSAR99 value is 3.32 W/kg. Similarly, figure 3a. shows the peak temperature rise ∆T360 after a 360 second heating interval, resulting from 10,000 random drive vectors. The fitted gamma distribution (3b) results in a p∆T99,360 value of 0.19 ⁰C. Figure 4 shows the same distribution for a 20 seconds heating interval with perfusion and heat diffusion included (4a and 4b, p∆T99,20 = 0.034 ⁰C) and without perfusion or heat diffusion (c and d, p∆T99,20 = 0.043 ⁰C). Figure 5 (a) shows pSAR99 and (b) p∆T99,360 plotted against BMI, no relation can be seen between BMI and SAR or BMI and temperature rise. Figure 5c shows all ∆T360 values plotted against all peak SAR10g values. A moderate positive correlation (P=0.63) can be observed between SAR10g and ∆T360 values.Discussion
A database of 10 models was generated for a 7T cardiac array, to investigate inter-subject variability in SAR and temperature distributions. Resulting SAR distributions show that with a likelihood of 99.9%, peak SAR never exceeds 3.32 W/kg for an input power of 1W per channel. According to a peak local SAR limit of 20 W/kg in second level controlled mode, this would result in an input power limit of 6.02 W per channel. A p∆T360,99 value of 0.19 ⁰C is observed for 1W input power per channel. Assuming a linear relation between input power and temperature rise6, using 6.02 W per channel could cause a temperature rise of 1.14 ⁰C after 6 minutes heating. In practice this value will not often be reached because of thermoregulatory response, which is not included in these models. For short heating-intervals, possible temperature rise is very low (0.034 ⁰C with perfusion and diffusion, 0.043 ⁰C without perfusion and diffusion). Peak SAR10g and ∆T360 values show a moderate correlation (P=0.63) for random drive settings.Acknowledgements
This project was funded by the Dutch Technology Foundation STW, grant number 13783References
1. Oezerdem C, Winter L, Graessl A, et al. 16-channel bow tie antenna transceiver array for cardiac MR at 7.0 tesla. Magn Reson Med. 2016;75(6):2553-2565. doi:10.1002/mrm.25840.
2. Graessl A, Renz W, Hezel F, et al. Modular 32-channel transceiver coil array for cardiac MRI at 7.0T. Magn Reson Med. 2014;72(1):276-290. doi:10.1002/mrm.24903.
3. Steensma BR, Voogt IJ, Leiner T, et al. An 8-channel Tx/Rx dipole array combined with 16 Rx loops for high-resolution functional cardiac imaging at 7 T. Magn Reson Mater Physics, Biol Med. 2017. doi:10.1007/s10334-017-0665-5.
4. Meliado, E. F, Raaijmakers AJE, Restivo M, Maspero M, Luijten PR, van den Berg CAT. Database Construction for Local SAR Prediction: Preliminary Assessment of the Intra and Inter Subject SAR Variability in Pelvic Region. In: In: Proceedings of the 24th Scientific Meeting, International Society for Magnetic Resonance in Medicine, Singapore, 3660. ; 2016.
5. PA H, Neufeld E, E G, Klingenbröck A. IT’IS Database for Thermal and Electromagnetic Parameters of Biological Tissues - Version 3.1.
6. Das SK, Clegg ST, Samulski T V. Computational techniques for fast hyperthermia temperature optimization. Med Phys. 1999. doi:10.1118/1.598519.
7. Boulant N, Wu X, Adriany G, Schmitter S, Uʇurbil K, Van De Moortele PF. Direct control of the temperature rise in parallel transmission by means of temperature virtual observation points: Simulations at 10.5 tesla. Magn Reson Med. 2016. doi:10.1002/mrm.25637.
8. IEC. Medical electrical equipment. Part 2-33: particular requirements for the safety of magnetic resonance equipment for medical diagnosis. IEC 60601-2-33. 2010.
Figures