4149
Xenon-129 MRI of the lung in cystic fibrosis – preliminary results from a clinical trialVicki Huang1, Dana Albon2, Lucy Gettle2, Kun Qing1, Nicholas Tustison1, Yun Shim2, John Mugler1, James Patrie3, and Jaime Mata1
1Radiology and Medical Imaging, University of Virginia, Charlottesville, VA, United States, 2Medicine, University of Virginia, Charlottesville, VA, United States, 3Public Health, University of Virginia, Charlottesville, VA, United States
Synopsis
Results demonstrate sensitivity to early physiologic changes in subjects with cystic fibrosis (CF) using 3D single breath-hold chemical shift imaging (3D-SBCSI). 3D-SBCSI is a technique that uses MRI and hyperpolarized Xenon-129, an inert, non-radioactive gas, to assess lung physiology by detecting Xe-129 in three compartments in the lungs: airspaces, tissue parenchyma and plasma, and red-blood-cells. Results of 3D-SBCSI were compared to pulmonary function test results, Xe-129 ventilation images, blood panels and showed early physiologic trends in mild subjects that progressed on severe CF subjects. 3D-SBCSI could be used to monitor treatment responses and disease progression before symptoms become clinically apparent.
Introduction
In current clinical practice, early stages of pulmonary pathophysiology are difficult to monitor in cystic fibrosis (CF) without using invasive procedures or radiation. In contrast, 3D single breath-hold chemical shift imaging (3D-SBCSI)1,2 which uses MRI and hyperpolarized Xenon-129, an inert and non-radioactive gas, is sensitive to early CF progression. Here we present a preliminary analysis of results from a clinical trial of 3D-SBCSI in cystic fibrosis.Methods
Twenty-one healthy, 12 mild CF, and 6 severe CF subjects (n=39) participated in the study, and were imaged using a 1.5T MR scanner (Avanto, Siemens). For MR imaging, subjects laid supine on the scanner table, inhaled a volume (1/3 FVC) of enriched Xe-129 up to 1000mL and the remainder (if any) N2, and held their breath throughout two ~7-second acquisitions. A vest-shaped RF coil tuned to the Xe-129 frequency (Clinical MR Solutions) was used. Xe-129 was polarized to ~30% using a commercial polarizer (Model 9820, Polarean). The resulting Xe-129 ventilation, Xe-129 3D-SBCSI, and proton images were post-processed3. The percentage of ventilation defects was calculated from the Xe-129 ventilation and corresponding proton images, and, from the 3D-SBCSI acquisition, three peaks in the Xe-129 spectrum were identified, corresponding to alveolar gas, tissue, and red blood1,2,4 These peaks were analyzed on a voxel-by-voxel basis, and results were compared to those from pulmonary function tests (PFT) and blood panels obtained in each subject.Results
Severe CF subjects had a larger percentage of ventilation defects (49.2±3.9% of total lung volume) than mild CF (34.0±14.4%) (p=0.07) and healthy subjects (10.5±7.4%) (p<0.05)(Fig. 1). A statistically significant difference (p<0.05) in the percentage of ventilation defects was also found between mild CF and healthy subjects. The average tissue/RBC peak ratios were 3.36±0.7 for severe CF subjects, 3.1±0.6 for mild CF, and 2.7±0.5 for healthy subjects (p<0.05) (Figs. 2, 3). Tissue/RBC, RBC/gas, and tissue/gas ratios correlated well with iron concentration and transferrin saturation in blood (|R|>0.70).Discussion
Trends in the tissue/RBC peak ratio showed good correlation with ventilation defects and revealed localized areas of ventilation/perfusion mismatch. Two severe CF subjects (S1 and S2) had similar FEV1 but different iron levels; with lower iron, tissue/RBC was higher, tissue/gas was about the same, and RBC/gas was lower (Fig. 4). We observed a larger shift in the RBC peak relative to the gas peak as the disease became more severe and iron level decreased, indicating a reduced capacity to bind oxygen.5,6 The RBC T2* relaxation time was shorter in severe disease which may be linked to acidosis.7Conclusion
3D-SBCSI parameters indicate underlying impairment in gas-exchange and reveal specific physiologic evidence of disease progression on a voxel-by-voxel basis. 3D-SBCSI can detect early pulmonary physiologic changes in CF subjects that could be used to monitor treatment responses and disease progression before symptoms become clinically apparent.Acknowledgements
This work was funded by NIH grants R01-CA172595 and S10-OD018079.References
[1] Mata J. ISMRM; 2010; Stockholm [2] Mata J. ISMRM; 2009; Honolulu. [3] Tustison N, et al. J Mag Res Imag 2011;34(4):831-41 [4] Qing K, et al. J Mag Res Imag. 2014;39(2):346-59 [5] Kaushik SS, et al. J Applied Physiology. 2014;117:577-85 [6] Norquay G, et al. MRM. 2017;77:1399-408 [7] Schilling AM, et al. Neuroradiology. 2002;44:968-72.Figures
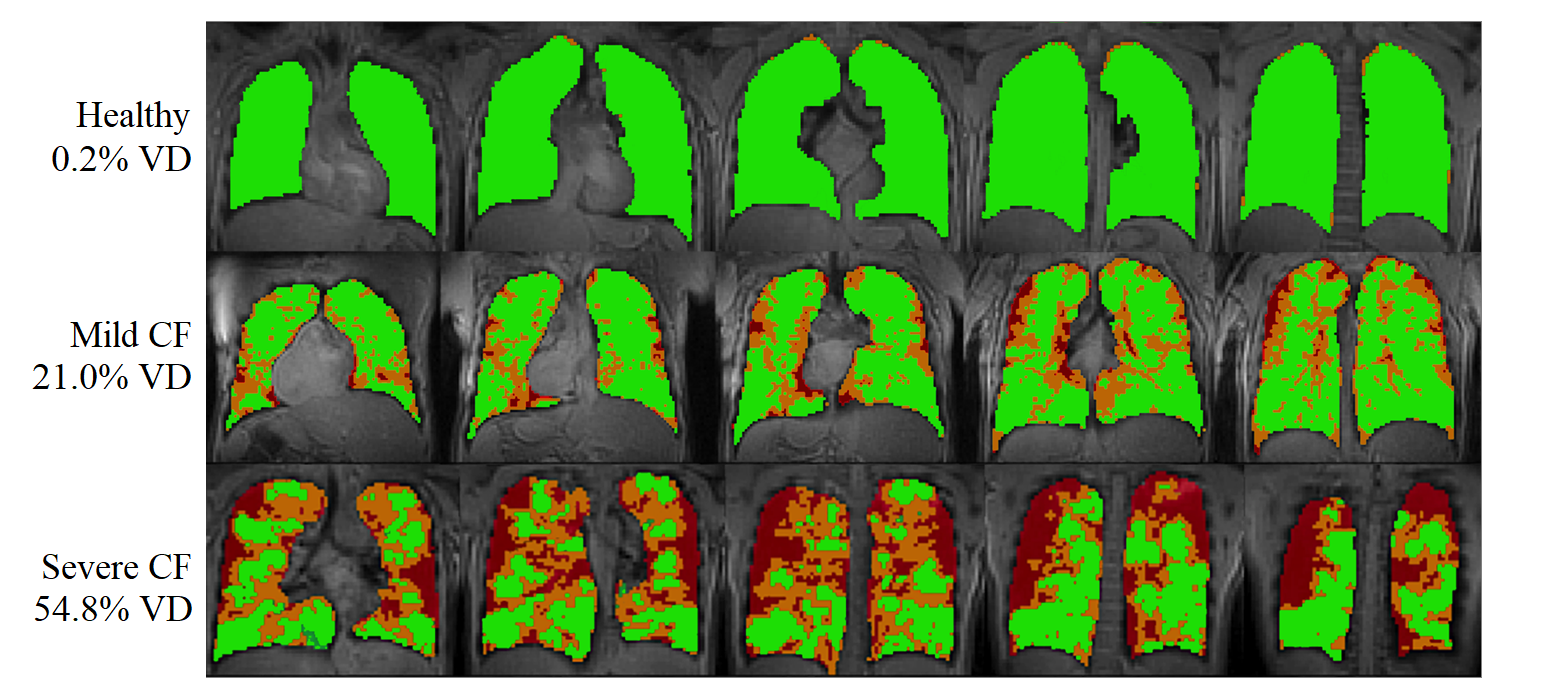
Figure 1:
Ventilation maps of healthy, mild CF, and severe CF subjects. Green shows normal
and hyperventilation, orange is hypoventilation, and red is no ventilation
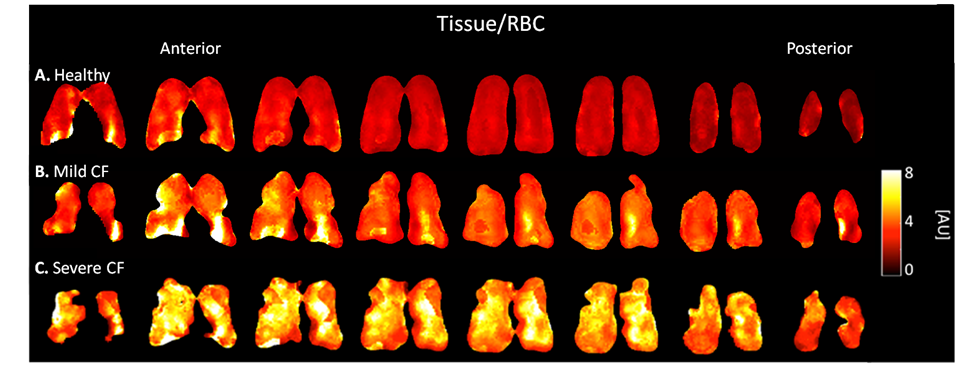
Figure 2:
Tissue/RBC ratio maps of (a) healthy, (b), mild CF, and (c) severe CF subjects.
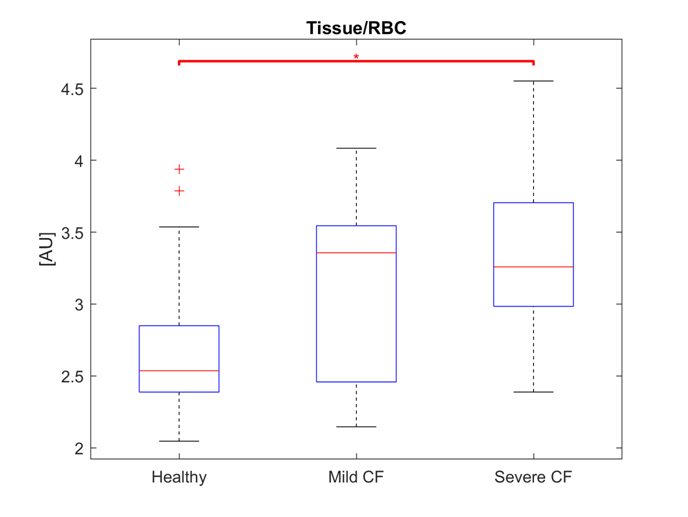
Figure 3:
Box plot showing median and quartile ranges of subject pool with significance
indicated (*=p<0.05); + symbol denotes outliers.
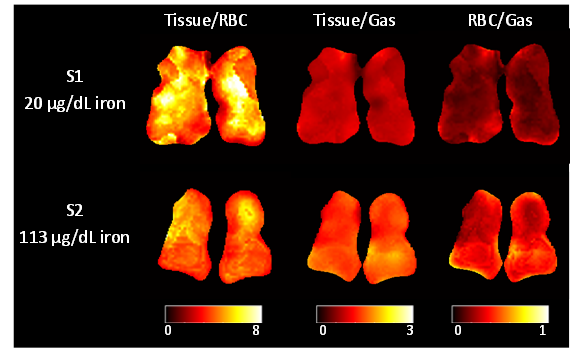
Figure
4: Ratio map comparison between subjects with similar FEV1 %-predicted
(S1 43%, S2 59%) and dissimilar iron levels.