4147
Initial Comparison of 19F and Hyperpolarized 129Xenon Gas Lung Imaging in Cystic Fibrosis1Physics and Astronomy, University of North Carolina at Chapel Hill, Chapel Hill, NC, United States, 2Biomedical Research Imaging Center, University of North Carolina at Chapel Hill, Chapel Hill, NC, United States, 3UNC/NCSU Joint Department of Biomedical Engineering, Chapel Hill, NC, United States, 4Radiology and Physics, UNC School of Medicine, Chapel Hill, NC, United States, 5Departments of Medicine and Pediatrics, University of North Carolina at Chapel Hill, Chapel Hill, NC, United States, 6Pulmonary Diseases and Critical Care Medicine, UNC School of Medicine, Chapel Hill, NC, United States
Synopsis
Gas enhanced MRI has the potential to provide regional information about lung function that pulmonary function tests alone cannot provide. Hyperpolarized xenon gas is a well-established tool for the assessment of regional lung function in humans, and 19F gas MRI has been proposed as a lower cost alternative that can provide, in addition to ventilation defects, wash in and wash out rates. Here we report the initial findings of a study aiming at comparing these two techniques for assessment of lung ventilation function in subjects with cystic fibrosis.
Introduction
Cystic fibrosis (CF) is the most common life-shortening genetic disease in Caucasians. CF leads to the production of abnormally viscous mucus that blocks airways and results in local infections and inflammation. In CF patients, MRI with hyperpolarized (HP) 129Xe gas has been shown to provide regional information about lung ventilation that is complimentary to standard spirometry1. Fluorinated gases have been proposed as a lower cost alternative to HP 129Xe gas and a comparison between the two gases for lung ventilation was recently performed in healthy volunteers2. The scope of this work is to perform a comparison between 19F and HP 129Xe gas for the detection of lung ventilation defects in subjects with CF at 3T.Methods
Three subjects with CF, lung function >40% and clinical stability, underwent a HP 129Xe and 19F lung MRI scan during the same imaging session in a randomized order as part of a study aiming at comparing 19F and HP 129Xe gas imaging in subjects with CF. All scans were performed on a 3T clinical system (PRISMA, Siemens Medical Solutions, USA). Xenon images were acquired using a flexible 129Xe chest coil (Clinical MR Solutions, WI) during a single breath hold of 750 ml of isotopically enriched 129Xe polarized up to ~14% and mixed with 250ml of N2. 3D images were acquired using a 2D GRE sequence with a resolution of 2.73mm x 4.37mm x 10.5mm. 19F images were acquired using an 8-channel 19F-tuned chest coil (ScanMed, NE). For the acquisition of 19F images, subjects inhaled of a pre-mixed, medical grade gas mixture of 79% perfluoropropane (PFP) to 21% oxygen delivered using a custom gas delivery device3. A series of wash in and wash out 19F ventilation images were acquired from each subject to extract wash in and wash out rates. Each image in the series was acquired during a 12-second breath hold that followed two tidal volume breaths and a full breath of the contrast gas. Images were acquired using a 3D GRE sequence with a resolution of 6.25mm x 6.25mm x 15mm. 3D 1H scans were run before and after each 129Xe and 19F scan to obtained anatomical information and to facilitate co-registration of 129Xe images with 19F images. Images were first processed in MIM Software (Cleveland OH) and then in MATLAB (Mathworks, MA) for B1 correction4, and for ventilation defect percentage (VDP) and low ventilation defect percentage (LVP) maps calculation.Results
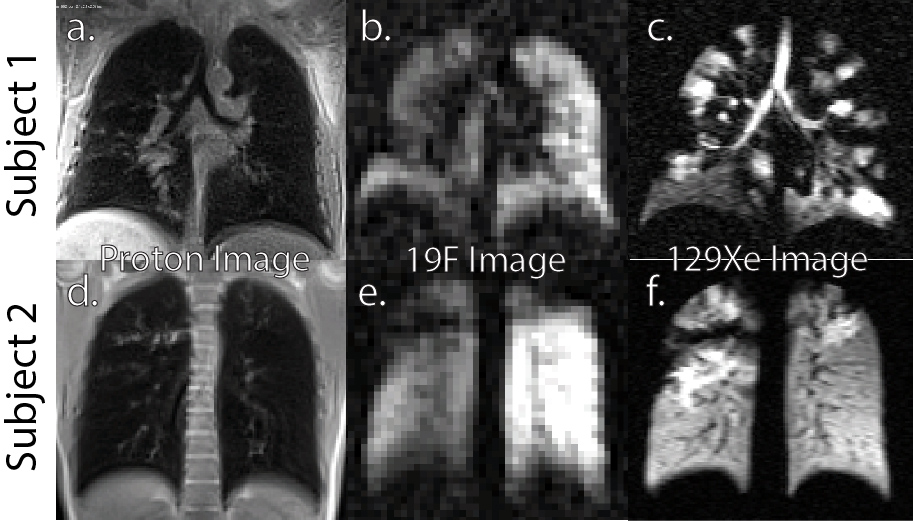
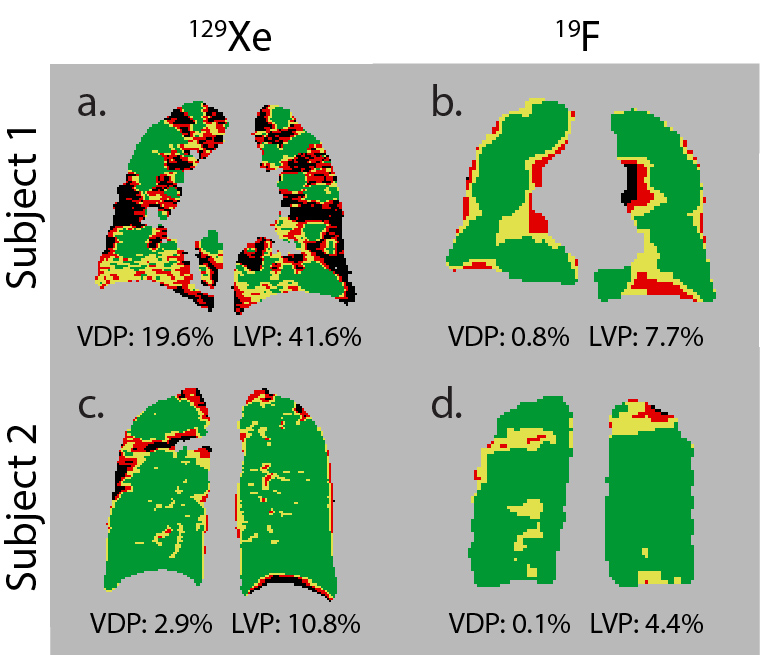
Figure 1 shows 129Xe and 19F lung ventilation images acquired in two CF subjects that show different lung ventilation phenotypes. The 19F ventilation images display a lower SNR despite their lower resolution. While subject 1 exhibits large wedge shaped ventilation defects that were observed in both imaging procedures, subject 2 exhibits smaller patchy ventilation defects that were not visible on 19F images. Figure 2 shows 19F and 129Xe VDP maps of the bias corrected images shown in Figure 1. While in subject 2 the 19F VDP maps mirror the defects in the 129Xe VDP map, this is not the case in subject 1. This is reflected in the VDP and LVP (ventilation < 10% of maximum ventilation) numbers, being much lower in subject 1 and slightly lower in subject 2 for the 19F images.Conclusion
19F images demonstrated, in general, lower SNR and lower VDP values than 129Xe images, despite the use of a low spatial resolution for the 19F images. From this initial study, VDP values were more similar in subjects with wedge shaped ventilation defects than in subjects with smaller patchy ventilation defects. The lower VDP value in 19F images is most likely due to PFP diffusion during the breath holds preceding the imaging breath. PFP diffuses into regions of the lungs that are not completely obstructed and are characterized by a low wash in time. Comparison between 129Xe and 19F images using the same inhalation protocol is currently underway.Acknowledgements
This work was supported by the Cystic Fibrosis Foundation Mucociliary Clearance Consortium Grant DONALD14XX0, by the NIDDK RTCC CF core grant P30 DK065988, and by the NIDDK grant R01 DK108231.References
1. Altes TA, Eichinger M, Puderbach M. Magnetic Resonance Imaging of the Lung in Cystic Fibrosis. 2007.
2. Maunder A, Hughes PJC, Chan H, Norquay G, Collier G, Rodgers O, Rao M, Wild J. Comparing 19 F C3F8 Lung Ventilation Imaging with Hyperpolarized 129 Xe : Similarities and Limitations. In: Proc. Intl. Soc. Mag. Reson. Med. 26 (. 2018. p. 1083–1085.
3. Halaweish AF, Moon RE, Foster WM, Soher BJ, McAdams HP, MacFall JR, Ainslie MD, MacIntyre NR, Charles HC. Perfluoropropane gas as a magnetic resonance lung imaging contrast agent in humans. Chest. 2013;144(4):1300–1310.
4. Li C, Gore JC, Davatzikos C. Multiplicative intrinsic component optimization (MICO) for MRI bias field estimation and tissue segmentation. Magnetic Resonance Imaging. 2014;32(7):913–923.
Figures