4145
Measurement of Regional Fractional Ventilation in a Mouse Model of Lung Cancer under Free-Breathing1Radiology, University of Pennsylvania, Philadelphia, PA, United States
Synopsis
Hyperpolarized gas MRI is a powerful modality for the assessment of lung structure and function. However, its utility as an investigative tool for animal disease models is limited by the terminal intubation procedures necessary for precise gas delivery and ventilation. Here, we present a technique for measuring regional fractional ventilation longitudinally in a mouse model of lung cancer under spontaneous respiration using hyperpolarized 129Xe MRI. Fractional ventilation maps at different stages of cancer revealed significant structural changes, a decline in regional ventilation, and an increase in ventilation heterogeneities associated with tumor progression.
Introduction
Hyperpolarized 129Xe (HXe) MRI is a powerful and sensitive modality capable of acquiring structural and functional information about the lung. Ventilation measurements acquired using HXe MRI, for example, are more sensitive to localized regions of impaired function than spirometry measurements, which depict lung function on a global scale and do not specify the underlying cause of lung function decline1. While HXe MRI has shown great potential as an investigative tool in animal models of lung disease2,3, hyperpolarized gas MRI studies are largely limited to cross-sectional studies, as the difficulty of maintaining controlled ventilation and gas delivery necessitates an invasive intubation or tracheostomy procedure. The ability to carry out longitudinal studies in animal models of progressive lung diseases which are characterized by high inter-subject variability, such as cancer or radiation-induced lung injury, would greatly benefit our understanding of such diseases. In this study, we demonstrated a technique for acquiring fractional ventilation (FV) maps in a mouse model of lung cancer longitudinally during free-breathing.Methods
Lung cancer was induced in a genetically modified strain of C57BL/6 mice (n = 3) as previously described4, after which mice were incubated and imaged weekly to detect cancer onset. For imaging, mice were anesthetized using 1-2% isoflurane and placed in a modified animal cradle equipped with a nose cone featuring both an inlet and outlet for gas. Once secured in the cradle, animals were placed in a dual-tuned 1H/129Xe coil and subsequently inserted into a 9.4T vertical-bore micro-imaging MRI system (Bruker Inc.). Enriched 129Xe gas was polarized using a prototype commercial optical pumping system (XeBox-E10I Xemed, LLC, Durham, NH) and stored in a tedlar bag within a sealed chamber. Animals were supplied with a normoxic gas mixture consisting of O2/isoflurane/air (100 ml/min) and HXe (20 ml/min) during imaging, which lasted approximately 30 min. Gas-phase images were acquired at two flip-angles using a respiratory-gated multi-slice gradient echo (GRE) sequence (TR/TE = 100ms/1ms, FA = 30°, 90°, FOV = 20x20mm2, matrix size = 64x64, three 3.4mm slices) and were later averaged and registered to an atlas to mitigate motion artifacts. Quantitative ventilation maps were derived by isolating the FV from a previously published analytical model of per-breath gas replacement and relaxation5, Mn = Mn-1 cos(α) f (1-FV) + S0 FV, where n is the breath number, α is flip-angle, f is the fraction of remaining gas polarization after relaxation due to collision with alveolar walls and paramagnetic O2 molecules during a breath, S0 is source magnetization, and Mn is alveolar magnetization after the nth breath. Imaging took place in steady state and over multiple breaths, and in the limit of large n this expression simplifies to M(α) = S0 FV / [1 - cos(α) f (1 - FV)] . FV was derived by sampling M(α) at two different flip-angles, which was sufficient to determine FV throughout the range expected in a free-breathing mouse6.
Results
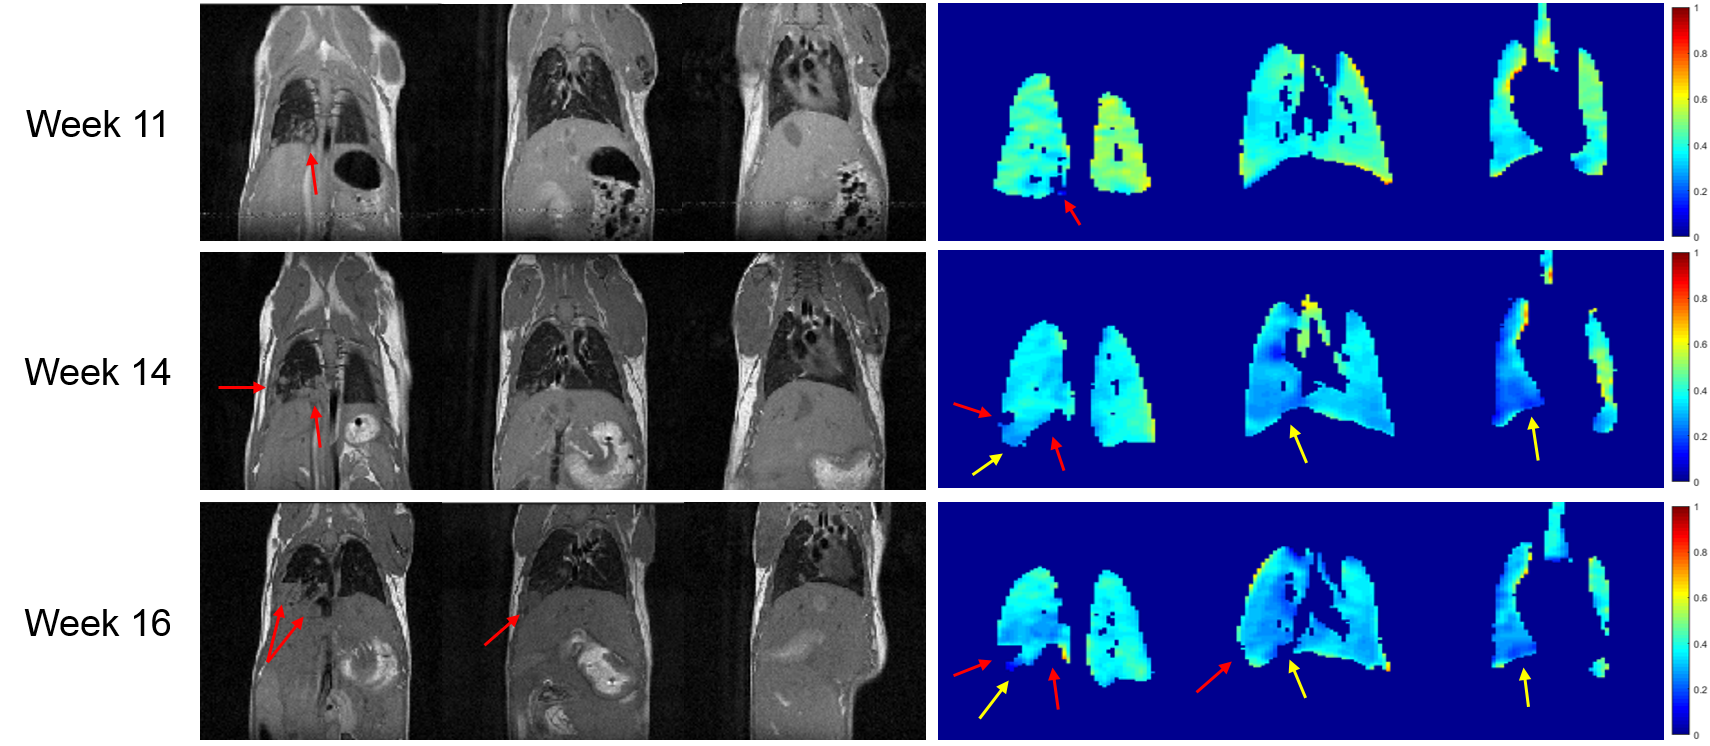
Figure 1 shows representative T2-weighted proton images and corresponding FV maps for a mouse with lung cancer at 11, 14 and 16 weeks post-induction. At 11 weeks, we see regions devoid of HP gas magnetization corresponding to cancerous tumors (red arrows), and signal voids are seen to grow with tumor progression at weeks 14 and 16 (red arrows) as expected; however, we also notice an appreciable decline in FV in tumor-adjacent regions (yellow arrows).Discussion
Despite our attempts to maintain a stable breathing pattern via real-time adjustment of isoflurane, the FV of the free-breathing mouse typically varies inversely with breathing rate to approximate constant minute ventilation. This is most apparent when comparing the means of FV maps acquired at week 11 (mean FV of 0.42, average BPM 110) to those acquired at weeks 14 and 16 (mean FVs of 0.34 and 0.33, average BPMs of 160 and 150, respectively). As with mechanical ventilation, with its dependence on the experimenter-chosen tidal volume, the mean FV is unlikely to be diagnostically relevant. Instead, we expect the pattern and heterogeneity of FV values, and their change with time, to be most indicative of disease state, in this case highlighting structural and functional changes associated with tumor progression.Conclusion
In this study, we demonstrated a technique for measuring FV in a free-breathing mouse with lung cancer. Images and FV maps acquired at different disease stages revealed structural changes, a decline in lung function, and an increase in ventilation heterogeneities associated with cancer progression.Acknowledgements
The transgenic mouse model and cell lines used were kindly provided by Dr. Diane Lim from the Department of Sleep Medicine at the University of Pennsylvania located in Philadelphia, PA, United States.References
[1] Ebner, L., et al. European Journal of Radiology, 86:343
[2] Imai, H., et al. NMR in Biomedicine, 2014:28(1):24
[3] Zanette, B., et al. Advances in Radiation Oncology, 2017:2(3):475
[4] Sheen, M.R., et al. Open Life Sciences, 10:854
[5] Albert, M., et al. Hyperpolarized and Inert Gas MRI: From Technology to Application in Research and Medicine, Chapter 9. Academic Press; 2016
[6] Ford, N. L., et al. Journal of Applied Physiology, 2007:102(5):2046
Figures