4141
Mapping and Correcting Hyperpolarized Magnetization Decay Using Radial Keyhole Imaging1Center for Pulmonary Imaging Research, Cincinnati Children's Hospital Medical Center, Cincinnati, OH, United States, 2Clinical Imaging Physics Group, Department of Radiology, Duke University Medical Center, Durham, NC, United States, 3Imaging Research Center, Cincinnati Children's Hospital Medical Center, Cincinnati, OH, United States, 4Department of Biomedical Engineering, University of Cincinnati, Cincinnati, OH, United States, 5Department of Pediatrics, University of Cincinnati Medical Center, Cincinnati, OH, United States
Synopsis
Hyperpolarized (HP) media enable biomedical imaging applications otherwise unachievable using standard MRI contrast agents. However, quantitative analysis of HP images is complicated by spatially varying signal decay due to T1 relaxation and RF excitation. By imaging with center-out trajectories, HP signal intensity is collected with every acquisition, thereby encoding signal decay alongside k-space data. Using keyhole reconstruction, multiple temporally resolved images were reconstructed to generate voxel-by-voxel maps of hyperpolarized signal decay following a simple analytical model. Here these maps are applied to correct spatially varying magnetization decay in HP 129Xe, improving the quantitative accuracy of ventilation images.
Introduction
Hyperpolarized (HP) media MRI, particularly gaseous HP 129Xe imaging, is increasingly used for pulmonary structural and functional imaging of conventionally hard-to-image anatomy and physiological processes.1-4 However, the quantitative accuracy of these images is deleteriously impacted by spatially varying polarization decay due to longitudinal relaxation and RF pulsing.5-6 This is especially problematic for human lung imaging, where large coils lead to significant B1 variability and heterogeneous O2 content leads to significant T1 variability. To alleviate these concerns, T1 and flip angle (B1) maps can be generated, but this mapping consumes additional hyperpolarized magnetization, increasing the time and expense of scans.7 In principle, however, both T1 and RF depletion are encoded simultaneously with imaging, suggesting that HP magnetization decay can be extracted from imaging data given appropriate selection of imaging sequences and reconstruction algorithms.
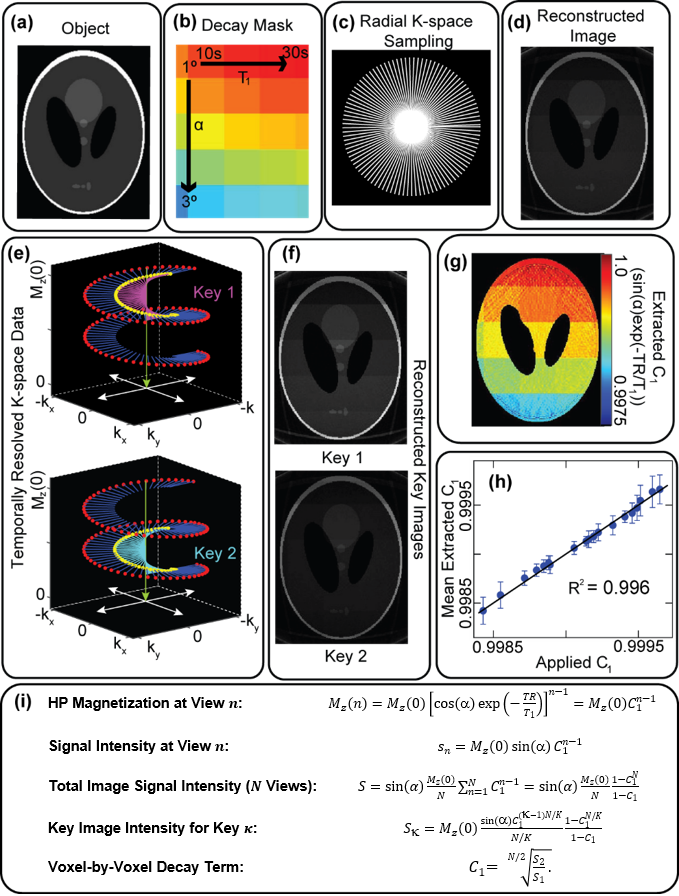
Imaging sequences with center-out k-space trajectories (3D spiral, radial, etc.) sample the total HP signal intensity (k0) with each view, thus encoding signal decay within the time-domain data.8-10 Because structural detail remains constant during a short (<16s) scan, temporal subsets of low-frequency k-space may be combined with the entirety of the high-frequency edges to create time-resolved images from a single dataset, i.e. keyhole reconstruction.11-12 Here we demonstrate that by combining HP media images obtained using center-out k-space trajectories with post-acquisition keyhole reconstruction, voxel-by-voxel HP signal decay maps can be generated with no additional data collection.
Methods
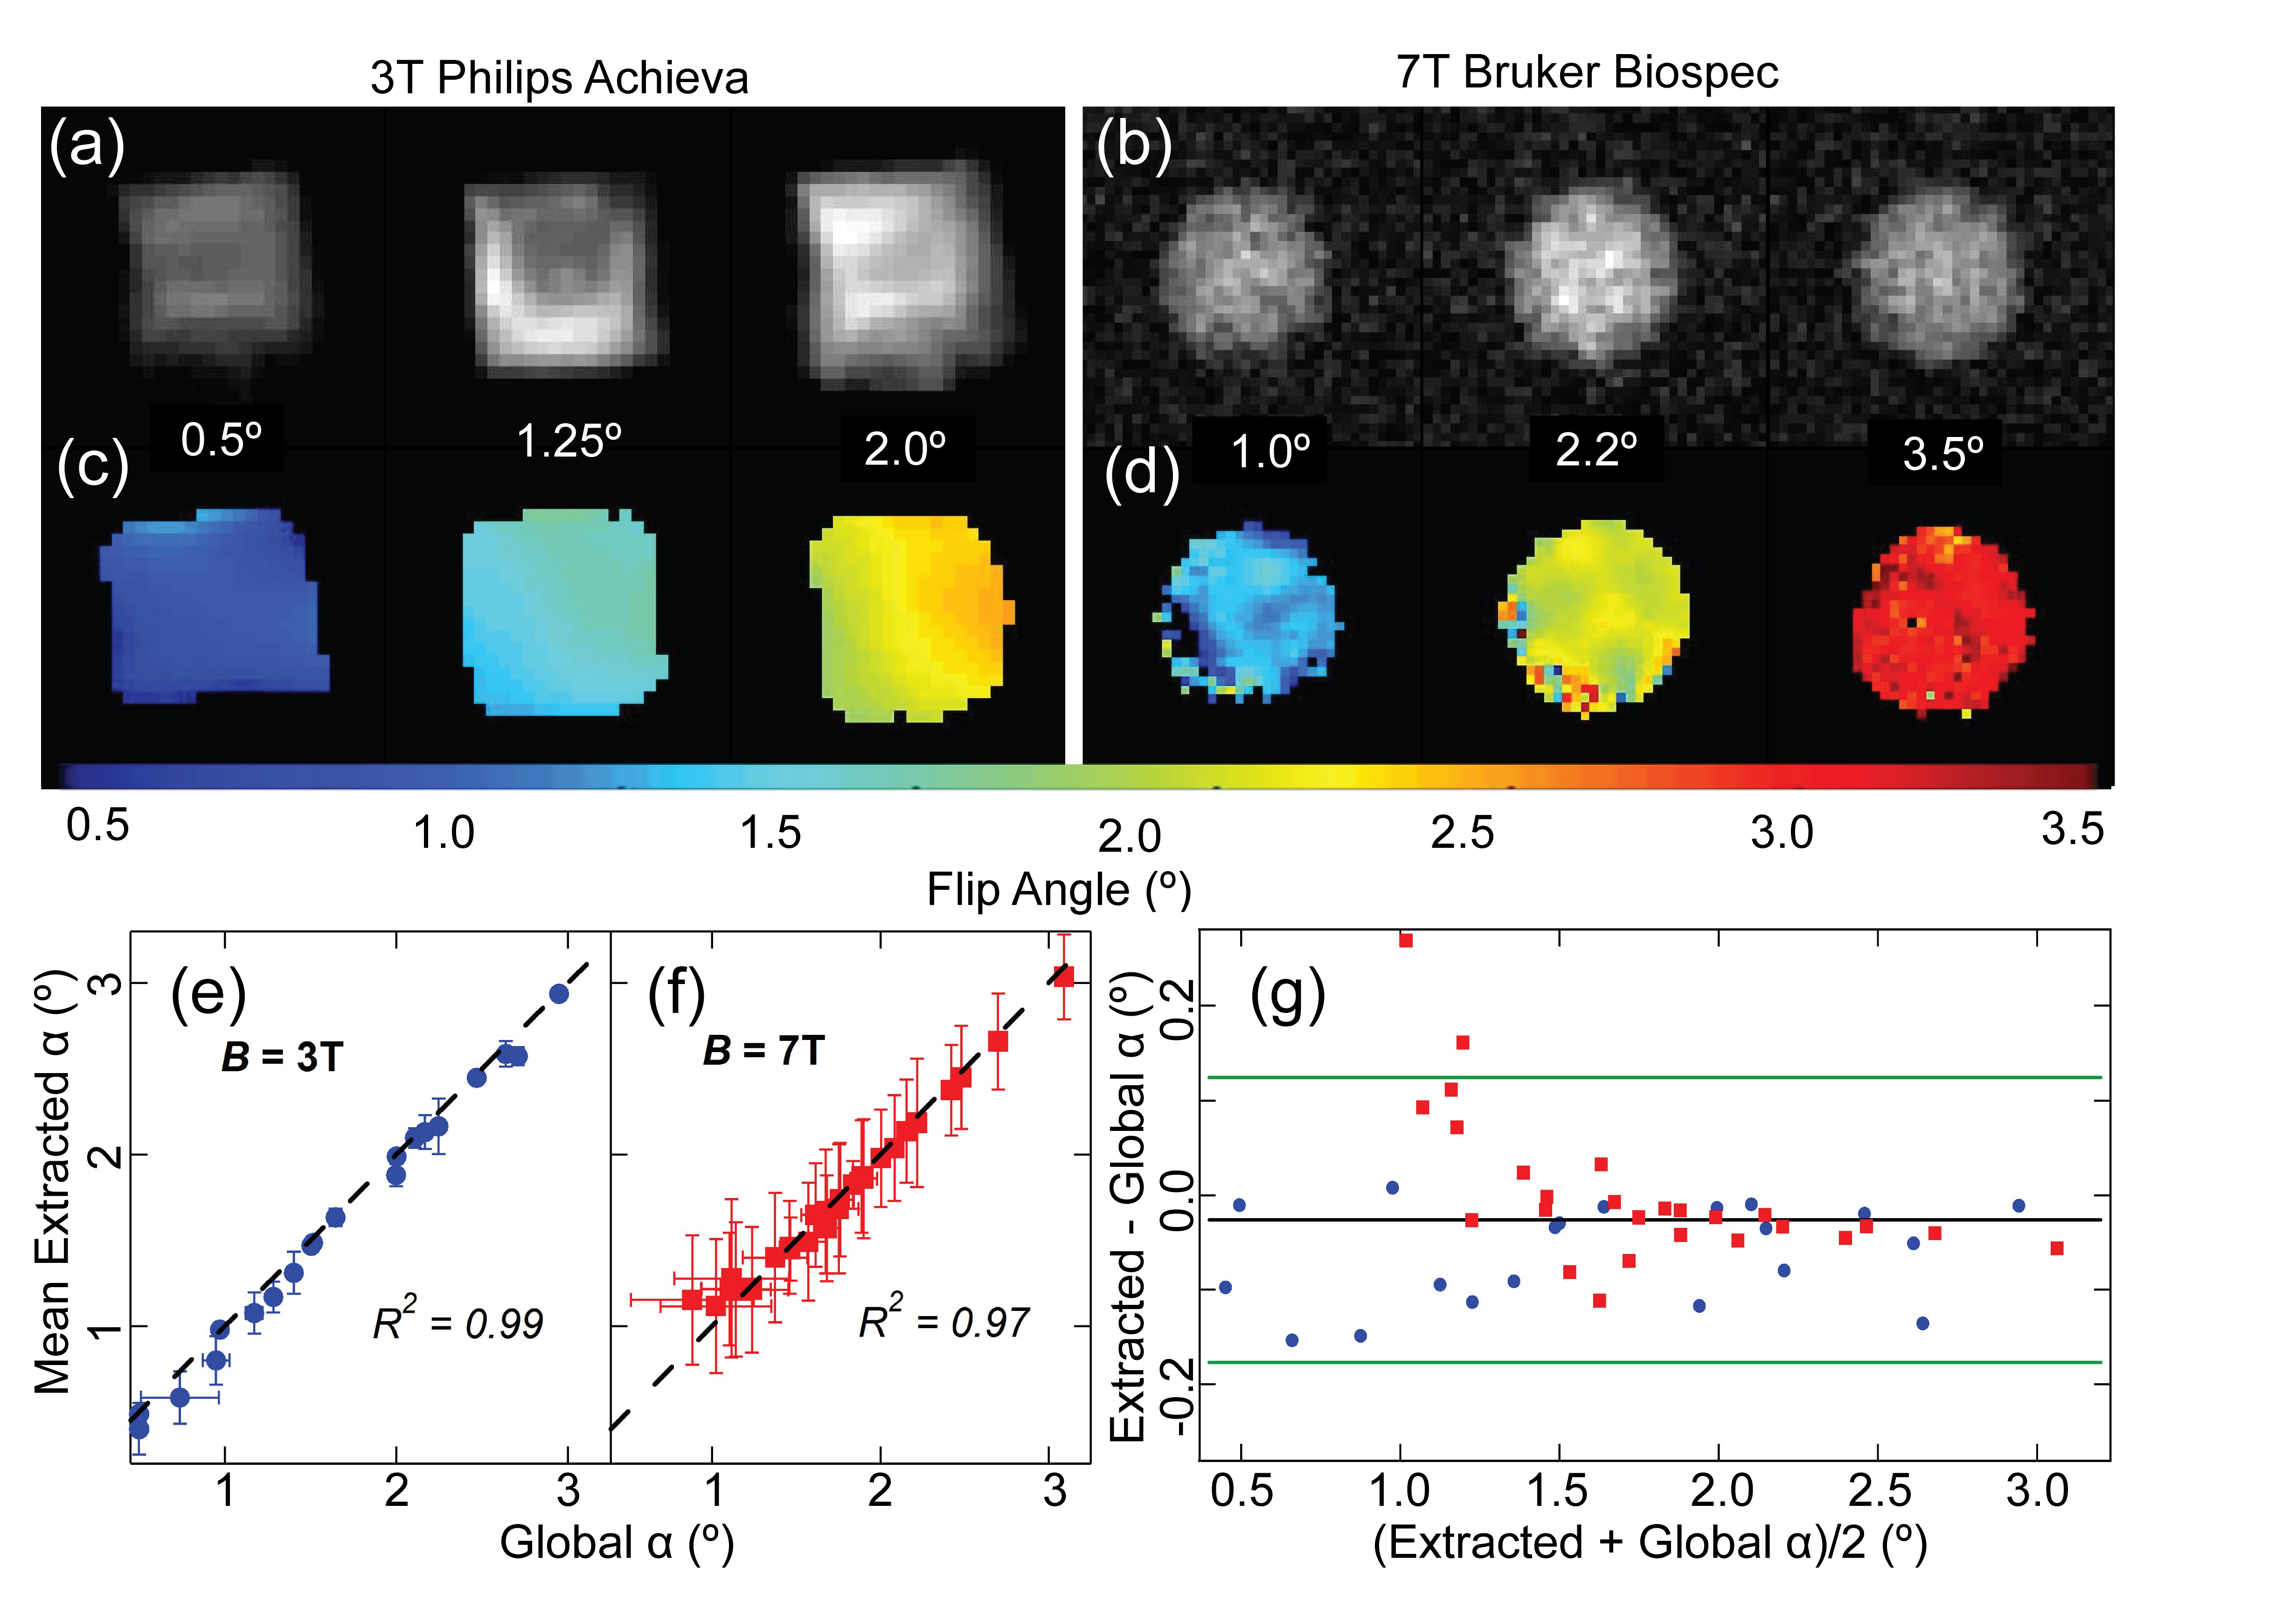
Validation studies: Radial sampled k-space data were simulated to mimic spatially varying signal decay. Additionally, both structured and non-structured phantoms containing hyperpolarized 129Xe were imaged using 3D radial ultra-short echo time (UTE) sequences on both clinical (3T Achieva, Philips Healthcare, Best, Netherlands) and preclinical (7T BioSpec, Bruker, Billerica, MA) imaging systems. Clinical(Preclinical) scanning parameters: matrix: 44×44×44(40×40×40), FOV: 250×250×250(40×40×40)mm3, TR/TE: 4/0.14(6/0.7)ms, bandwidth: 14,000(50,000)Hz, views: 1940(2514), α: 0.5-3°(1-3.5°)
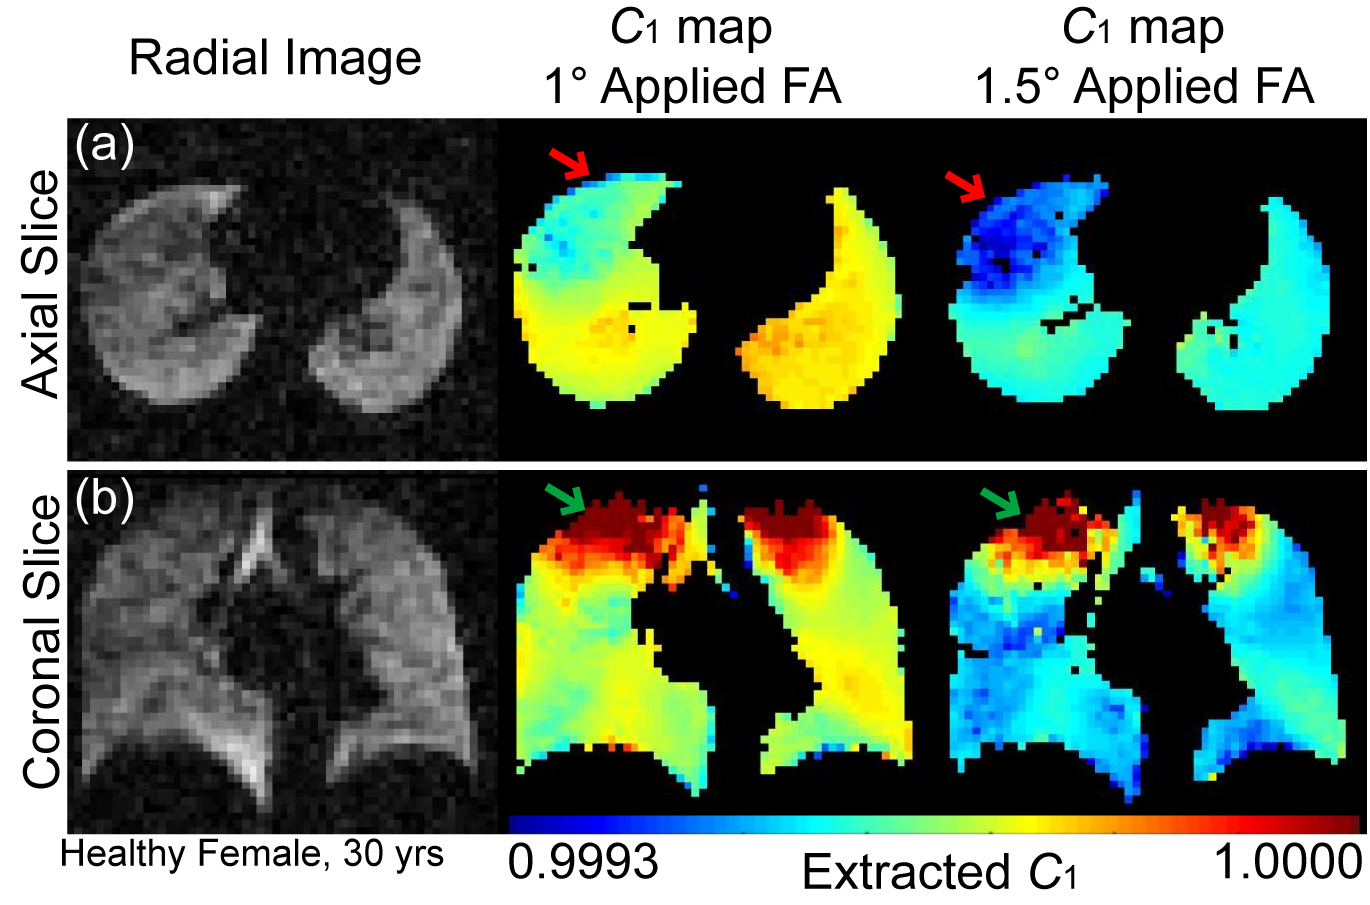
In Vivo studies: In vivo 129Xe ventilation images were obtained using 3D radial imaging on a 3T Achieva system for 6 subjects (N=4 healthy, N=2 with cystic fibrosis, mean age 15.8±7.9yrs, 3 male, 3 female). Parameters included: matrix: 60x60x60, FOV: 300x300x300mm3, TR/TE: 4.5/0.15ms, bandwidth: 265.0Hz/voxel, views: 3600, α: 1-1.5°). For all imaging, xenon was polarized to ~25% (Polarean model 9810, Durham, NC).
Keyhole: Low frequency k-space data determined by the Nyquist radius was separated into two temporally divided (1st/2nd half of acquisition) datasets and reconstructed with all of the high frequency data (Figure 1) using in-house reconstruction software or graphical programming interface (GPI).13-15 These “keyhole” images were used to generate maps of regional hyperpolarized signal decay (C1=cos(α)exp(-TR/T1)) following a simple analytical model. Maps of regional decay were then used to correct images reconstructed from the complete k-space data.
Results
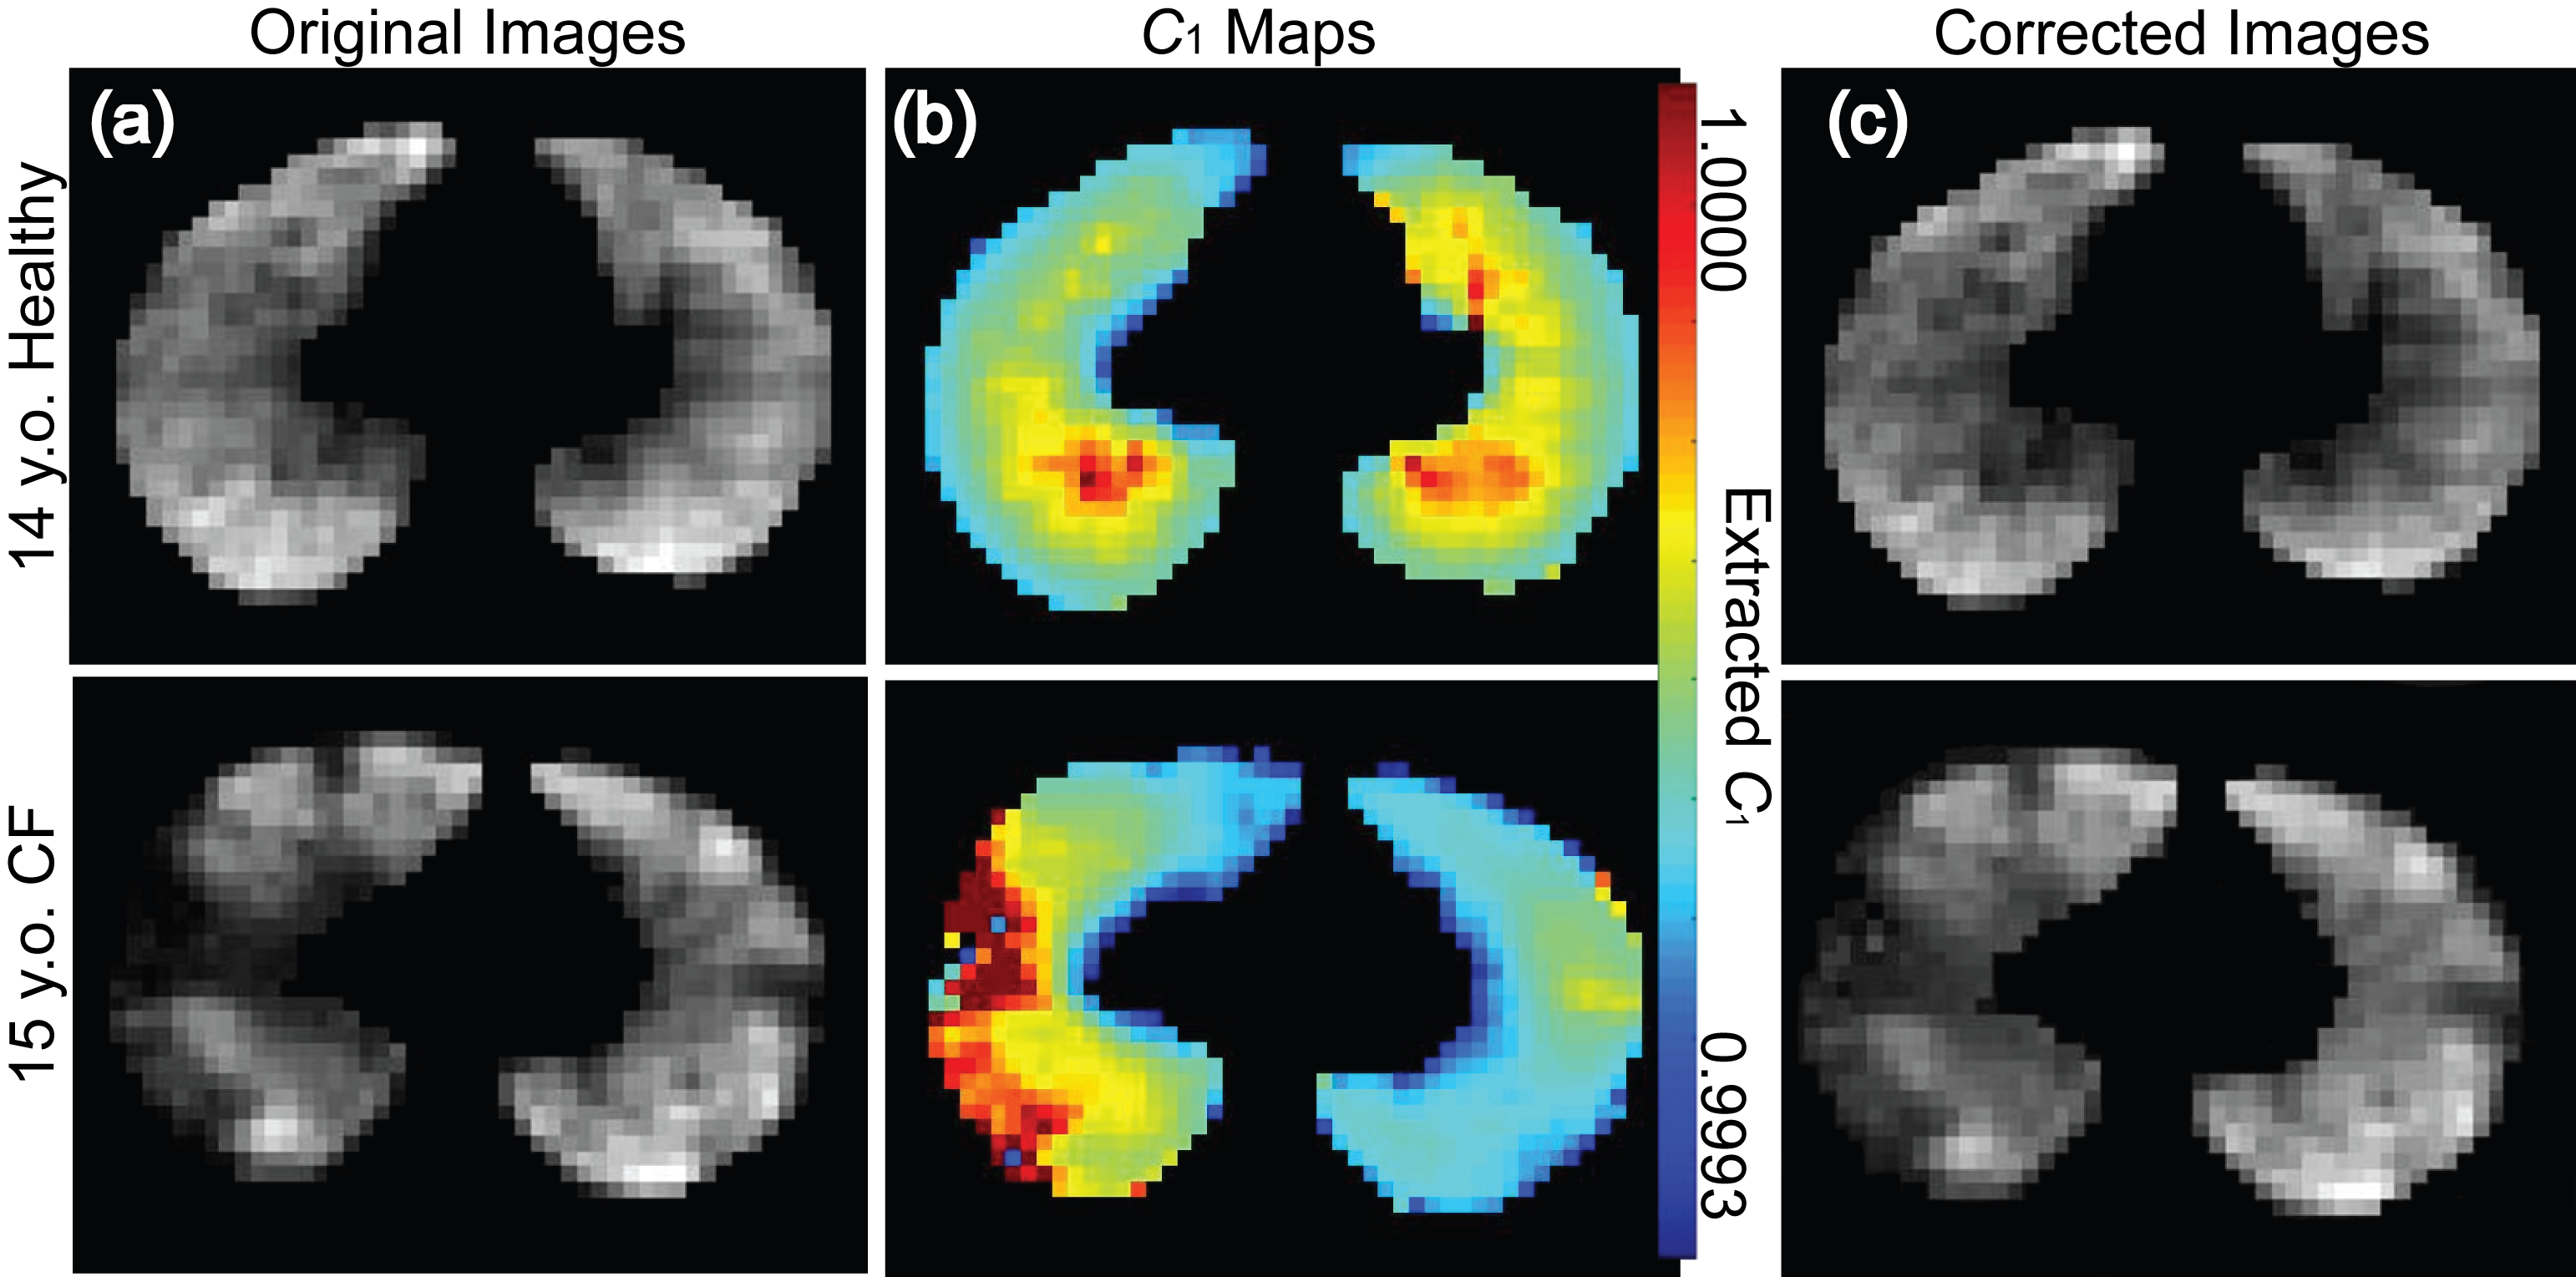
Keyhole-derived HP decay maps showed excellent agreement with decay values used in simulations (R2=0.996, Figure 1) and also with global decay extracted from k0 in HP 129Xe phantom imaging (R2>0.97, Figure 2). Regional variations within decay maps matched visually with applied regional decay for simulations and with expected coil inhomogeneity in phantom imaging. For in vivo images, even in regions of ventilation defect, the majority (>90%) of voxels contained adequate HP gas signal (SNR>2) in both keys to calculate a decay value. Mean regional HP signal decay matched well with global values for all subjects. Expected regional heterogeneities in decay due to coil position and gravitationally-dependent ventilation differences were clearly visible in decay maps (Figure 3).16,17 Decay terms in ventilation defects varied widely, with a whole lung standard deviation about 30% greater than that seen in healthy lungs. Defects generally decayed more slowly due to low oxygen partial pressure, which suggests that conventional analyses may underestimate ventilation impairment.Discussion and Conclusion
For simulations, phantom imaging, and in vivo imaging, mean decay values closely matched global measures of decay, and regional variations matched those expected from experimental parameters and lung physiology. Bland-Altman analysis from phantoms with negligible T1 further demonstrate close agreement between extracted and global decay. Finally, decay maps were used to correct ventilation images for regional hyperpolarized signal decay. After correction, there was minimal change in healthy ventilation images, but the ventilation pattern displayed by CF subjects is significantly altered (Figure 4), emphasizing the role magnetization dynamics play in attempts to quantitatively image HP media.
By sampling k-space with center-out k-space trajectories and using post-acquisition keyhole reconstruction strategies, hyperpolarization decay maps may be generated using a single image dataset without additional data collection. While this technique was validated and applied using hyperpolarized 129Xe MRI, the approach is general and can be applied to the imaging of any type of HP media.
Acknowledgements
This work was supported by the NIH (R00HL111217, R44HL123299, and T32HL007752), Cystic Fibrosis Foundation (CLEVEL16A0), and Cincinnati Children’s Research Foundation.References
1. Ardenkjær-Larsen JH, Fridlund B, Gram A., et al. Increase in signal-to-noise ratio of > 10,000 times in liquid-state NMR. PNAS. 2003;100:10158-10163.
2. Keshari KR, Wilson DM. Chemistry and biochemistry of 13C hyperpolarized magnetic resonance using dynamic nuclear polarization. Chem Soc Rev. 2014;43:1627-1659.
3. Walkup LL, Woods JC. Translational applications of hyperpolarized 3He and 129Xe. NMR Biomed. 2014;27:1429-1438.
4. Liu Z, Araki T, Okajima Y, et al. Pulmonary hyperpolarized noble gas MRI: Recent advances and perspectives in clinical application. Eur J Radiol. 2014;83:1282-1291.
5. He M, Kaushik SS, Robertson SH, et al. Extending semiautomatic ventilation defect analysis for hyperpolarized 129Xe ventilation MRI. Acad Radiol. 2014;21:1530-1541.
6. Daniels CJ, McLean MA, Schulte RF, et al. A comparison of quantitative methods for clinical imaging with hyperpolarized 13C-pyruvate. NMR Biomed. 2016;29:387-399.
7. Miller GW, Altes TA, Brookeman JR, et al. Hyperpolarized He-3 lung ventilation imaging with B-1-inhomogeneity correction in a single breath-hold scan. Magn Reson Mater Phy. 2004;16:218-226.
8. Johnson KM, Fain SB, Schiebler ML, Nagle S. Optimized 3D ultrashort echo time pulmonary MRI. Magn Reson Med. 2013;70:1241-1250.
9. Marshall H, Ajraoui S, Deppe MH, et al. K-Space filter deconvolution and flip angle self-calibration in 2D radial hyperpolarised 3He lung MRI. NMR Biomed. 2012;25:389-399.
10. Cleveland ZI, Cofer GP, Metz G, et al. Hyperpolarized Xe-129 MR imaging of alveolar gas uptake in humans. PLOS One. 2010;5:e12192.
11. Lethmate R, Ratiney H, Wajer FTAW, et al. Dynamic magnetic resonance imaging with radial scanning: A post-acquisition keyhole approach. Magn Reson Mater Phy. 2003;16:21-28.
12. Song HK, Dougherty L. K-Space weighted image contrast (KWIC) for contrast manipulation in projection reconstruction MRI. Magn Reson Med. 2000;44:825-832.
13. Zwart NR, Johnson KO, Pipe JG. Efficient sample density estimation by combining gridding and an optimized kernel. Magn Reson Med. 2012;67:701-710.
14. Zwart NR, Pipe JG. Graphical programming interface: A development environment for MRI methods. Magn Reson Med. 2015;74:1449-1460.
15. Fessler JA, Sutton BP. Nonuniform fast Fourier transforms using min-max interpolation. IEEE Trans Signal Process. 2003;51:560-574.
16. Ruppert K. Biomedical imaging with hyperpolarized noble gases. Rep Prog Phys. 2014;77:116701.
17. Loew W, Thomen R, Giaquinto R, et al. A dual loop T/R-xenon coil for homogenous excitation with improved comfort and size. Proc. Int. Soc. Magn Reson Med 24. Singapore 2016. 1624.
Figures