4139
Quantifying Hyperpolarized 129Xe Gas Exchange MRI Across Platforms, Field Strength, and Acquisition Parameters1Biomedical Engineering, Duke University, Durham, NC, United States, 2Electrical and Computer Engineering, Duke University, Durham, NC, United States, 3Department of Biostatistics & Bioinformatics, Duke University Medical Center, Durham, NC, United States, 4Radiology, Duke University Medical Center, Durham, NC, United States
Synopsis
Quantitative analysis of 129Xe gas exchange MRI has previously employed linear binning, using thresholds derived from the mean and standard deviation of a healthy reference population. However, such distributions can be skewed from a purely Gaussian shape by differences in acquisition strategy and field strength, thereby complicating threshold determination. Here we demonstrate a generalization of previous binning methods by applying a Box-Cox transformation to derive non-linearly spaced reference thresholds. We provide new thresholds appropriate for 3T acquisitions and demonstrate the robustness of the approach by showing consistent quantification of subjects scanned longitudinally across platforms, field strengths, and acquisition parameters.
Introduction
Hyperpolarized 129Xe MRI has emerged as a powerful means to quantify both ventilation and gas exchange through its uptake in interstitial barrier tissues and transfer to red blood cells (RBCs) [1]. Recent quantitative analysis approaches have employed linear binning methods with threshold values derived from a healthy reference cohort [2, 3]. Historically, such thresholds were derived from the mean and standard deviation of the healthy reference distribution, which were generally assumed to be Gaussian in nature. However, recent work has shown that this assumption, particularly for ventilation imaging, depends on the acquisition strategy (2D vs 3D and spoiled vs steady-state). Moreover, the barrier and RBC signal distributions are known to be affected by TR and flip angle, and are slightly altered at 3 versus 1.5 Tesla [4]. In this work, we sought to generalize the approach to determining appropriate binning thresholds from healthy reference cohorts and demonstrate robust quantitative analysis of 129Xe gas exchange MRI across acquisition parameters and field strengths.Methods
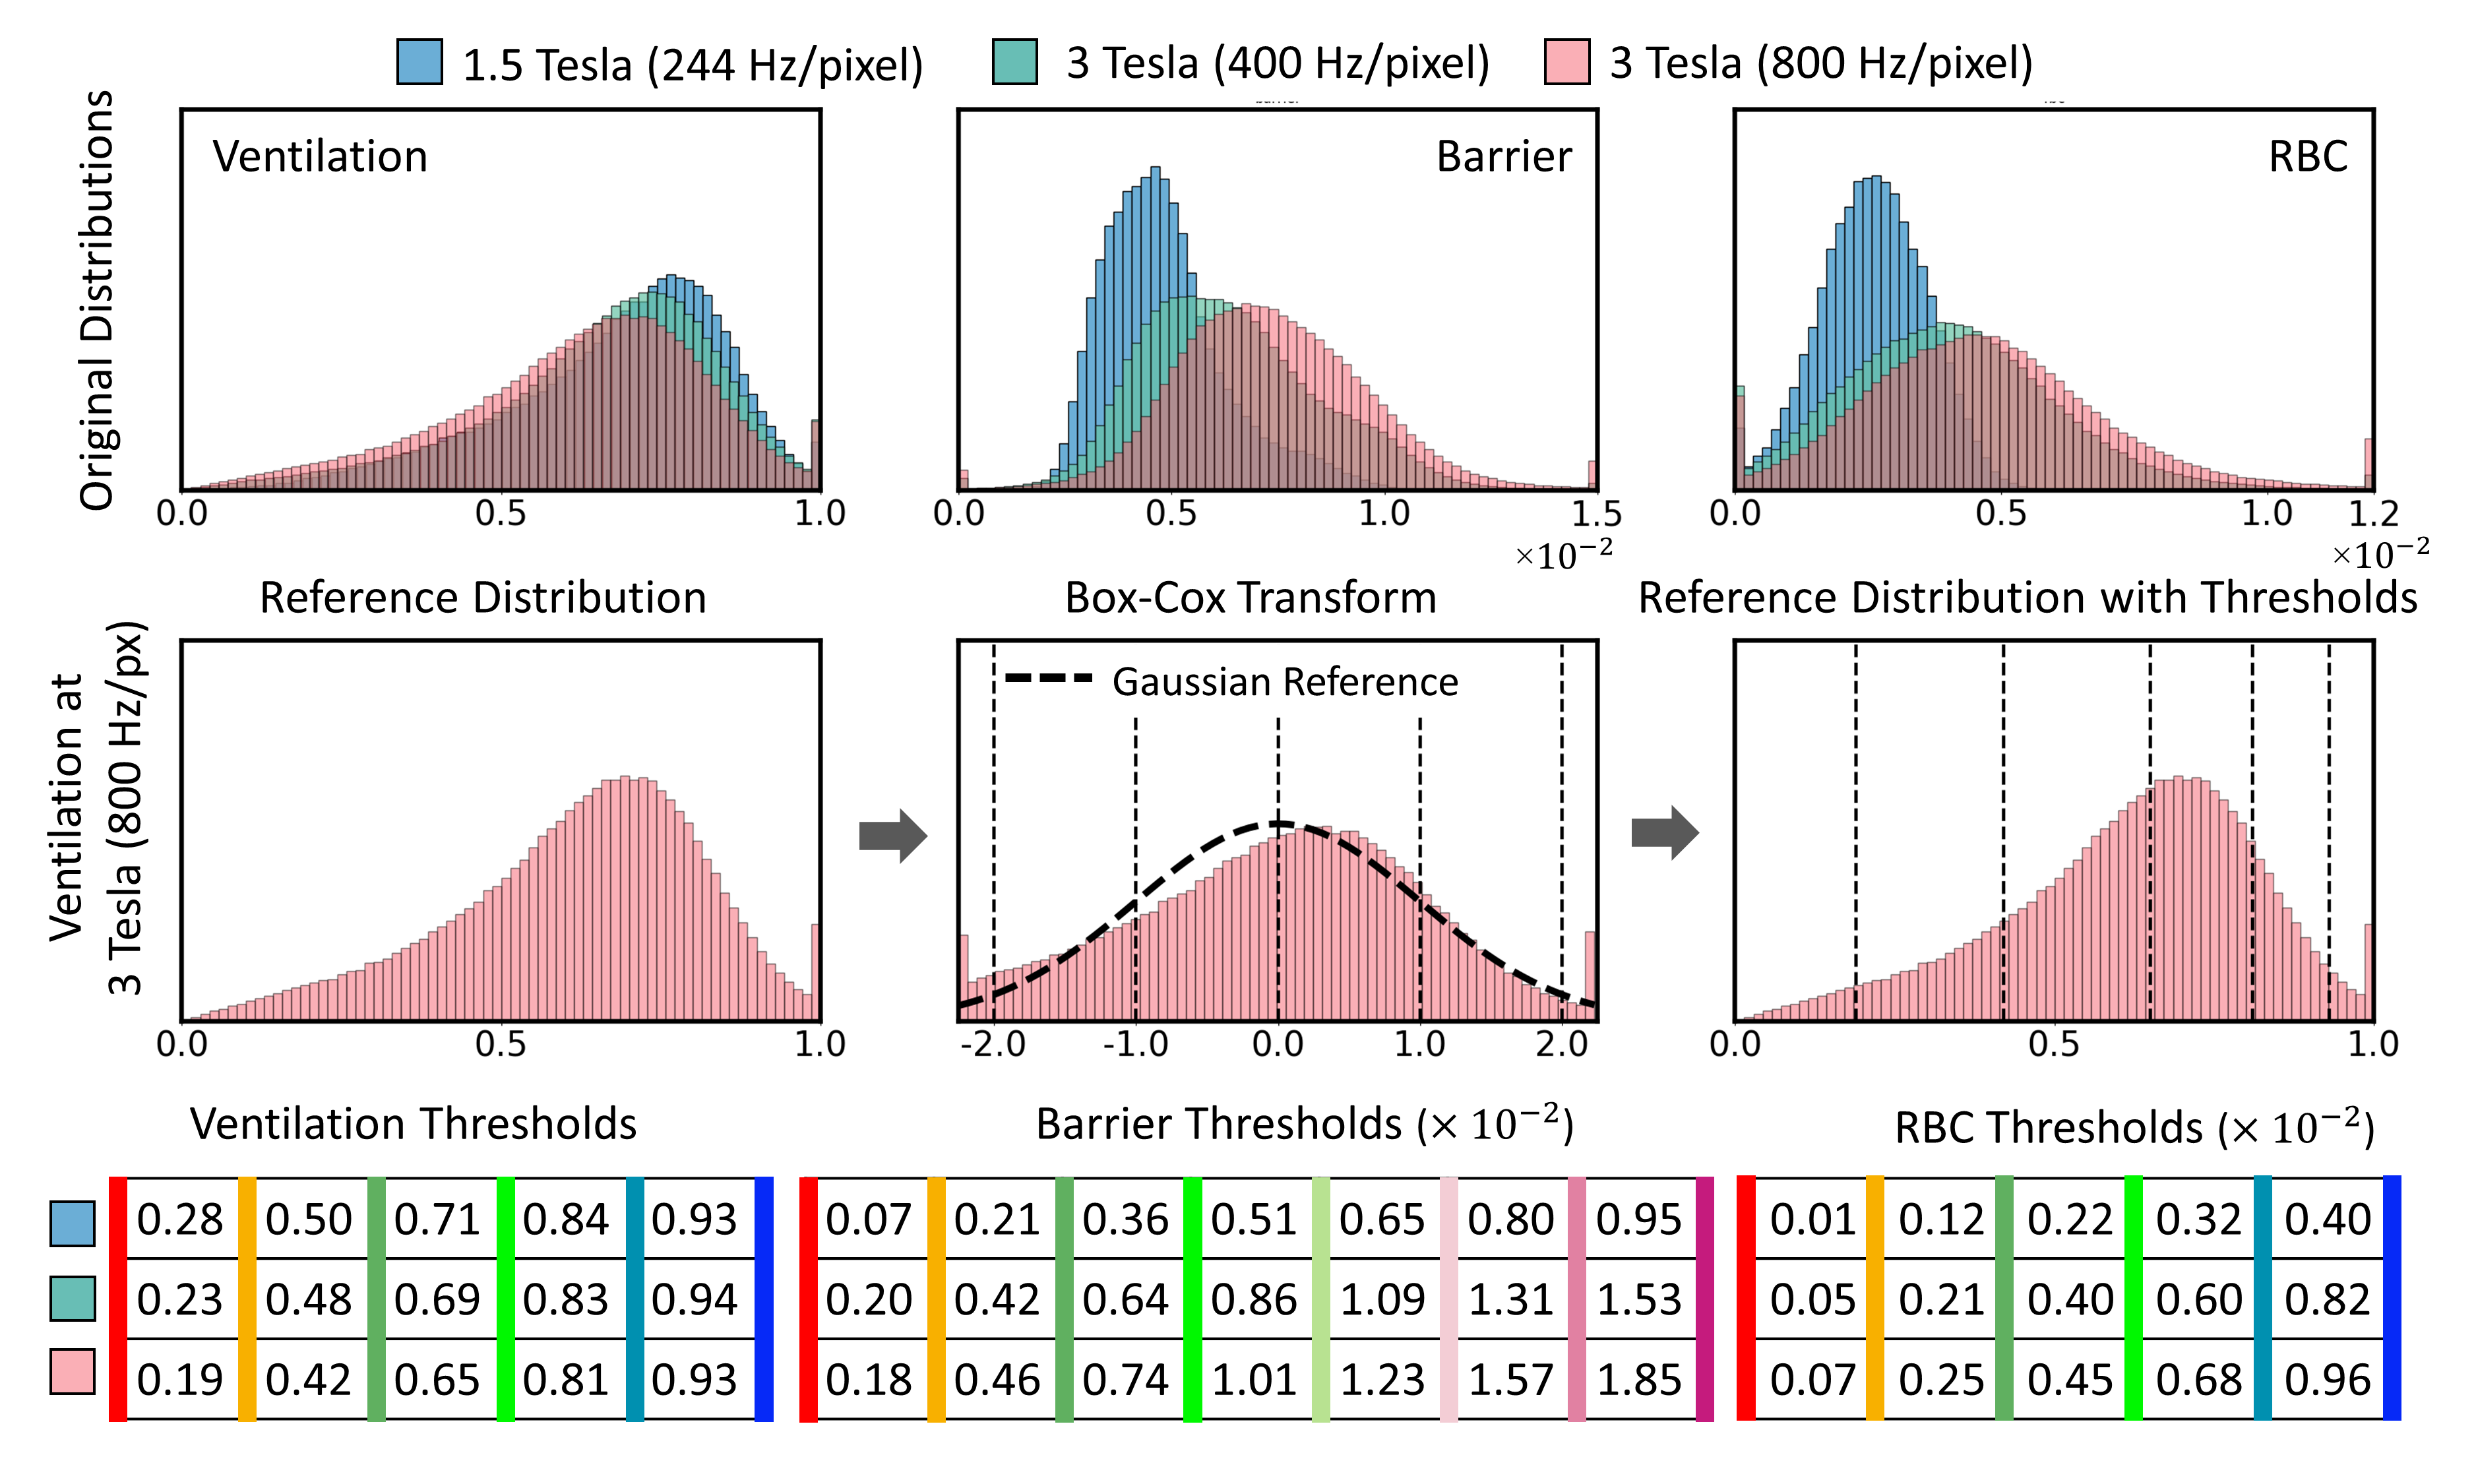
The study incorporated 129Xe MRI scans from 21 healthy subject to establish reference distributions at 1.5 and 3 Tesla. They were grouped into 3 cohorts of field strength and readout bandwidth settings: 1) n = 10 (age 29 ± 8 years) at 1.5 Tesla (GE Healthcare 15M4 EXCITE) with 244 Hz/px; 2) n = 6 (age = 37 ± 15) at 3 Tesla (SIEMENS MAGNETOM Trio) with 400 Hz/px; 3) n = 5 (age = 38 ± 16) at the same 3 Tesla scanner with 800 Hz/px. Each 129Xe image was reconstructed and processed as previously described [4] to examine the ventilation, barrier-uptake and RBC-transfer distributions [3]. The RBC transfer distributions at 3 Tesla were found to be skewed, which was also true for the 3D ventilation distributions after bias-field correction [5]. To accommodate this skewing, a one-parameter Box-Cox transform [6] was applied to render them approximately Gaussian. From this, the mean and standard deviations could be determined, and thresholds were calculated as previously described [3]. Transforming the thresholds back to the original non-Gaussian distribution resulted in unevenly spaced thresholds that encompassed the percentiles 68%, 95% and 99.7% of the underlying distribution. These percentiles are identical to those encompassed by 1-, 2-, and 3- standard deviation portions of a purely Gaussian distribution. For each distribution and cohort, the thresholds were used to identify regions of Defects (lowest bin), Low intensity (second lowest bin) and High intensity (highest 2 bins). To illustrate the efficacy of the approach, it was applied to longitudinal scans of two subjects, not included in the reference distributions, (a healthy 66 y/o and a 57 y/o patient with alpha-1 antitrypsin deficiency) who were imaged at both field strengths and all parameter settings.Results
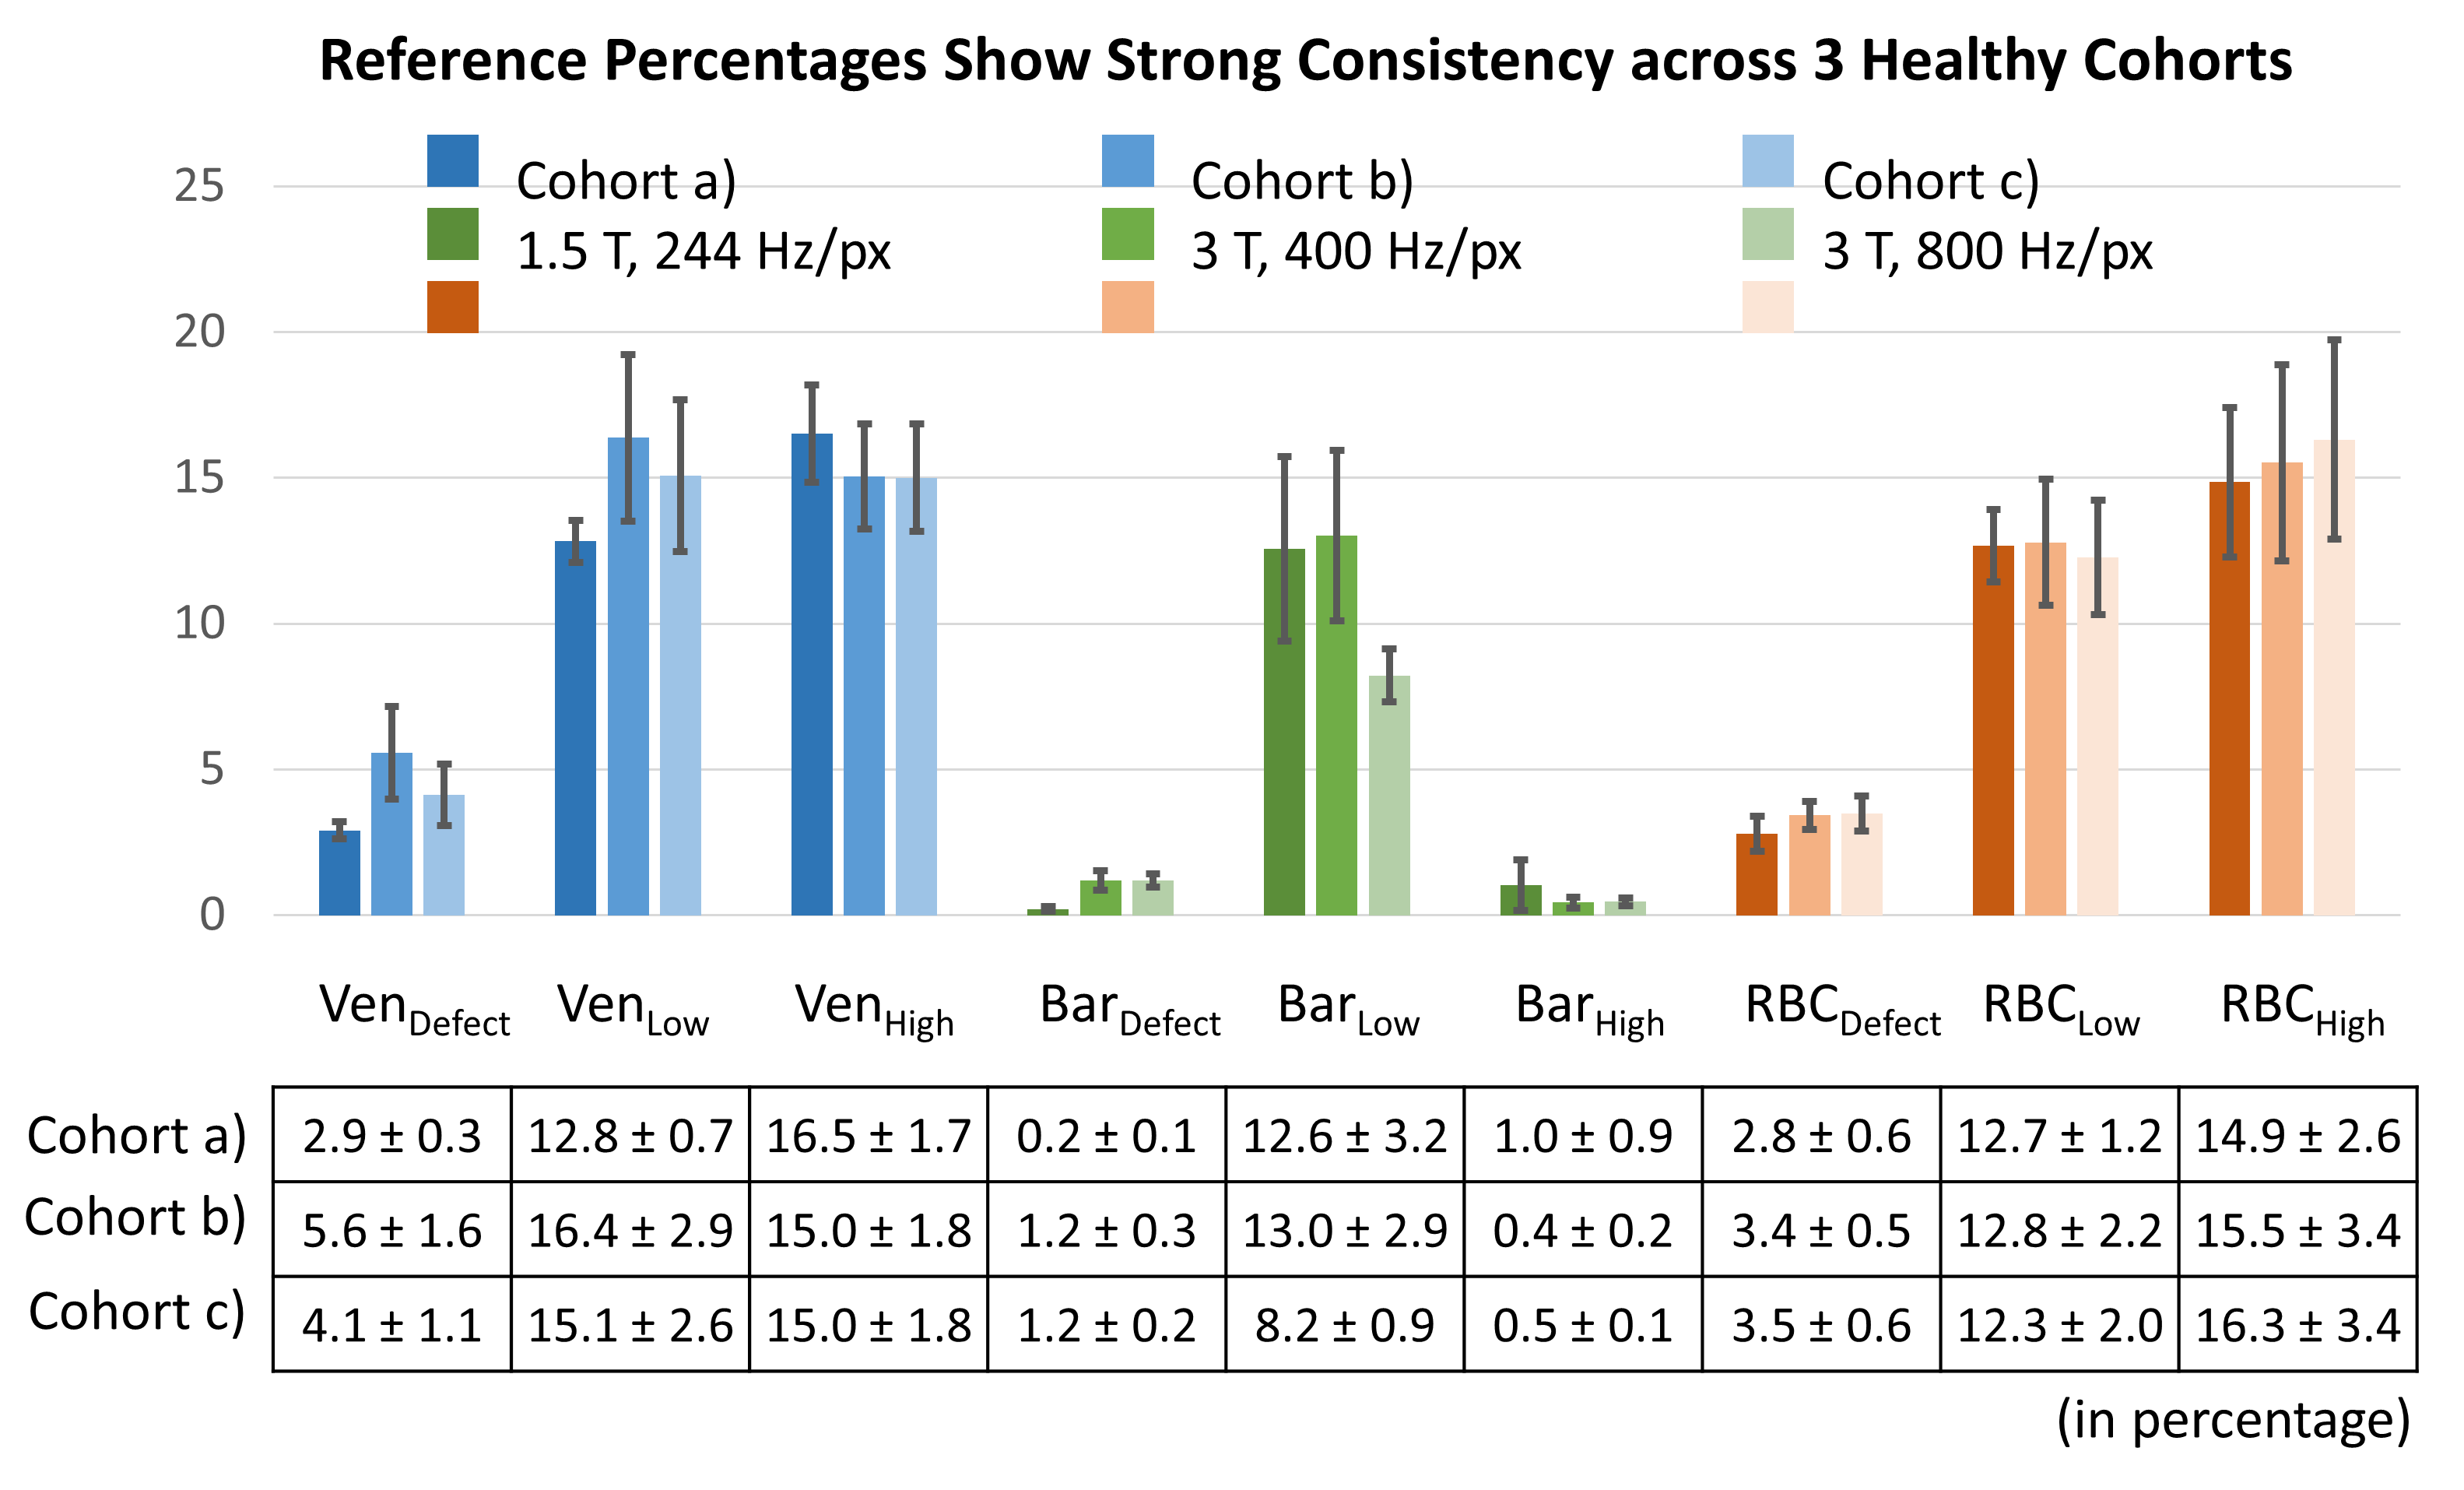
Figure 1 shows the collective distributions of the 3 healthy cohorts at both field strengths and acquisition strategies. The middle row shows the transformation of the 3 Tesla ventilation distribution into a Gaussian shape by Box-Cox transformation, deriving thresholds, and reverse-transformation to arrive at appropriate thresholds for the original distribution. Figure 2 shows the healthy reference percentages (Defect, Low, and High) derived from each binning map (ventilation, barrier and RBC) and cohort. The reference percentages are highly consistent across the 3 cohorts despite differences in the underlying acquisitions and distributions. Figure 3 shows maps of the healthy subject imaged at both field strengths and acquisition parameters as well as plots of each derived metric. The images depict minor apical ventilation defects across all scans, but consistently normal barrier uptake and RBC transfer. Figure 4 shows similar longitudinal data for the alpha-1 patient. The images show consistent patterns of ventilation defects, and deficiencies in barrier uptake (emphysema) with matching areas of low RBC transfer.Discussion
Employing a healthy reference distribution is a powerful and robust means to quantify functional images. However, such distributions can be shifted or skewed by acquisition parameters (field strength, bandwidth, TE, TR and flip angle) or post-processing factors such as bias-field correction. Such distributions must therefore be acquired in a standardized way for both healthy subjects and patients. To accommodate the non-Gaussian nature of the reference distributions requires generalizing previous methods that used the mean and standard deviation to determine thresholds. This is readily handled by using a Box-Cox transform, which effectively results in identifying thresholds based on Gaussian percentiles (68–95–99.7%). The revised thresholds, which are no longer linearly spaced, provide a more robust and adaptive representation of the healthy reference without making assumptions about the shape of the underlying reference distribution.Acknowledgements
IH/NHLBI R01 HL105643, NIH/NHLBI R01HL126771, and HHSN268201700001CReferences
1. Kaushik, S.S., et al., Single-breath clinical imaging of hyperpolarized (129)Xe in the airspaces, barrier, and red blood cells using an interleaved 3D radial 1-point Dixon acquisition. Magn Reson Med, 2016. 75(4): p. 1434-43.
2. He, M., et al., Extending semiautomatic ventilation defect analysis for hyperpolarized (129)Xe ventilation MRI. Acad Radiol, 2014. 21(12): p. 1530-41.
3. Wang, Z., et al., Quantitative analysis of hyperpolarized 129 Xe gas transfer MRI. Med Phys, 2017. 44(6): p. 2415-2428.
4. Wang, Z., et al., Hyperpolarized (129) Xe gas transfer MRI: the transition from 1.5T to 3T. Magn Reson Med, 2018.
5. Tustison, N.J., et al., N4ITK: Improved N3 Bias Correction. Ieee Transactions on Medical Imaging, 2010. 29(6): p. 1310-1320.
6. Box, G.E.P. and D.R. Cox, An Analysis of Transformations. Journal of the Royal Statistical Society Series B-Statistical Methodology, 1964. 26(2): p. 211-252.
Figures