4138
In vivo Validation of Upper Airway Respiratory Computational Fluid Dynamics (CFD) with Phase-Contrast MRI of Hyperpolarized 129Xe1Upper Airway Center, Cincinnati Children's Hospital Medical Center, Cincinnati, OH, United States, 2Center for Pulmonary Imaging Research, Cincinnati Children's Hospital Medical Center, Cincinnati, OH, United States, 3Departments of Bioengineering and Radiology, University of Missouri, Columbia, MO, United States, 4Division of Biostatistics, Cincinnati Children's Hospital Medical Center, Cincinnati, OH, United States, 5Imaging Research Center, Cincinnati Children's Hospital Medical Center, Cincinnati, OH, United States
Synopsis
Computational fluid dynamics (CFD) can provide clinicians with otherwise unobtainable information such as regional airway resistance and breathing effort. However, CFD has yet to be validated in vivo and has only been compared to in vitro experiments that do not represent all aspects of airway physiology.
To achieve in vivovalidation, velocities produced by CFD were compared to those measured by phase-contrast MRI of inhaled hyperpolarized 129Xe.
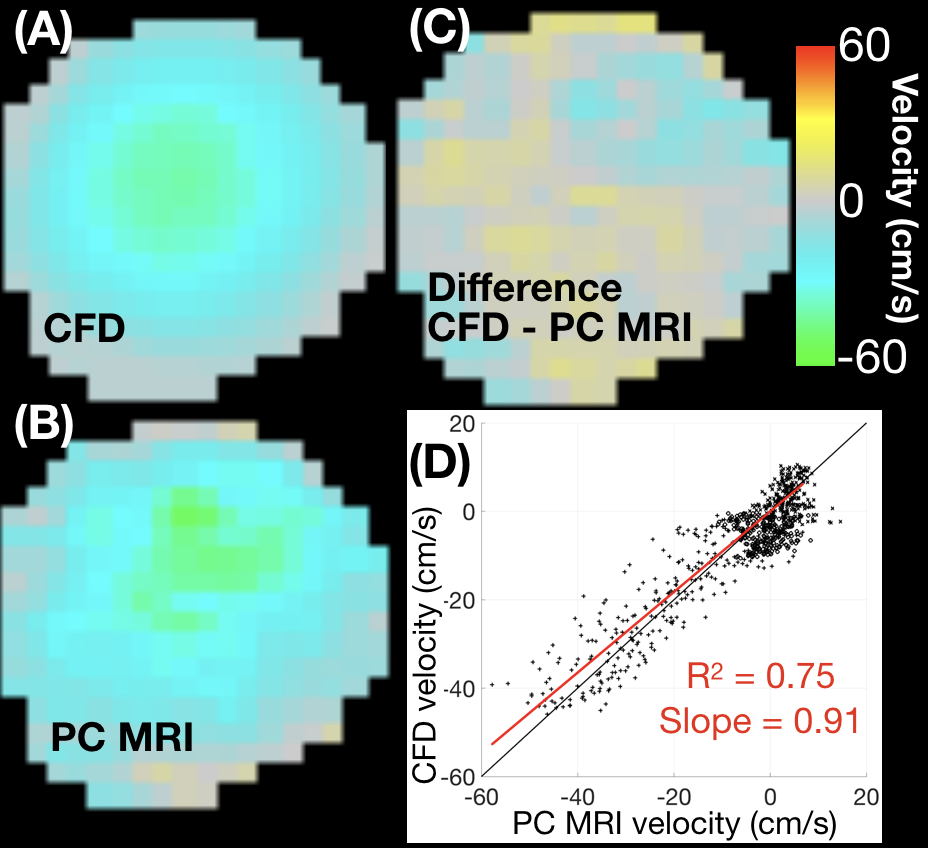
Voxelwise comparison of velocities between the two methods produced an R2 value of 0.75 and a slope of 0.91. Phase-contrast MRI produces a benchmark that allows validation and optimization of CFD simulations.
Introduction
Computational fluid dynamics (CFD) simulations are approved by the Food and Drug Administration for clinical use in cardiovascular medicine1–4 and for device design5, but are not currently used in respiratory care. Although CFD simulations of respiratory airflow can provide information that could influence clinical practice,6–9 to date these simulations have not been validated in vivodue to the difficulties of using instrumentation within the airway to make direct pressure or velocity measurements for comparison. Instead, respiratory CFD simulations have previously been compared to physical experiments designed to replicate airway physiology. However, these experiments are approximations of in vivo flow conditions, as they are rigid models, incorporate only passive motion, or neglect air humidification and heating.10–13 By contrast, phase-contrast magnetic resonance imaging (PC-MRI) is a technique that produces in vivo velocity fields and is used frequently in cardiovascular imaging to provide blood flow velocities.14,15 Since MRI requires large densities of a single nuclear isotope with a magnetic moment, PC-MRI cannot be performed using air. However, if inhaled air is replaced with hyperpolarized xenon gas (129Xe) for one inhalation, sufficient MRI signal can be obtained. This is the only method capable of noninvasively recording the velocity field of inhaled gas.
PC-MRI of inhaled hyperpolarized 129Xe gas provides the opportunity to validate CFD simulations and to quantify the errors in CFD simulations. PC-MRI of inhaled hyperpolarized gases has been performed in vivo,16,17 but these results have not been compared to CFD results beyond simulations of rigid airways in rats.18
Methods
A 34-year-old male with no respiratory abnormalities underwent PC-MRI of inhaled hyperpolarized 129Xe and proton imaging for CFD.
One liter of 129Xe was polarized to ~30% via a Polarean 9820 hyperpolarizer. The xenon was inhaled and 3-direction PC-MRI was acquired in a single inhalation (maximum 10 seconds). Velocity encoding gradients were applied via Hadamard multiplexing for increased SNR. Flow compensation was implemented to diminish the amount of flow artifacts in the image. 200cm/s velocity encoding was used for all three dimensions. Three axial and three sagittal planes in the upper airway were acquired with 1mm x 1mm in plane resolution and 10mm slices. Applied flip angles ranged from 10-25°. Image acquisition began ~2seconds after starting inhalation in order for the xenon to flow into the imaging plane(s). A single-loop xenon coil was positioned next to the side of the subject’s face and neck. Xenon was orally inhaled from a bag via an MRI compatible pneumotach that recorded the flowrate. The subject’s head was fixed to prevent movement between 129Xe and proton acquisitions.
Proton MRI was obtained to provide the geometry for CFD simulations. Anatomical 1H T1-weighted gradient-recalled echo images were obtained using the body coil to avoid moving the subject. The images were acquired with a 5° flip angle and shortest possible TR/TE. The images were acquired with isotropic 0.8mm voxels covering the entire airway while the subject held their mouth open as if inhaling. The image was segmented using ITK-snap and an oral airway geometry created. CFD simulations were run in this geometry using Star-CCM+ with the flowrate recorded by the pneumotach as the inlet boundary condition, and the physical properties of 129Xe (density=5.76kg/m3, dynamic viscosity=2.28x10⁻⁵Pa·s).
CFD spatiotemporal resolution is much higher than PC-MRI (<0.1mm3, 0.1ms vs 10mm3, 310ms), therefore the average CFD velocity was calculated for the duration of each MRI acquisition and the volume of each voxel. Voxelwise comparison was then performed between averaged CFD velocities and PC-MRI velocities.
Results
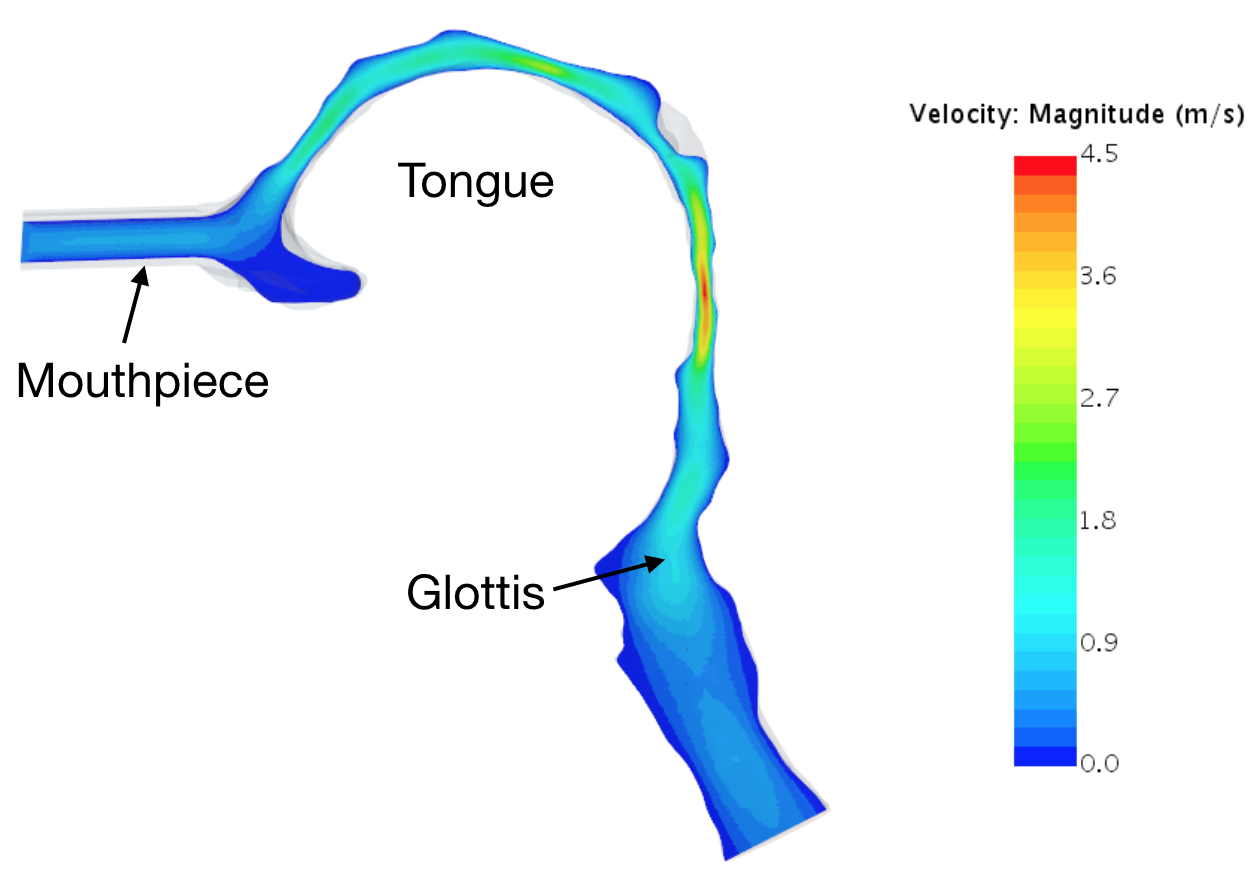
Figure 1 shows the segmented oral airway and mouthpiece, with contours of CFD velocity calculations on a sagittal plane. Figure 2 shows voxelwise comparison of CFD and PC-MRI velocity data on an axial plane in the retroglossal airway. These results yielded a slope of 0.91 (standard error: 0.029, p-value=<0.0001) and an R2 value of 0.75.Conclusions
Comparison between CFD velocity fields and PC-MRI demonstrates good agreement between the velocity fields. While the R2 value is reasonably high, Figure 2 shows some differences in the local flow patterns. The assumptions governing CFD simulations (airway rigidity, steady vs reciprocating flow, air heating and humidity) can now be varied and results compared against the benchmark PC-MRI results to determine which physiological factors must be considered in CFD models to yield results with the desired accuracy. The high density of 129Xe compared to air meant that the ratio of inertial to viscous forces (Reynolds number) was much greater than in air-breathing. Future experiments could match air-breathing Reynolds numbers by mixing 129Xe with helium.Acknowledgements
The authors would like to thank the Cincinnati Children's Research Foundation.References
1. Douglas PS, De Bruyne B, Pontone G, et al. 1-Year Outcomes of FFR CT -Guided Care in Patients With Suspected Coronary Disease. J Am Coll Cardiol. 2016;68(5):435-445. doi:10.1016/j.jacc.2016.05.057.
2. Hlatky MA, De Bruyne B, Pontone G, et al. Quality-of-Life and Economic Outcomes of Assessing Fractional Flow Reserve With Computed Tomography Angiography. J Am Coll Cardiol. 2015;66(21):2315-2323. doi:10.1016/j.jacc.2015.09.051.
3. Pontone G, Patel MR, Hlatky MA, et al. Rationale and design of the Prospective LongitudinAl Trial of FFRCT: Outcome and Resource IMpacts study. Am Heart J. 2015;170(3):438-446.e44. doi:10.1016/J.AHJ.2015.06.002.
4. Douglas PS, Pontone G, Hlatky MA, et al. Clinical outcomes of fractional flow reserve by computed tomographic angiography-guided diagnostic strategies vs. usual care in patients with suspected coronary artery disease: the prospective longitudinal trial of FFR CT : outcome and resource impacts study. Eur Heart J. 2015;36(47):3359-3367. doi:10.1093/eurheartj/ehv444.
5. Malinauskas RA, Hariharan P, Day SW, et al. FDA Benchmark Medical Device Flow Models for CFD Validation. ASAIO J. 2017;63(2):150-160. doi:10.1097/MAT.0000000000000499.
6. Bates AJ, Comerford A, Cetto R, Schroter RC, Tolley NS, Doorly DJ. Power loss mechanisms in pathological tracheas. J Biomech. 2016;49(11):2187-2192. doi:10.1016/j.jbiomech.2015.11.033.
7. Bates AJ, Cetto R, Doorly DJ, Schroter RC, Tolley NS, Comerford A. The effects of curvature and constriction on airflow and energy loss in pathological tracheas. Respir Physiol Neurobiol. 2016;234:69-78. doi:10.1016/j.resp.2016.09.002.
8. Bates AJ, Comerford A, Cetto R, Doorly DJ, Schroter RC, Tolley NS. Computational fluid dynamics benchmark dataset of airflow in tracheas. Data Br. 2017;10:101-107. doi:10.1016/j.dib.2016.11.091.
9. Hamilton NJ, Kanani M, Roebuck DJ, et al. Tissue-Engineered Tracheal Replacement in a Child: A 4-Year Follow-Up Study. Am J Transplant. 2015;15(10):2750-2757. doi:10.1111/ajt.13318.
10. de Rochefort L, Vial L, Fodil R, et al. In vitro validation of computational fluid dynamic simulation in human proximal airways with hyperpolarized 3He magnetic resonance phase-contrast velocimetry. J Appl Physiol. 2007;102(5):2012-2023. doi:10.1152/japplphysiol.01610.2005.
11. Payan Y, Pelorson X, Perrier P. Physical Modeling of Airflow-Walls Interactions to Understand the Sleep Apnea Syndrome. In: Surgery Simulation and Soft Tissue Modeling International Symposium, IS4TM 2003. Vol ; 2003:261-269.
12. Zhao M, Barber T, Cistulli PA, Sutherland K, Rosengarten G. Simulation of upper airway occlusion without and with mandibular advancement in obstructive sleep apnea using fluid-structure interaction. J Biomech. 2013;46(15):2586-2592. doi:10.1016/j.jbiomech.2013.08.010.
13. Collier GJ, Kim M, Chung Y, Wild JM. 3D phase contrast MRI in models of human airways: Validation of computational fluid dynamics simulations of steady inspiratory flow. J Magn Reson Imaging. April 2018. doi:10.1002/jmri.26039.
14. Hartung MP, Grist TM, François CJ. Magnetic resonance angiography: current status and future directions. J Cardiovasc Magn Reson. 2011;13(1):19. doi:10.1186/1532-429X-13-19.
15. Stankovic Z, Allen BD, Garcia J, Jarvis KB, Markl M. Cardiovascular Diagnosis and Therapy.Vol 4. 2014. http://cdt.amegroups.com/article/view/3630/4523. Accessed September 14, 2018.
16. Collier GJ, Wild JM. In vivo measurement of gas flow in human airways with hyperpolarized gas MRI and compressed sensing. Magn Reson Med. 2015;73(6):2255-2261. doi:10.1002/mrm.25348.
17. De Rochefort L, Maître X, Fodil R, et al. Phase-contrast velocimetry with hyperpolarized3He for in vitro and in vivo characterization of airflow. Magn Reson Med. 2006;55(6):1318-1325. doi:10.1002/mrm.20899.
18. Minard KR, Kuprat AP, Kabilan S, et al. Phase-contrast MRI and CFD modeling of apparent 3He gas flow in rat pulmonary airways. J Magn Reson. 2012;221:129-138. doi:10.1016/j.jmr.2012.05.007.
Figures