4136
Comparison of hyperpolarised 3He and 129Xe ventilation MRI to assess lung disease in cystic fibrosis1POLARIS, Academic Radiology, University of Sheffield, Sheffield, United Kingdom, 2Sheffield Children's Hospital NHS Foundation Trust, Sheffield, United Kingdom, 3Sheffield Teaching Hospitals NHS Foundation Trust, Sheffield, United Kingdom, 4Respiratory research group, Division of infection, immunity and respiratory medicine, University of Manchester, Manchester, United Kingdom
Synopsis
Ventilation MRI using hyperpolarised gases is highly sensitive to early cystic fibrosis lung disease. With the recent move towards 129Xe from 3He, we aimed to assess both gases in parallel in patients with CF, at baseline and follow-up, to determine whether any inherent bias was present when assessing lung disease. We found that there was no inherent bias for VDP between the two gases present although at an individual level differences were evident. Despite this, when followed up at a later date both gases similarly reflected changes in ventilation, suggesting both are capable of reflecting CF lung disease severity.
Introduction
Ventilation MRI using inhaled hyperpolarised helium-3 (3He) and xenon-129 (129Xe), is highly sensitive to early lung disease in cystic fibrosis (CF)1,2 and offers a promising method for quantitative assessment of regional lung disease. There has been a recent move towards 129Xe as a clinically viable ventilation-imaging agent, however the two gases have not been assessed in parallel in patients with CF lung disease. The gases have different inherent properties and therefore will not necessarily provide the same results3. Here we assess a cohort of children and adults with a range of CF lung disease using both hyperpolarised 3He and 129Xe MRI on the same day and at a second visit approximately one year later. We aimed to evaluate the quantitative information derived from both gases and assess their relative sensitivities to longitudinal change.Methods
31 children and adults were recruited from three specialist CF centres in the UK. Hyperpolarised 3He and 129Xe ventilation MRI were performed on the same day using a bSSFP sequence on a 1.5T GE HDx scanner. 3He voxel resolution ranged from 3.3*3.3*5 - 4*4*5mm3, whilst 129Xe ranged from 3.3*3.3*10 - 4*4*10mm3. 3He sequence parameters; bandwidth=167kHz, TE/TR=0.6/1.9ms, flip angle=10°. 129Xe bandwidth=16kHz, TE/TR=2.2/6.7ms, flip angle=10°. Ventilation imaging was acquired by inhaling a titrated volume of either 3He or 129Xe with a balance of nitrogen, from a lung volume of functional residual capacity. The bag volume ranged from 0.4-1.0L and was calculated based on subjects’ height. For 3He acquisition, a 1H anatomical MR image was acquired during the same breath-hold in order to calculate the thoracic cavity volume and for 129Xe this was performed in a separate breath-hold. For quantitative analysis of the images, the 1H and ventilation images were segmented using a semi-automated method4, from which the ventilation defect percentage (VDP), the number (Ndefects) and the size of individual ventilation defects in 3D and the ventilation heterogeneity index (VHI) were calculated as recently described5. At the same visit patients also performed spirometry and multiple breath washout (using 0.2% SF6) in order to calculate lung clearance index (LCI). These methods were then repeated at a second visit at least one year later.Results
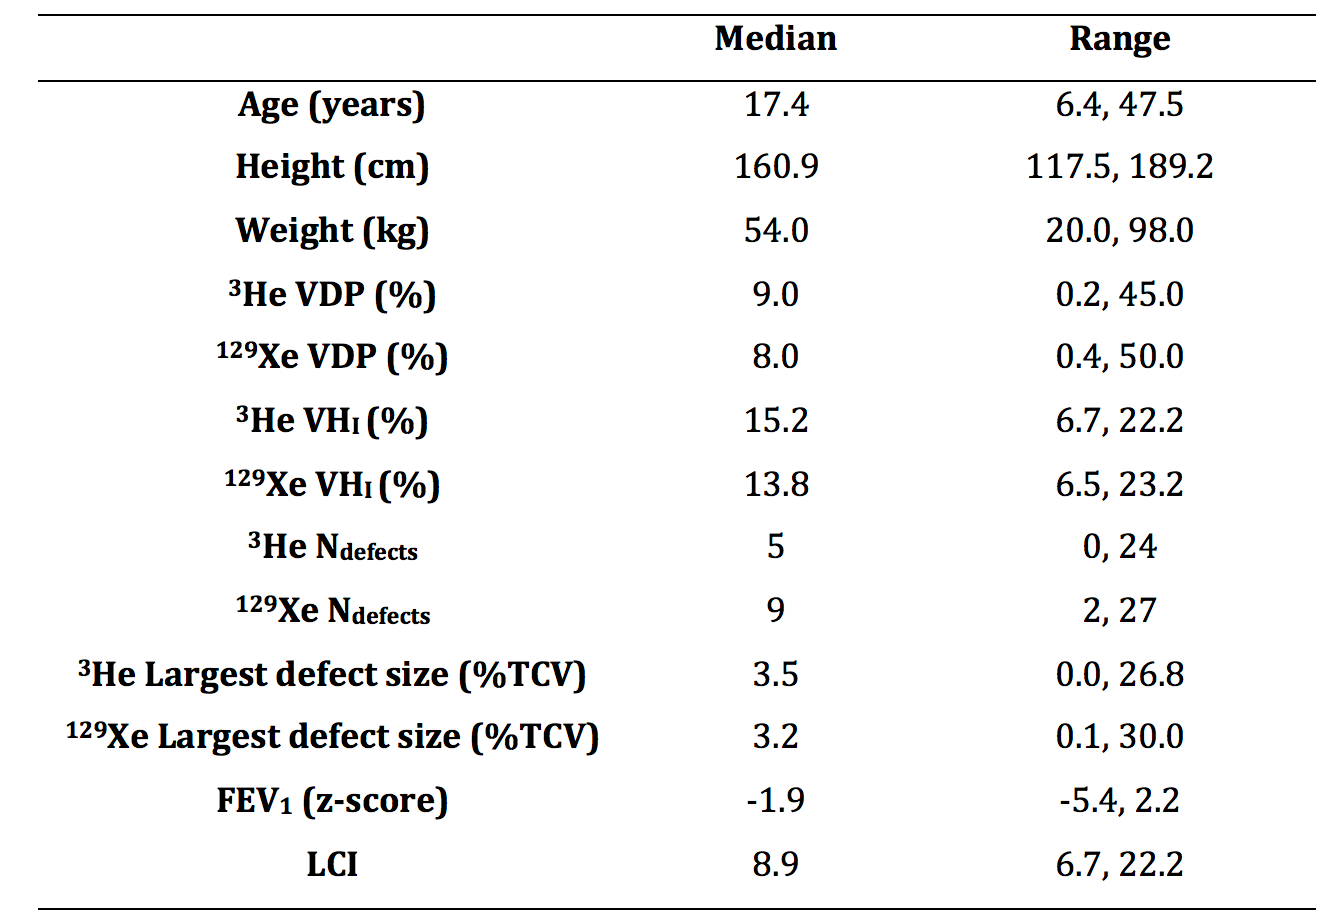
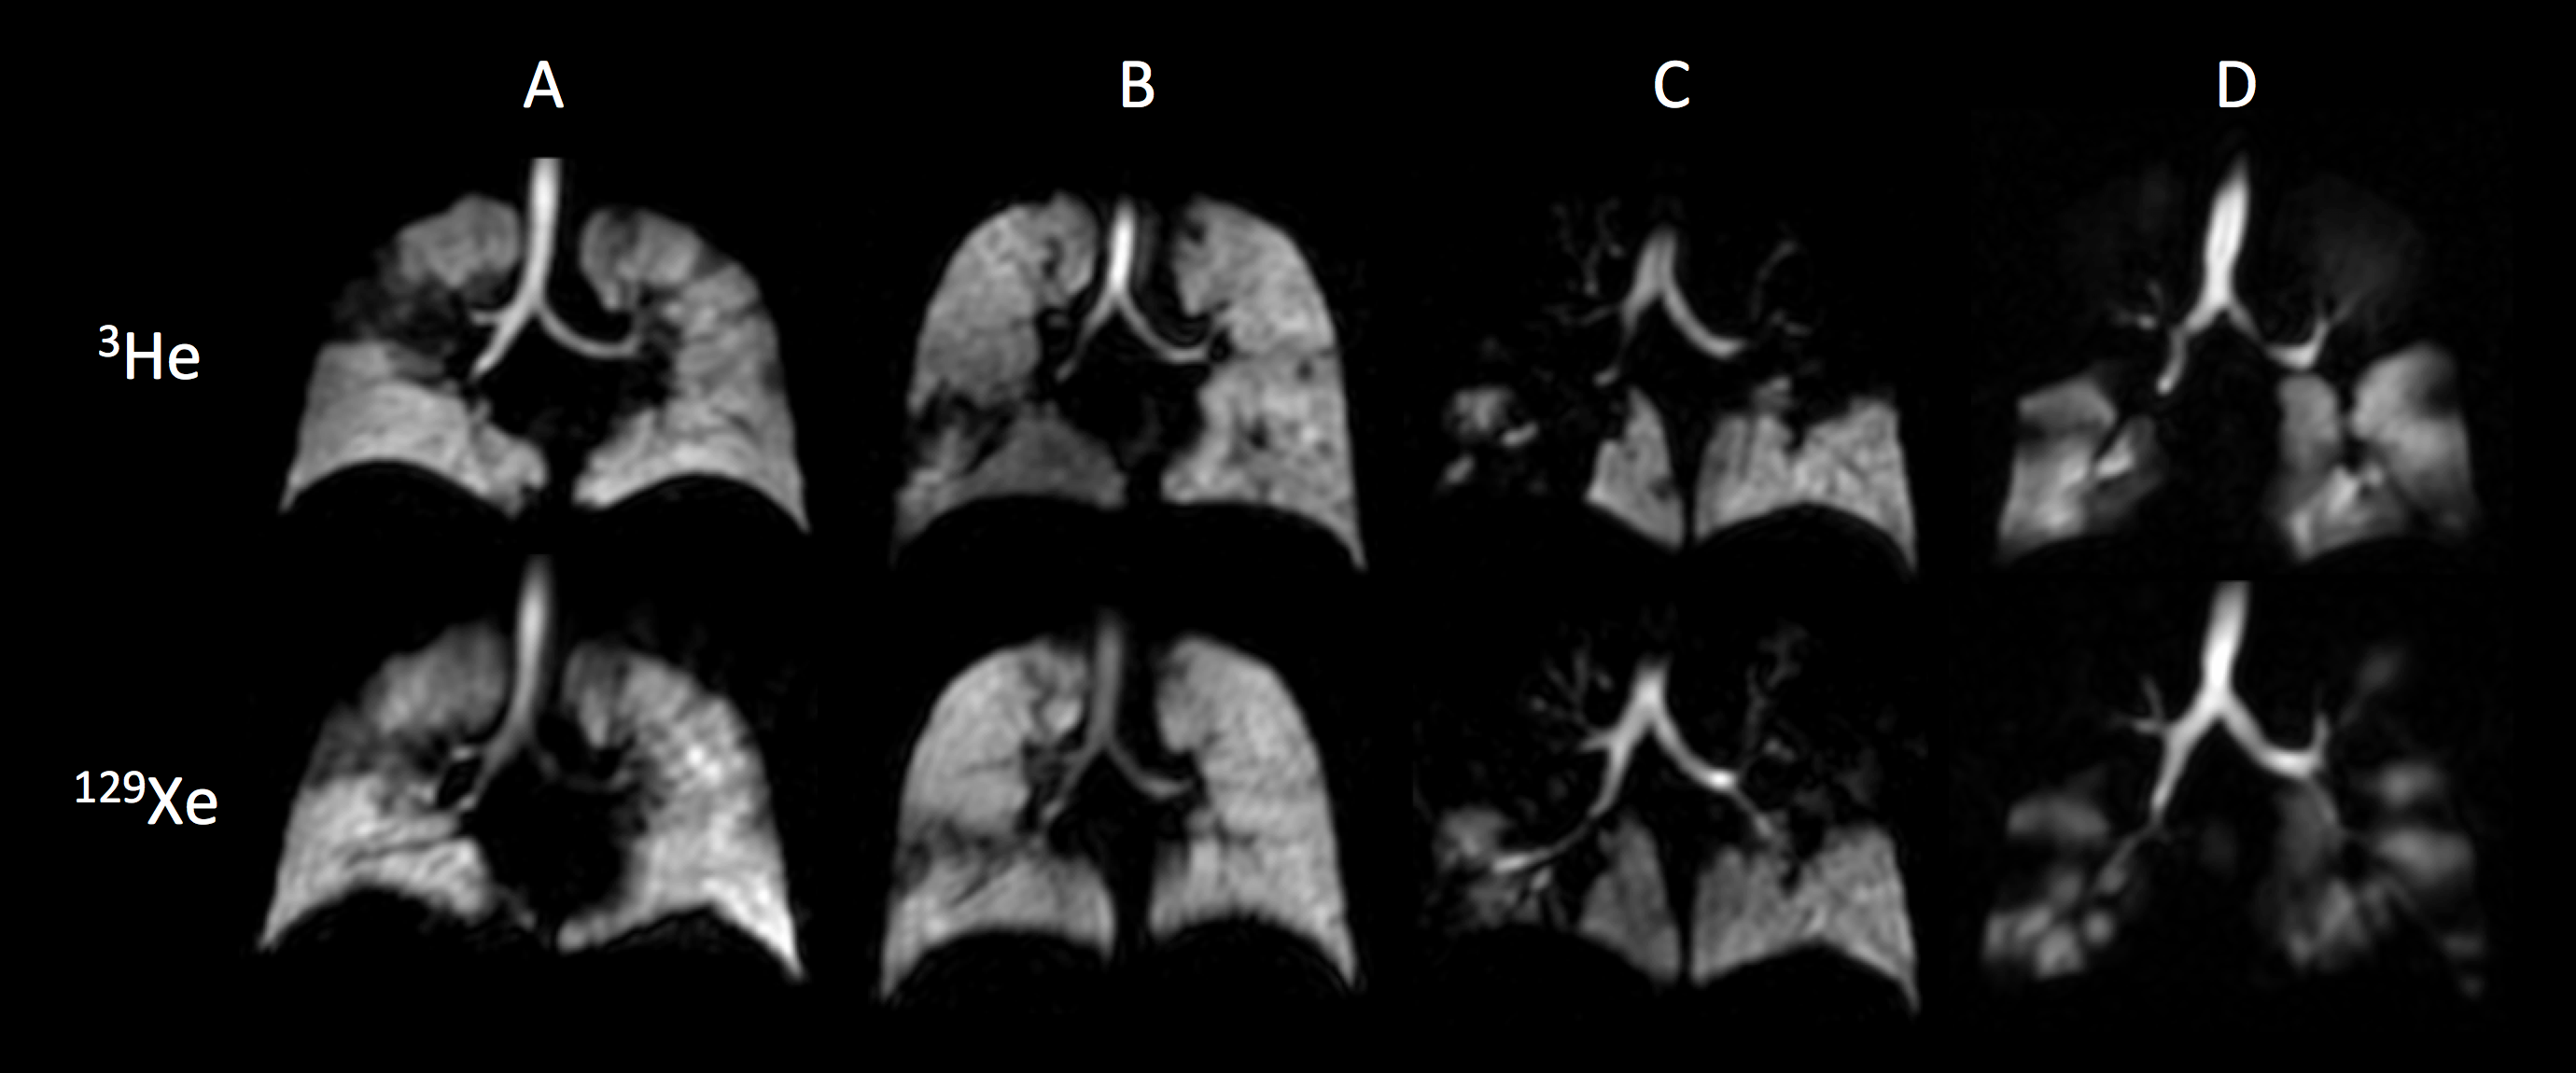
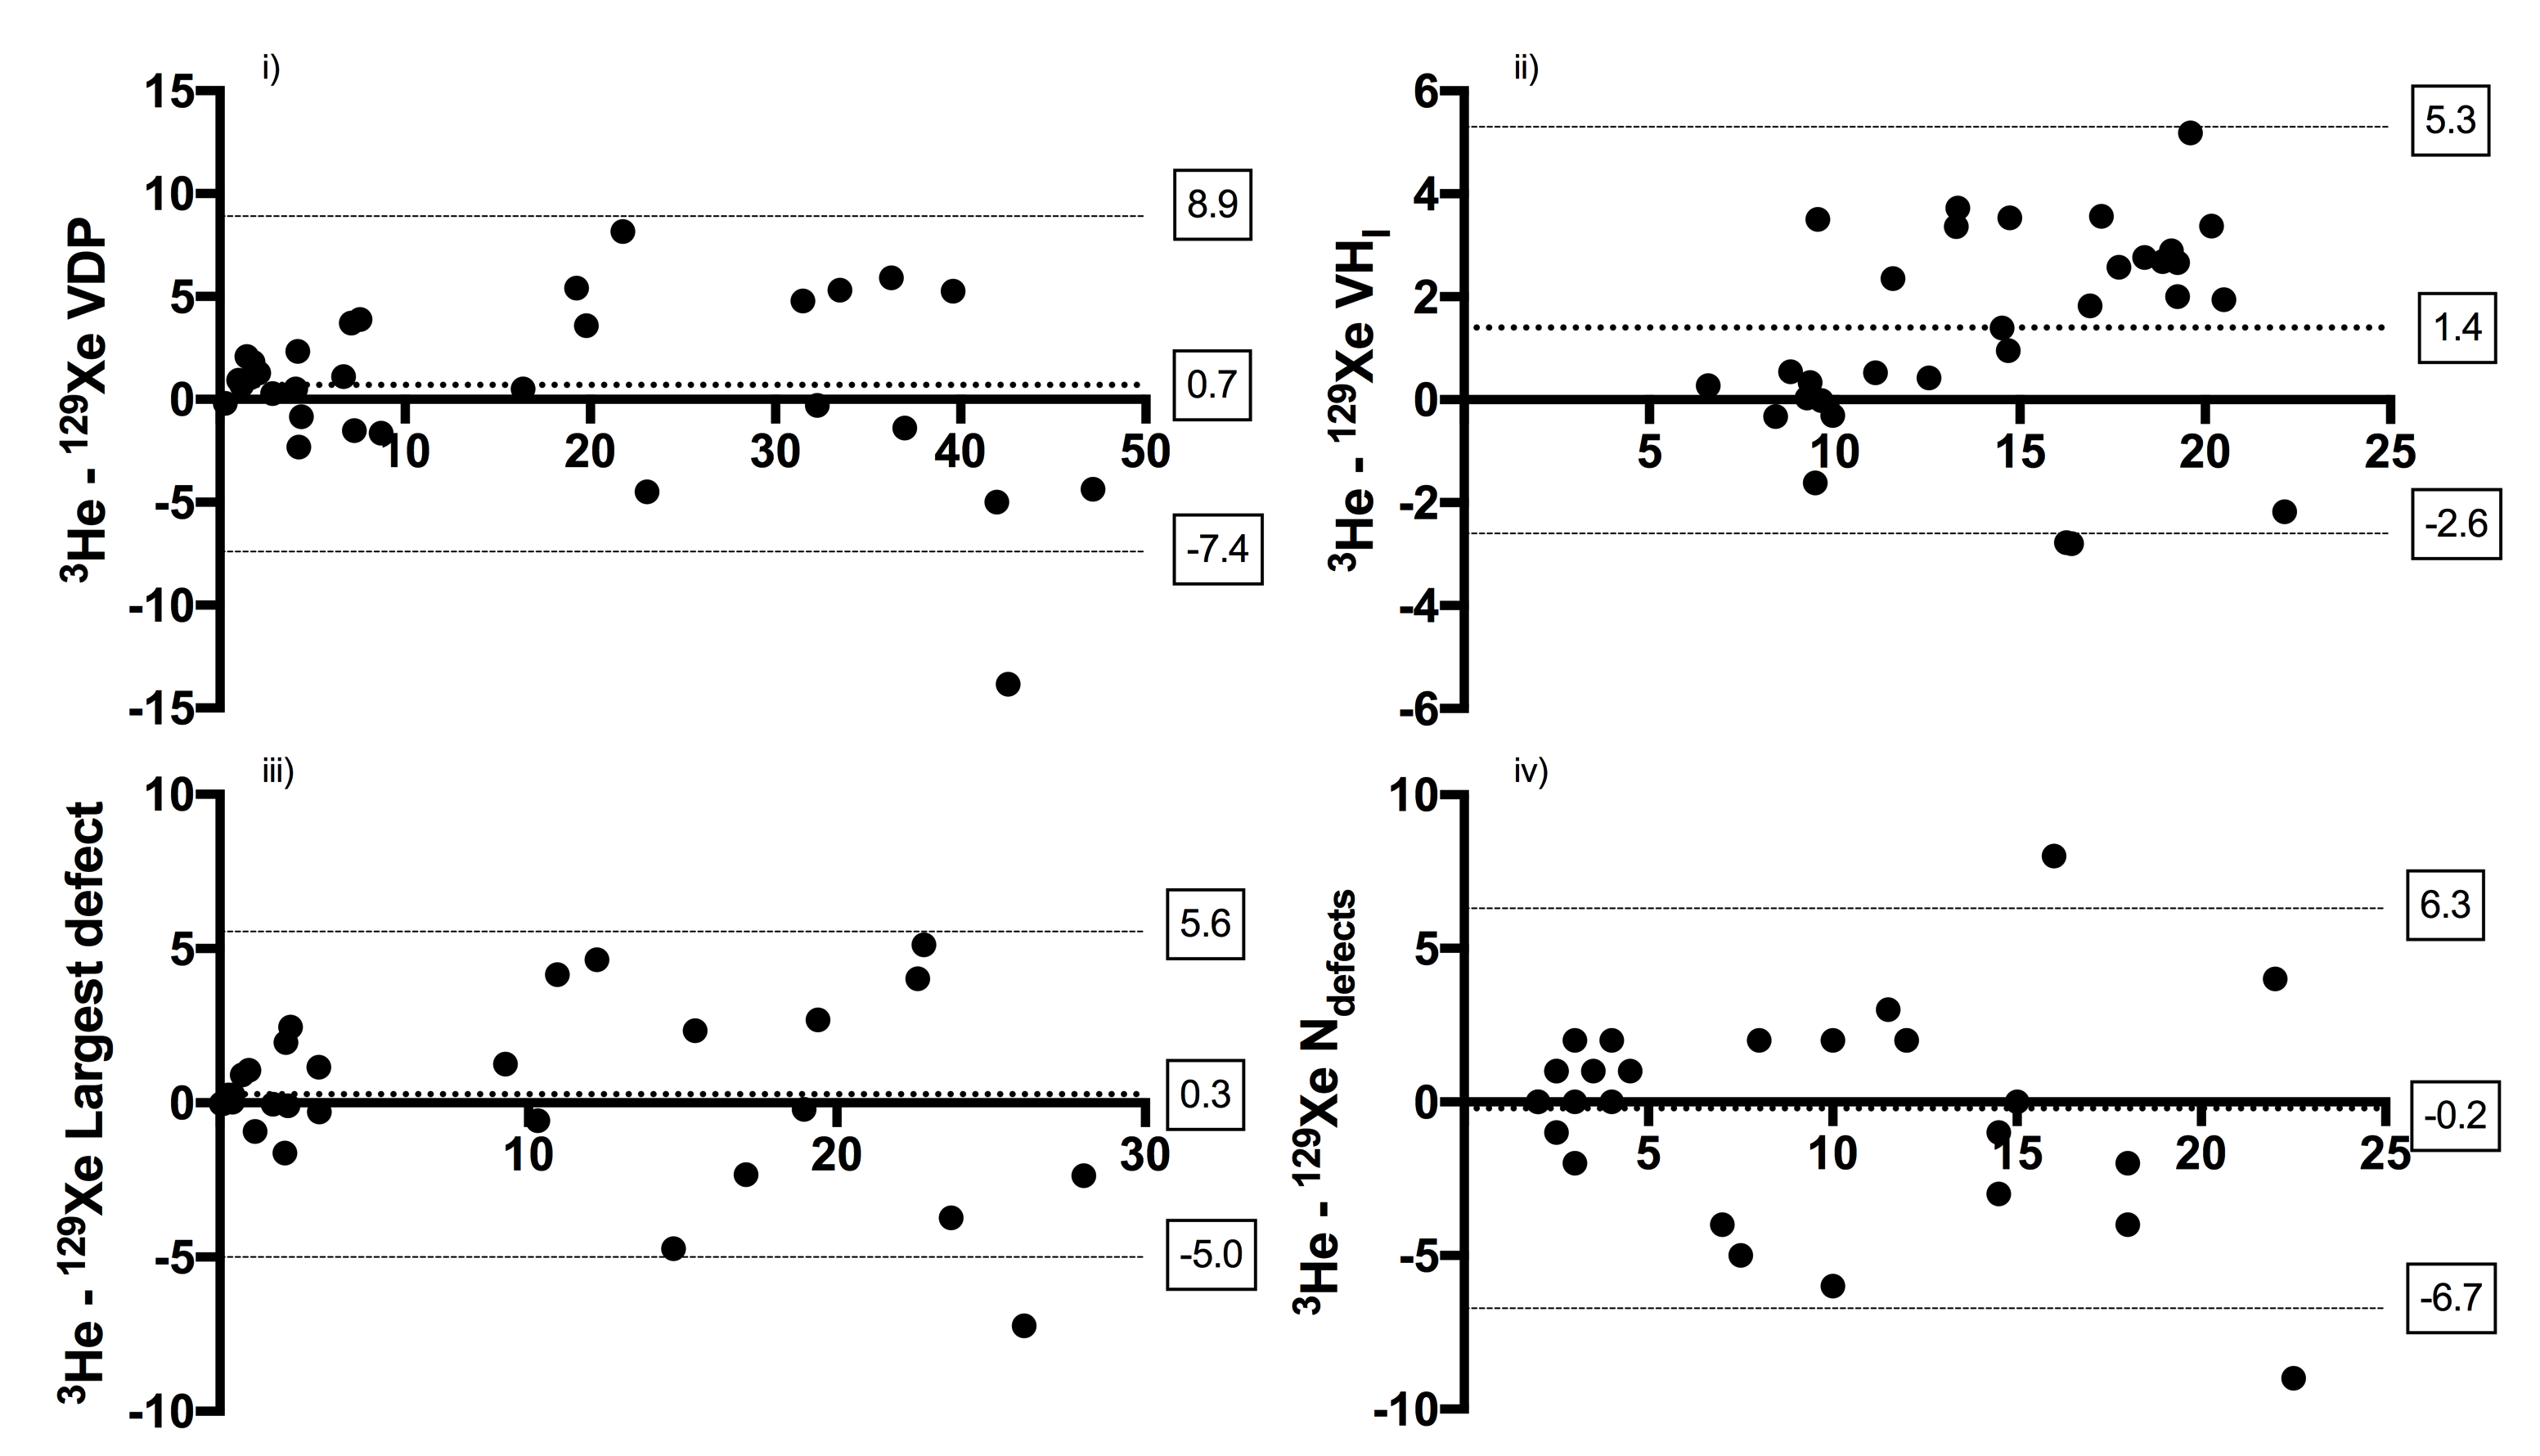
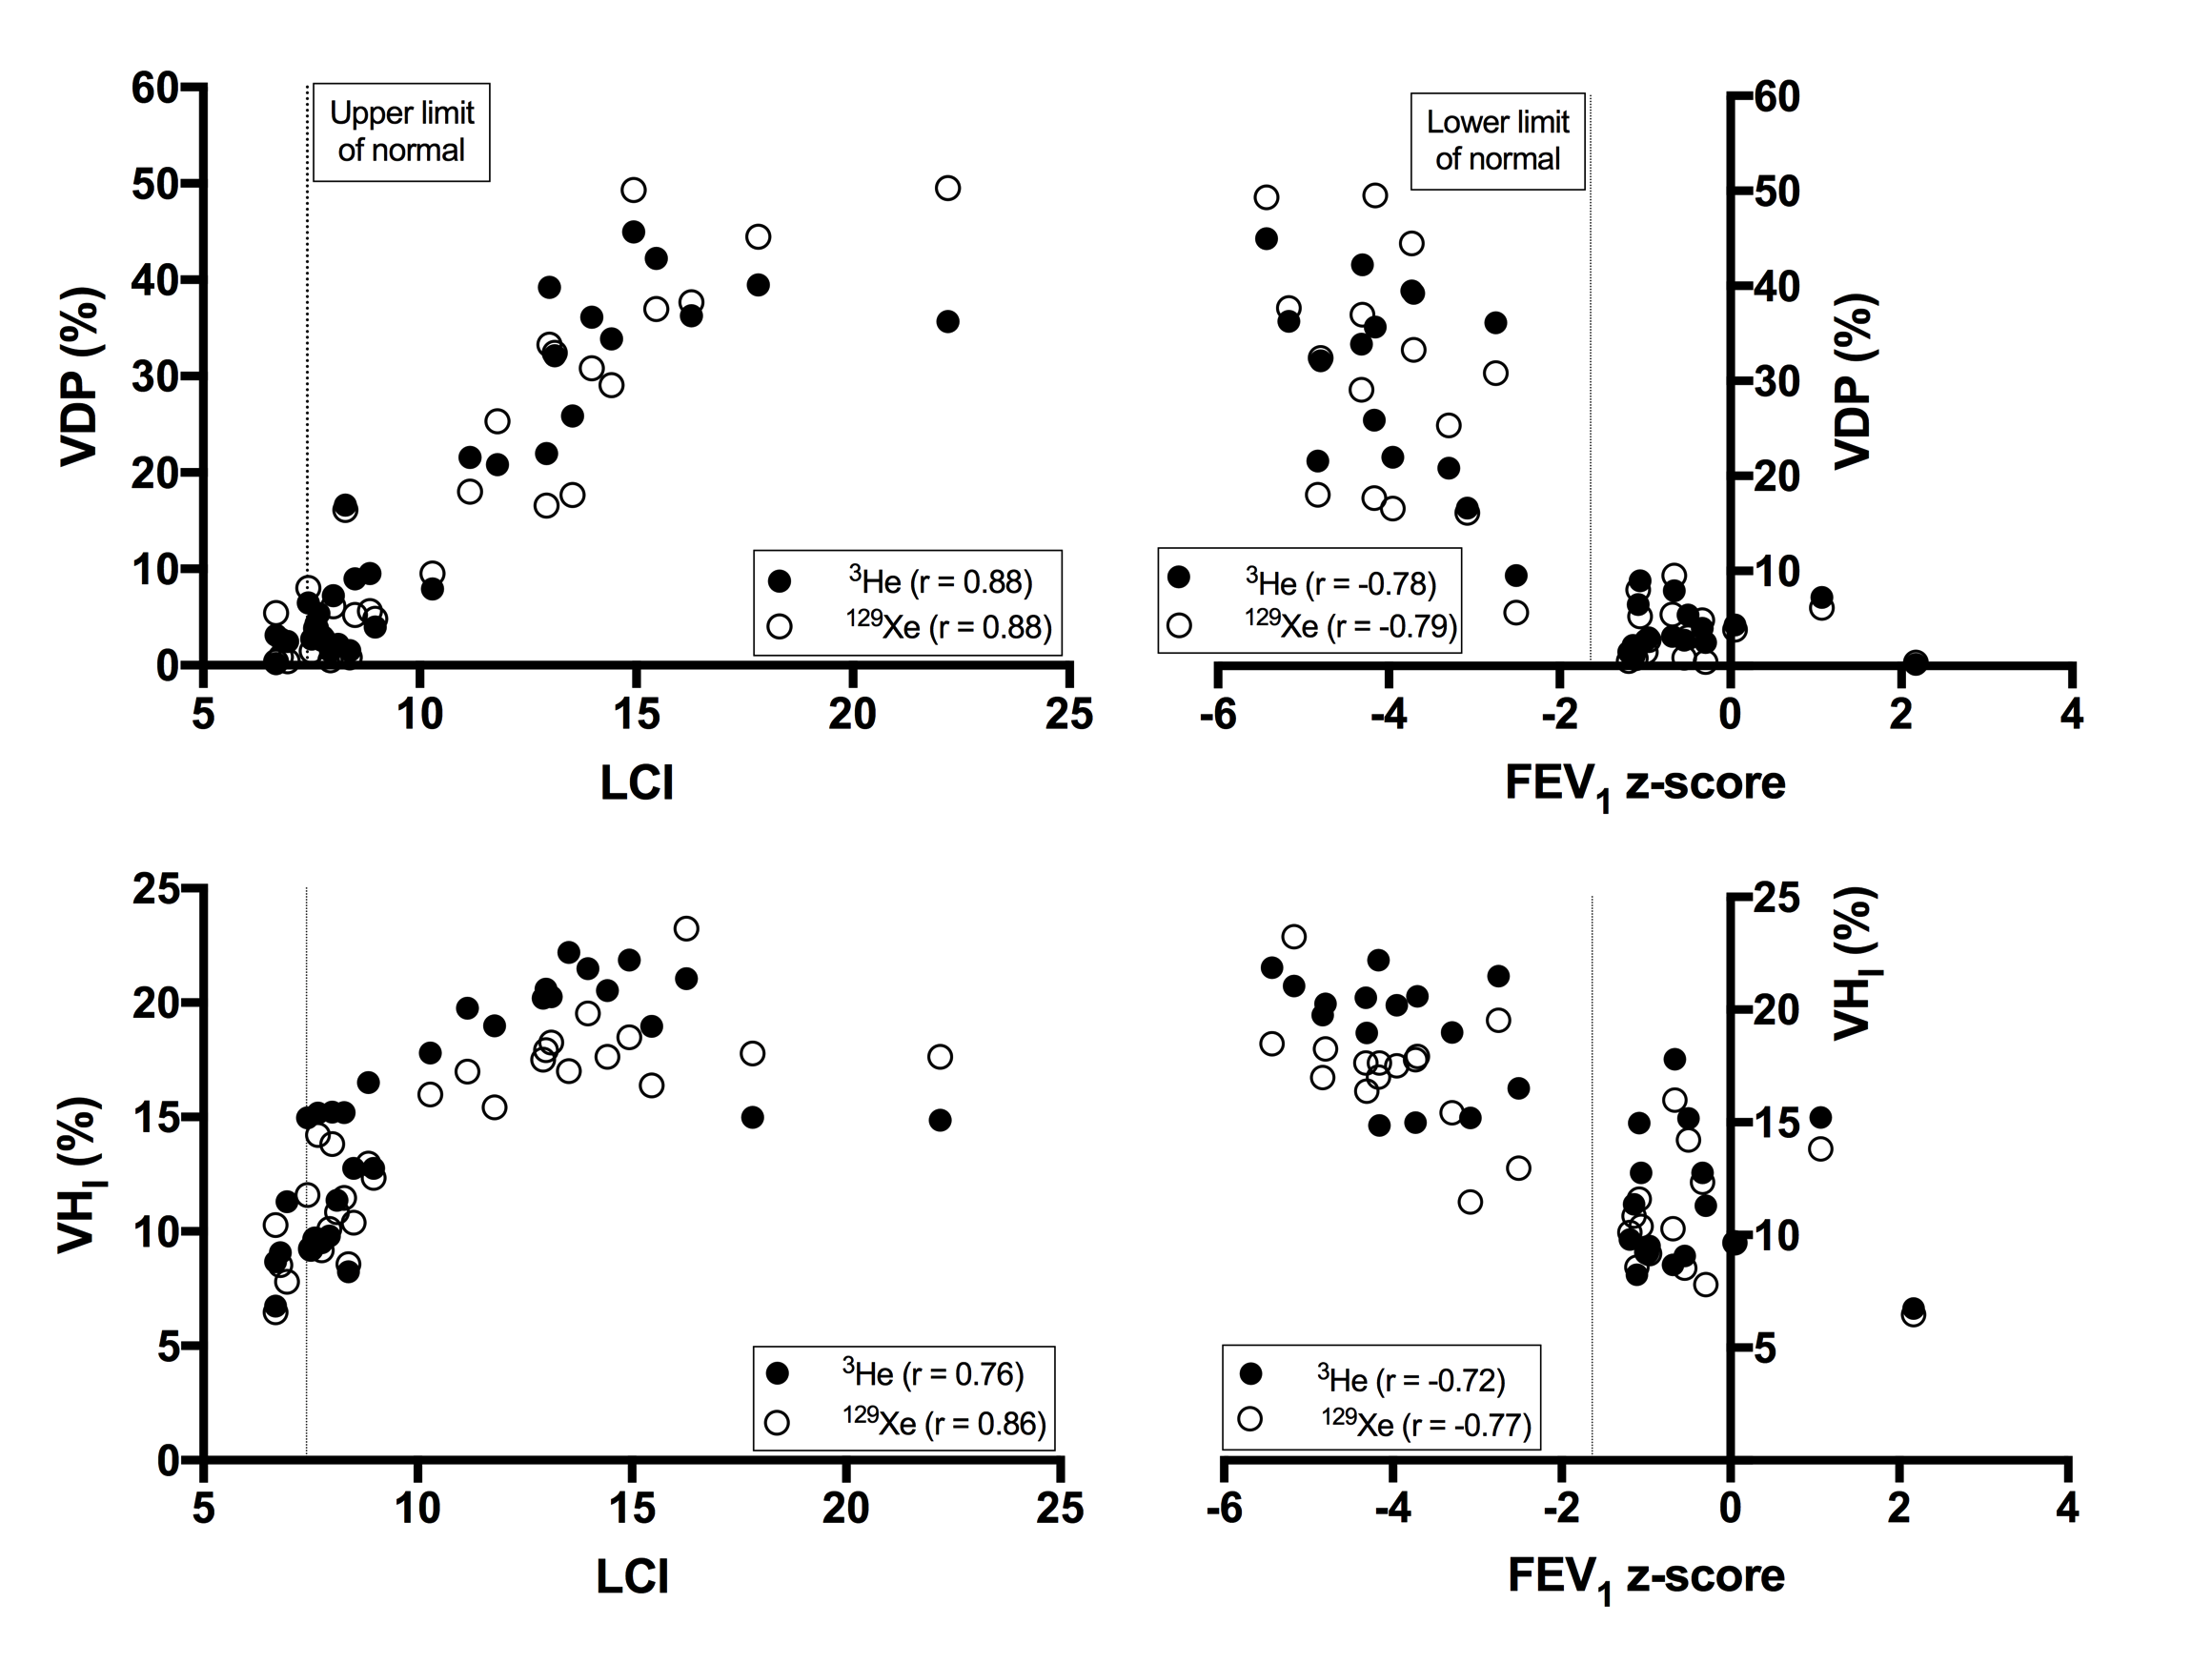
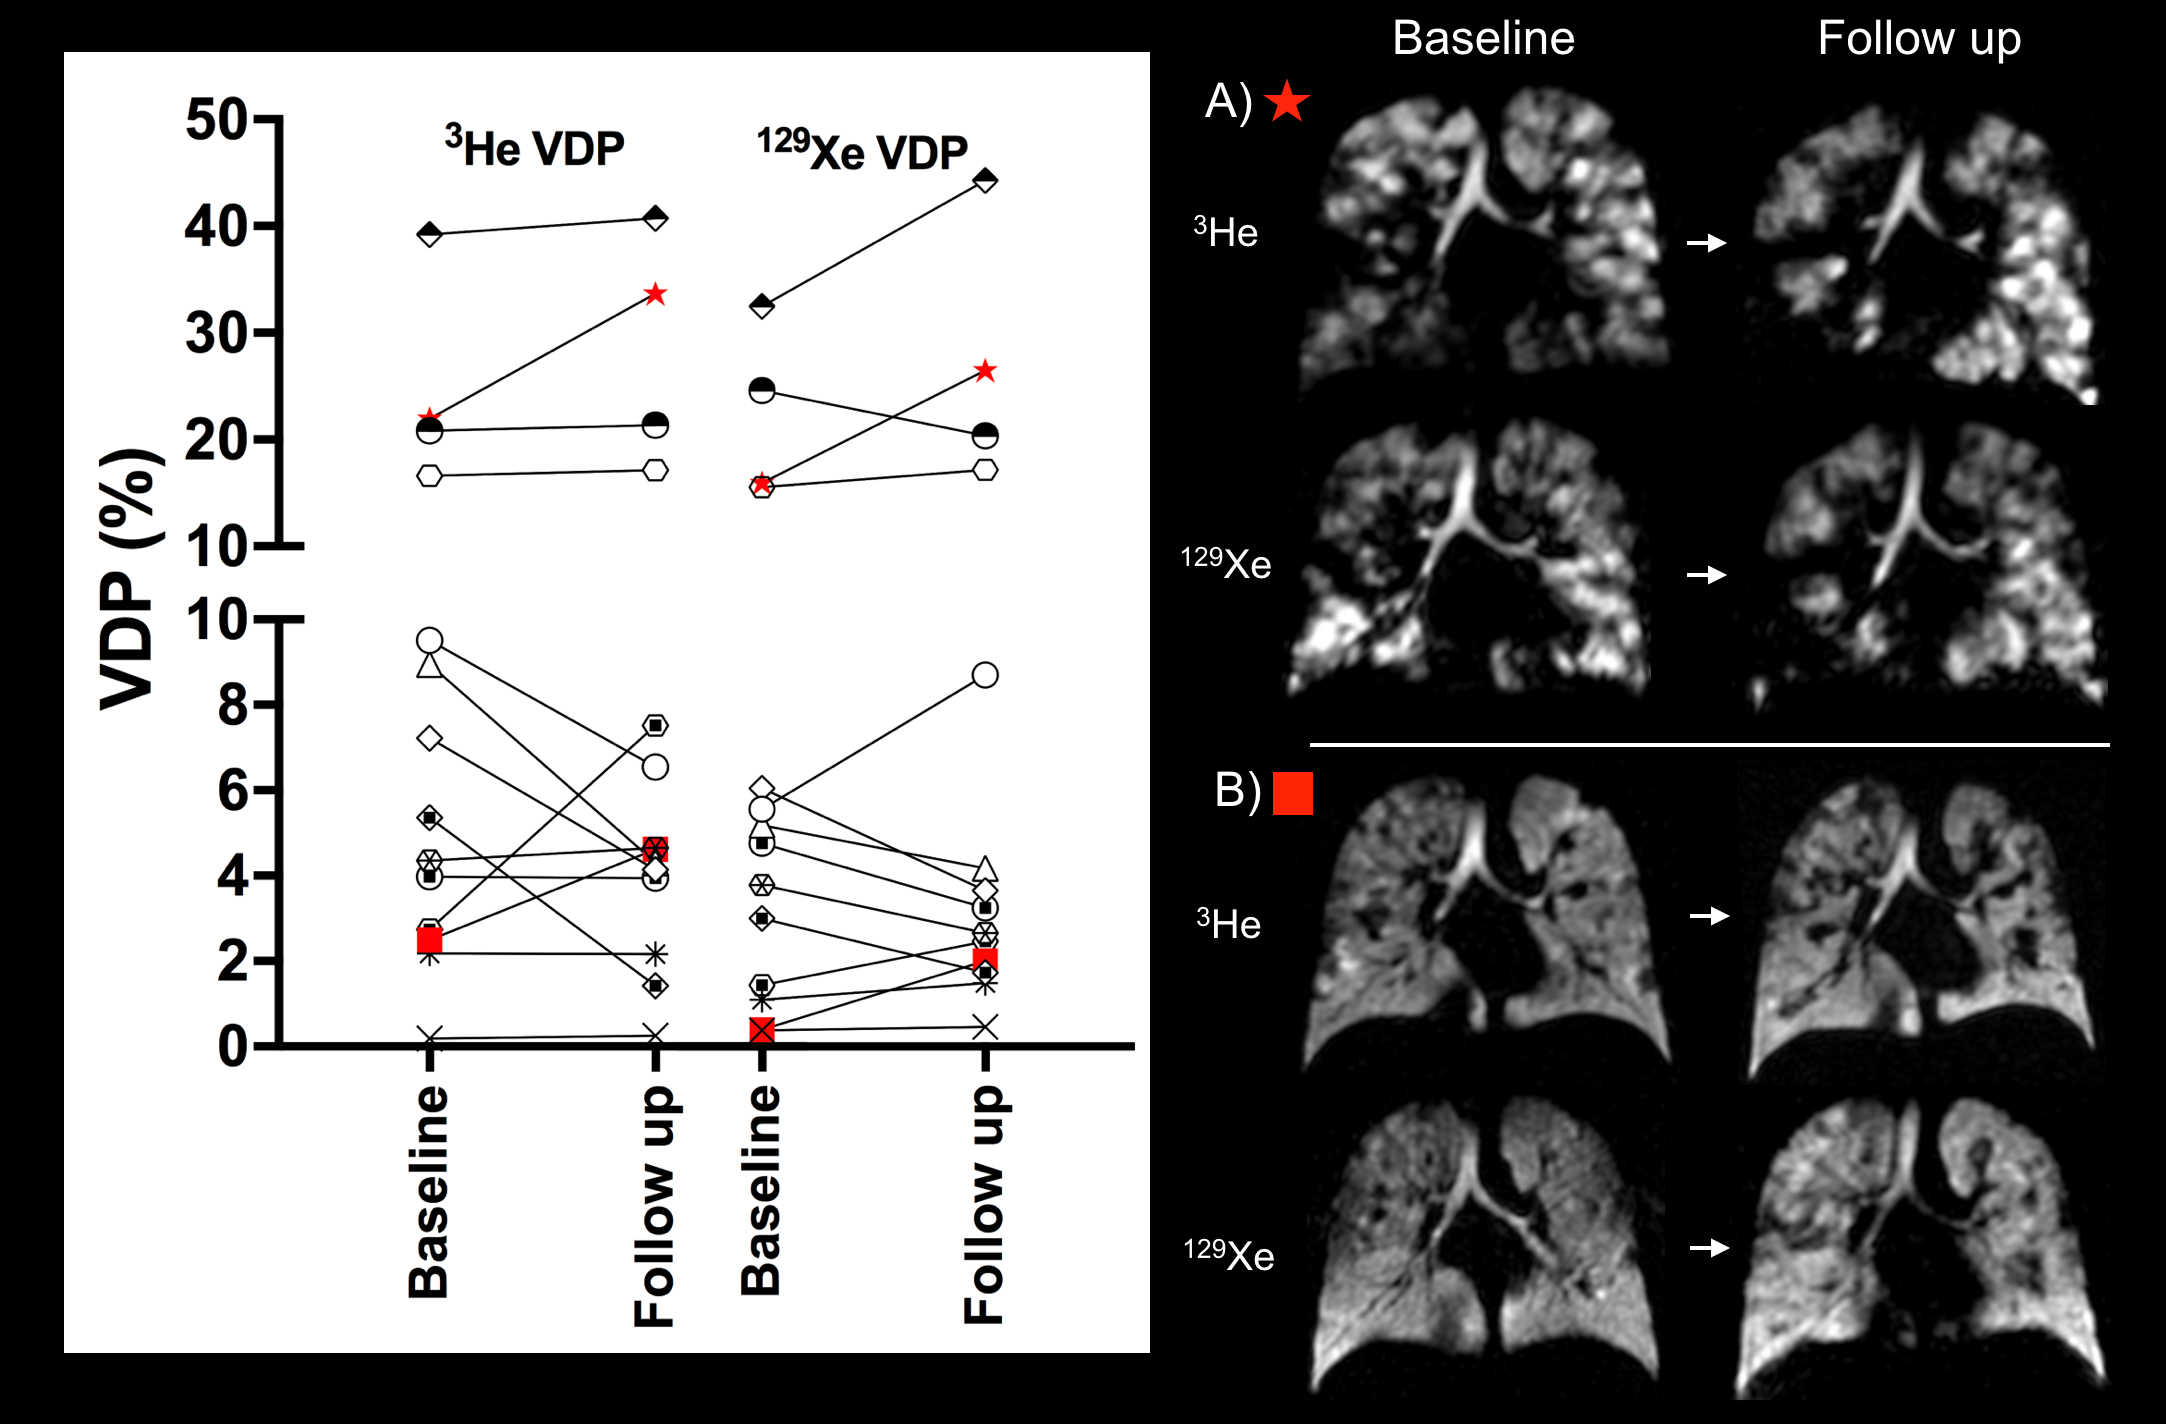
Baseline demographics, MRI metrics and lung function are detailed in Table 1. 14 subjects were followed up at a second time point at a median (range) duration of 1.3 (1.1,1.8) years. At baseline 3He and 129Xe ventilation images were qualitatively similar in all but one subject (Figure 1). There was no significant group difference between 3He and 129Xe MRI for VDP (p>0.05) and there was a strong correlation between gases (r=0.97, p<0.001). Bland-Altman analysis (3He-129Xe) showed good agreement with minimal bias (bias=0.7%, limits of agreement (LoA)=8.9,-7.4% (Figure 2)). Similarly B-A analysis for Ndefects (bias=-0.2, LoA=-6.8,6.4) and the largest individual defect (bias=0.3%, LoA=-5.1,5.7%) demonstrated no significant bias. VHI however was significantly higher for 3He when compared to 129Xe (p<0.001) (B-A bias=1.4%, LoA=-2.6,5.3%). At baseline VDP and VHI from both gases demonstrated similar strong correlations with LCI and FEV1 (Figure 3). Of the 14 subjects followed up (using a 1% change in VDP as a threshold), for both gases four had increased VDP, three had reduced VDP and two had no change in VDP. Four subjects demonstrated change in VDP for 129Xe only (two increased, two decreased) and only one subject demonstrated reduced VDP for 3He despite increased VDP for 129Xe. As seen at baseline, qualitative assessment of change in ventilation distribution with time in an individual was similar for both gases (Figure 4).Discussion/Conclusions
3He and 129Xe ventilation MRI in CF give similar qualitative results with minimal quantitative difference. For patients with normal FEV1, VDP values tend to be lower in 129Xe when compared to 3He, however similar ventilation abnormalities are evident for both gases. Some of these differences relate to gas diffusivity (D0 in air = 0.86/0.14cm2s-1 for 3He/129Xe respectively6) and to image resolution. 129Xe image slices are double the thickness of 3He (10mm vs 5mm), despite the same in-plane resolution, and therefore smaller unventilated defects are more likely to appear unventilated for 3He. VDP and VHI for both gases strongly correlate with lung function markers of disease and therefore both reflect CF lung disease severity. Further to this both gases demonstrated similar quantitative and qualitative change at follow-up, suggesting that despite any subtle differences at a single time point, both gases are reflecting the underlying level of lung disease.Acknowledgements
The authors would like to acknowledge all members of the POLARIS research group at the University of Sheffield for the support. In particular we would like to thank Mrs Leanne Armstrong for administrative support. We would also like to thank the Cystic Fibrosis clinical teams at Sheffield Children’s Hospital, Sheffield Teaching Hospital and Manchester CF Centre for their support. Finally we would like to thank all of the participants for their time in taking part in this research.References
1. Marshall H, Horsley A, Taylor CJ, et al. Detection of early subclinical lung disease in children with cystic fibrosis by lung ventilation imaging with hyperpolarised gas MRI. Thorax 2017;72(8):760-62. doi: 10.1136/thoraxjnl-2016-208948
2. Thomen RP, Walkup LL, Roach DJ, et al. Hyperpolarized (129)Xe for investigation of mild cystic fibrosis lung disease in pediatric patients. Journal of cystic fibrosis : official journal of the European Cystic Fibrosis Society 2017;16(2):275-82. doi: 10.1016/j.jcf.2016.07.008
3. Stewart NJ, Chan HF, Hughes PJC, et al. Comparison of (3) He and (129) Xe MRI for evaluation of lung microstructure and ventilation at 1.5T. J Magn Reson Imaging 2018 doi: 10.1002/jmri.25992
4. Hughes PJC, Horn FC, Collier GJ, et al. Spatial fuzzy c-means thresholding for semiautomated calculation of percentage lung ventilated volume from hyperpolarized gas and (1) H MRI. J Magn Reson Imaging 2018;47(3):640-46. doi: 10.1002/jmri.25804
5. Smith LJ, Collier GJ, Marshall H, et al. Patterns of regional lung physiology in cystic fibrosis using ventilation MRI and MBW. European Respiratory Journal 2018. In Press. DOI: 10.1183/13993003.00821-2018
6. Chen XJ, Moller HE, Chawla MS, et al. Spatially resolved measurements of hyperpolarized gas properties in the lung in vivo. Part I: diffusion coefficient. Magn Reson Med 1999;42(4):721-8.
Figures