4134
Compressed Sensing Hyperpolarized Noble Gas Ventilation MRI: Towards a Maximum Clinically Acceptable Acceleration Factor1Robarts Research Institute, London, ON, Canada, 2Department of Medical Biophysics, Western University, London, ON, Canada, 3Division of Respirology, Department of Medicine, Western University, London, ON, Canada, 4Department of Physics, Ryerson University, Toronto, ON, Canada
Synopsis
Compressed sensing has been applied to
hyperpolarized gas MRI to accelerate acquisition and allow for increased data or
resolution. To better understand the effect of compressed sensing on biomarkers
derived from static ventilation images, data were retrospectively undersampled
in 10 individuals with chronic obstructive pulmonary disease and k-means
clustering was performed. Raw reconstruction resulted in differences less than
the ventilation defect percent minimal clinically important difference up to an
acceleration factor of 3. The total variation Split-Bregman reconstruction
resulted in qualitatively adequate images, however, further optimization of
regularized reconstruction techniques is required to achieve consistent
ventilation signal clustering.
Introduction
Hyperpolarized 3He and 129Xe gas MRI provide a way to visualize and quantify pulmonary ventilation and ventilation heterogeneity. However, it is sometimes challenging to acquire whole lung datasets within a single breath-hold scan with the necessary duration that can also be tolerated by very ill respiratory patients and children or infants. Compressed sensing has recently been developed to provide a way to acquire multiple b-value diffusion-weighted data1, 2 and static ventilation data within a single breath-hold,3-5 in patients. Acceleration offers the possibility of increasing speed and image spatial resolution in the z or slice thickness direction. Currently, there is typically excellent spatial resolution in the x and y directions (~3.125mm), but this does not compete with x-ray CT (submillimeter isotropic resolution) and large slice thicknesses (15-30mm) also creates partial volume effects that cannot be completely abrogated. While compressed sensing may accelerate data acquisition, the effect of under-sampling on biomarkers derived from static ventilation hyperpolarized gas MRI, such as the ventilation defect percent (VDP) has not been determined. Therefore, our objective was to determine the maximum amount of acceleration in ventilation MRI that provided accurate ventilation defect percent measurements as compared to normally-sampled acquisitions. We hypothesized that by simulating acceleration via retrospective under-sampling data in patients with chronic obstructive pulmonary disease (COPD), an acceleration factor (AF) of 5 would provide results that were not significantly different from the original dataset in 10 COPD patients with a wide range of MRI VDP.Methods
Participants with COPD provided informed written consent to an approved study and underwent spirometry, plethysmography and 3He MRI. Hyperpolarized 3He ventilation images (total-acquisition-time=10s; TR/TE/flip-angle=3.8ms/1.0ms/7°; FOV=40×40cm; matrix=80×128; BW=62.5kHz; NEX=1; slices=15; slice-thickness=15mm), referred to as fully-sampled data, and 1H anatomical images (total-acquisition-time=16s; TR/TE/flip-angle=4.7ms/1.2ms/30°; FOV=40×40cm; matrix=80×128; BW=24.4kHz; NEX=1; slices=15; slice-thickness=15mm), were acquired as previously described6 on a 3T Discovery MR750 system (GE Healthy Care, Milwaukee, WI). A single experienced (>5 yrs) observer performed semi-automated segmentation to generate a thoracic cavity mask.7 MRI data were retrospectively under-sampled for different AF using randomly generated lines in k-space, with a Gaussian sampling pattern centered on zero frequency and with a standard deviation of 0.2, as a fraction of k-space. The data were then reconstructed either directly from under-sampled data (raw reconstructed), or by filling k-space by solving the total variation problem using a Split-Bregman iterative approach (TV-SB).8 Optimal regularized reconstruction parameters were set as previously described,4 and a parameter search was performed.Results
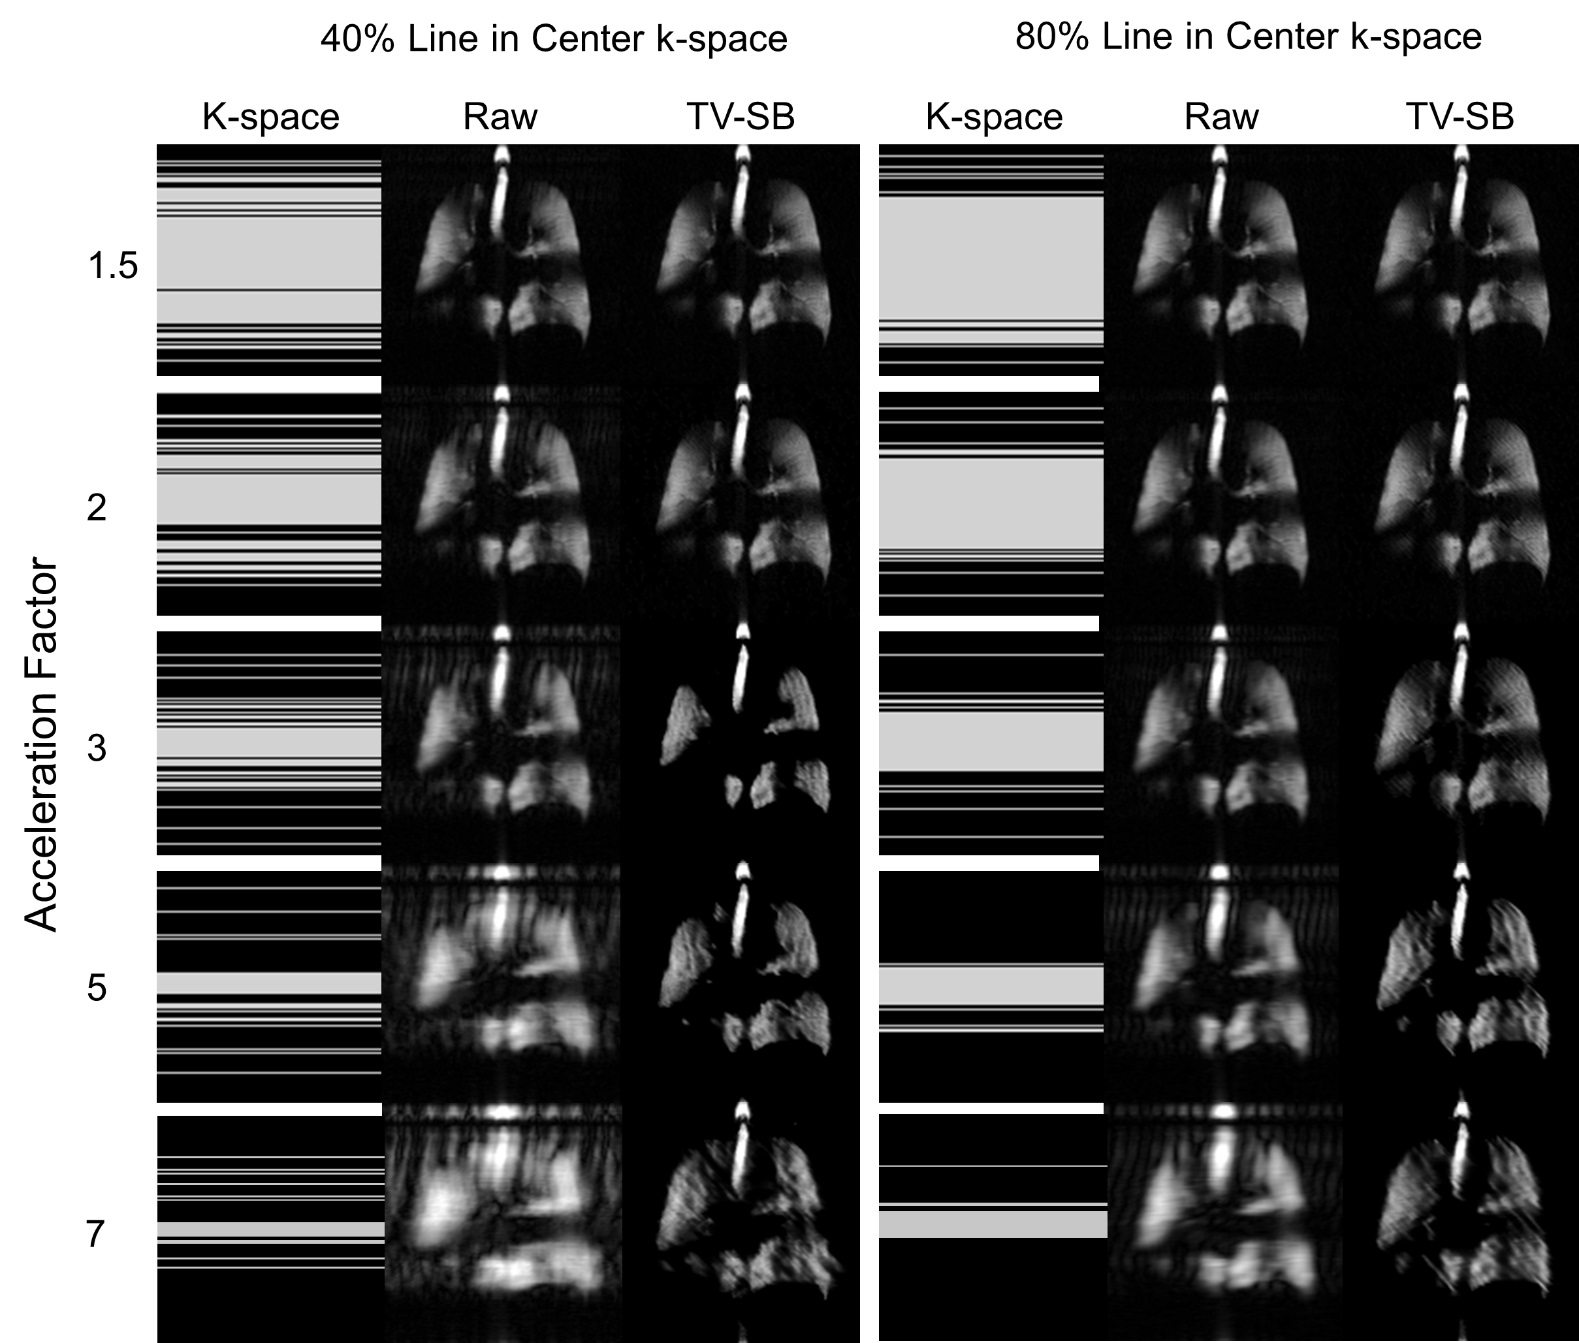
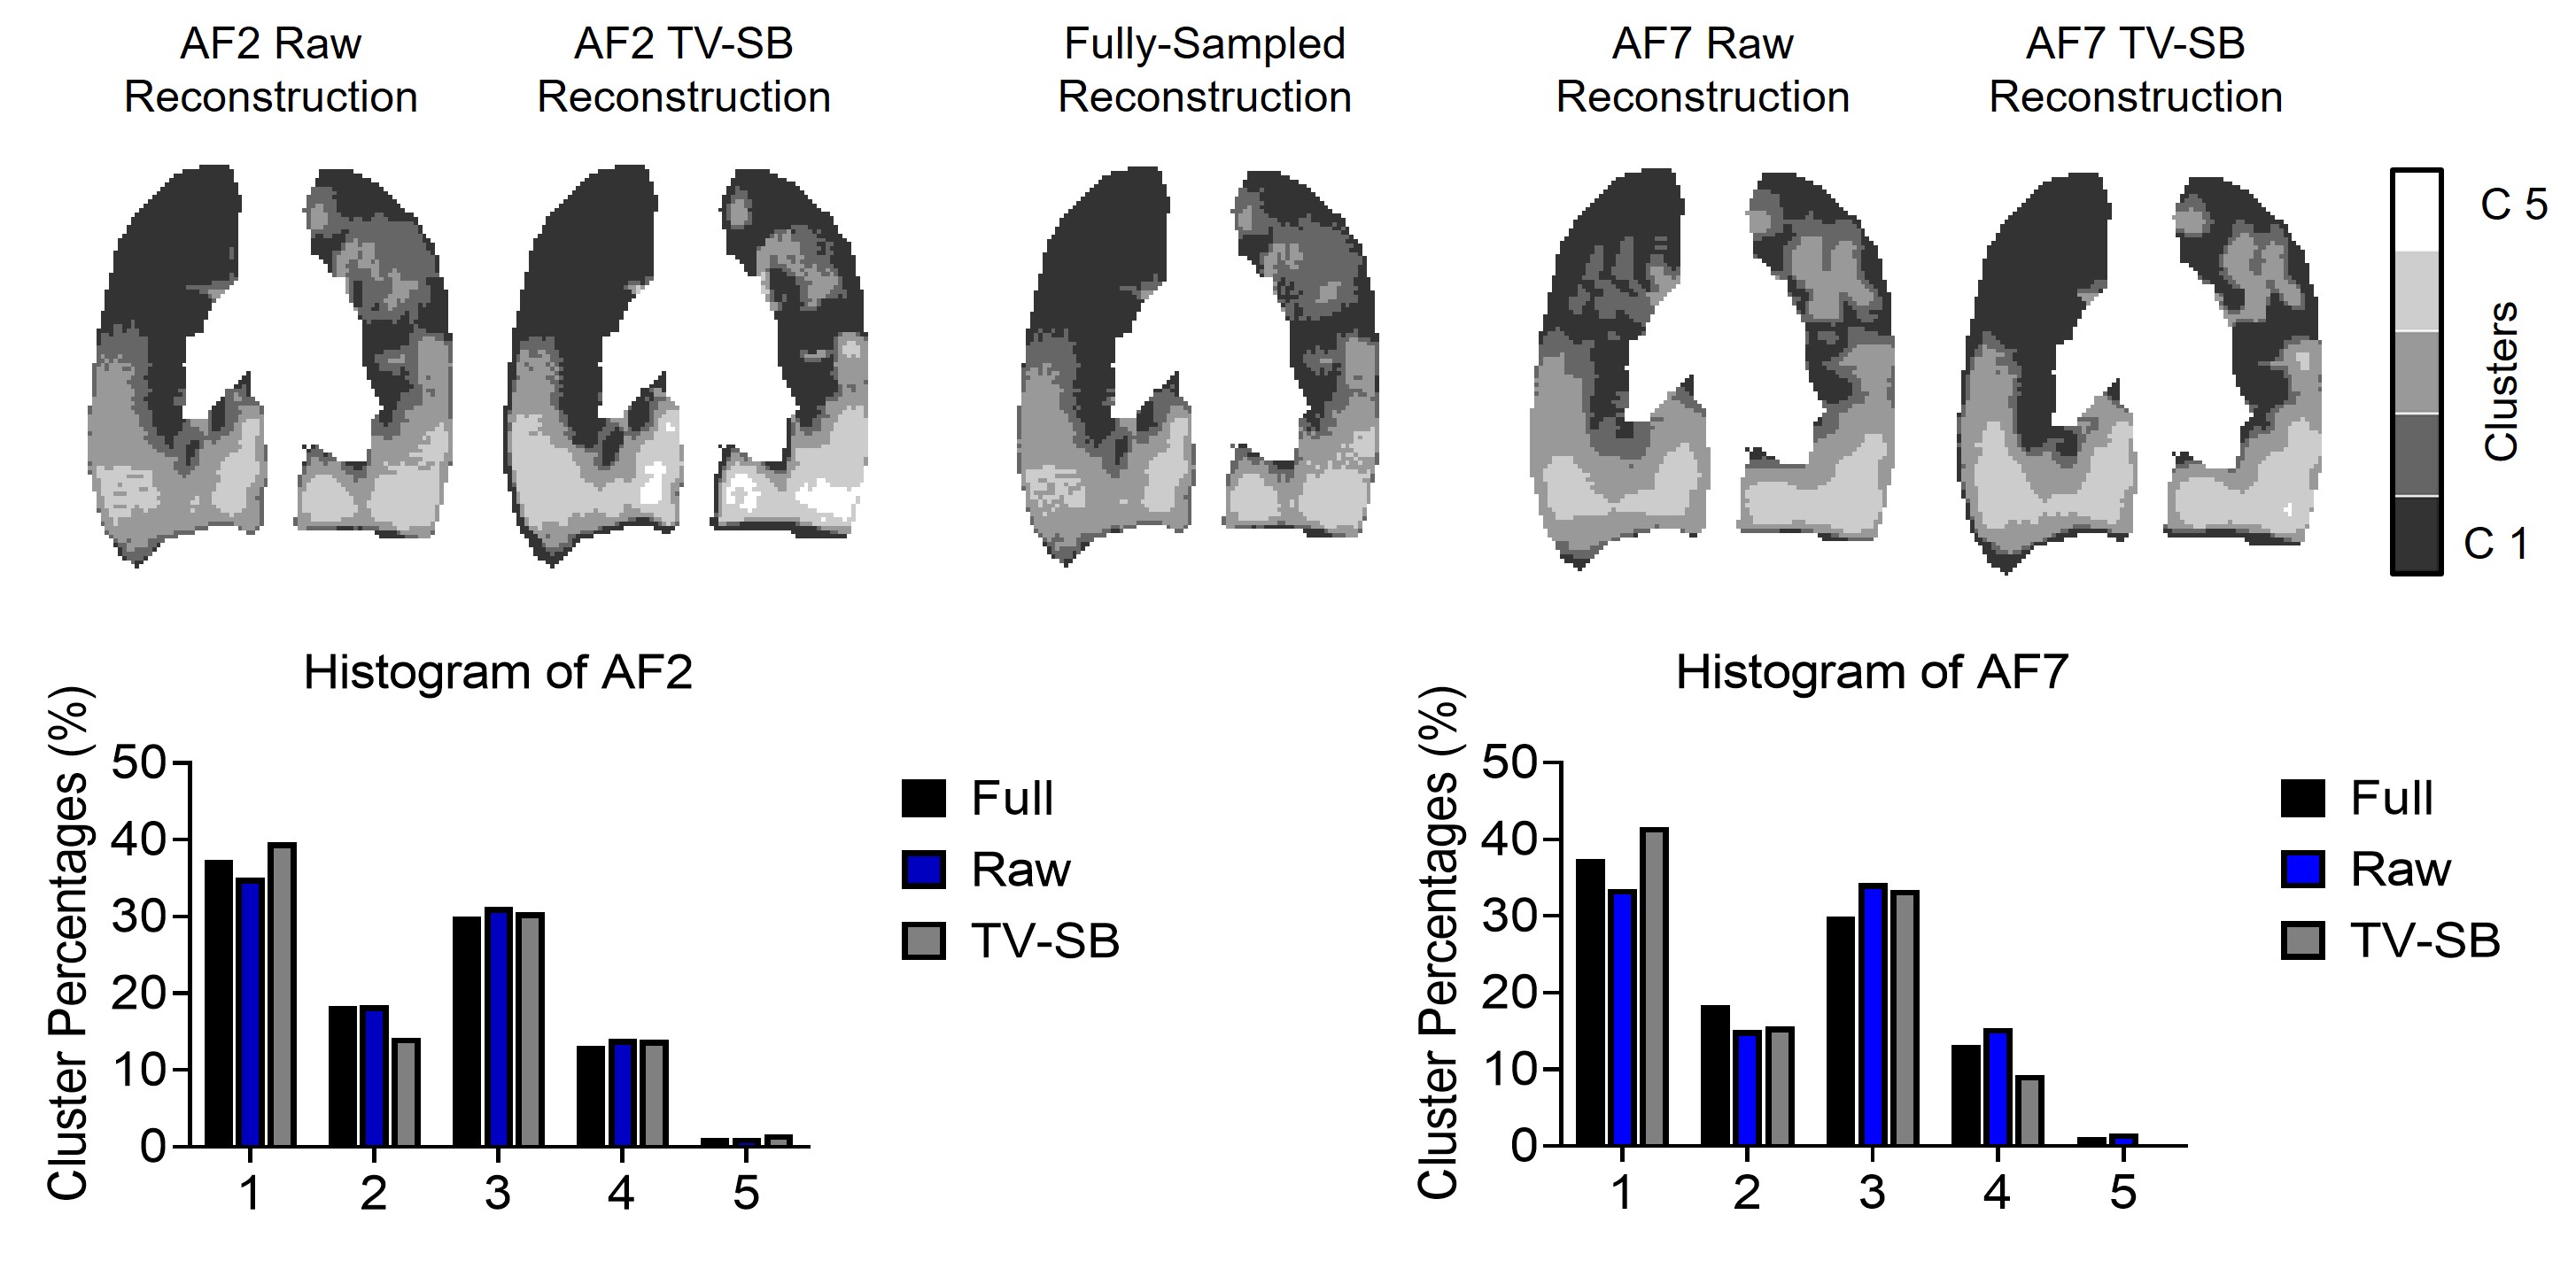
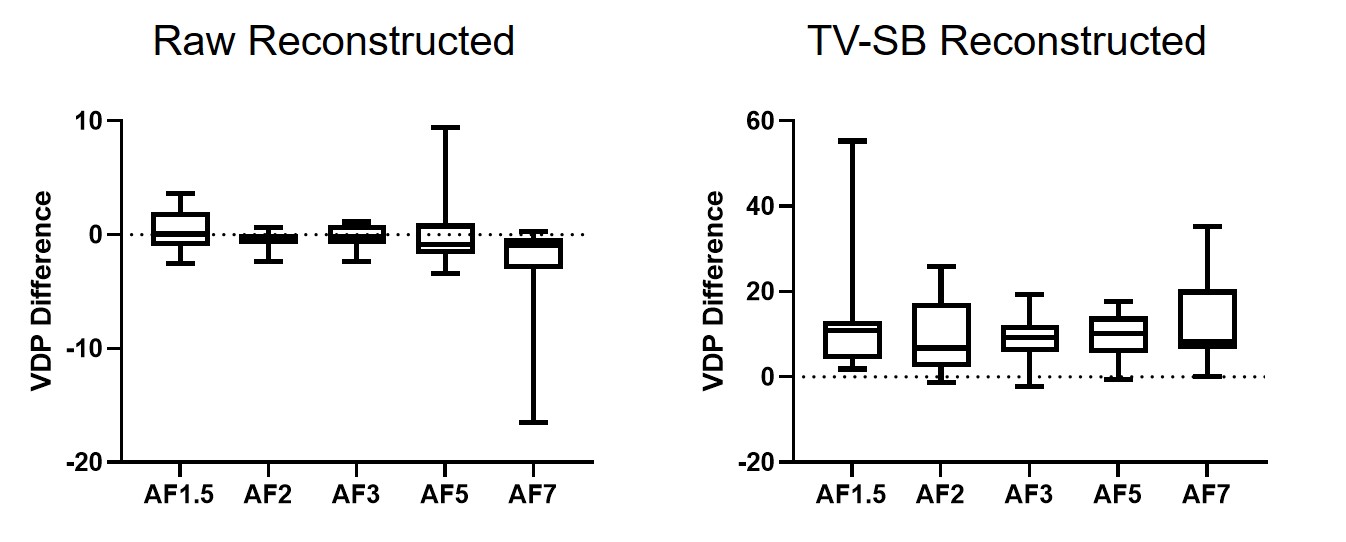
We evaluated ventilation MRI from 10 COPD patients. Figure 1 provides the k-space under-sampling schemes utilized as well as resultant raw reconstructed and TV-SB reconstructed images. It is clear that the optimal approach was to sample the centre of k-space at 80%, and therefore the under-sampling pattern shown in the right panel of Figure 1 was used. Figure 2 shows signal intensity histograms resulting from a 3D k-means clustering algorithm,7 and demonstrates the bias of TV-SB towards greater cluster 1, or ventilation defects. Raw-reconstructed cluster maps for acceleration factor 2 qualitatively agree well with the fully-sampled data. Figure 3 displays the difference in reconstructed VDP compared to the VDP calculated from fully sampled data. For raw reconstructed data the mean difference was not significantly different than zero (p>.05) for all acceleration factors, and the standard deviation was less that the previously published minimal clinically important difference for VDP of 2%,9 up to an acceleration factor of 3. There was a consistent bias for greater VDP with all acceleration factors (p<.05) for TV-SB reconstruction.Discussion
The qualitative and quantitative clustering results for the raw reconstructed images suggested that an acceleration factor of 3 resulted in differences < minimal clinically important difference for VDP. A large difference was observed for TV-SB reconstructed images, however, the images maintained qualitative integrity. This suggests that future work should focus on optimizing the regularized reconstruction parameters with k-means clusters or VDP as the cost function or modifying the clustering algorithm to create an analysis method that will not be sensitive to reconstruction. Future work exploring different compressed sensing reconstruction methods, including a deep learning approach should also be undertaken.Conclusion
This preliminary proof-of-concept study demonstrated the impact of under-sampling on ventilation signal intensity distributions and VDP. Regularized reconstruction techniques up to an acceleration factor of seven generated adequate contrast, however, optimization of regularized reconstruction techniques is required to achieve accurate ventilation signal intensity clustering and VDP.Acknowledgements
No acknowledgement found.References
1. Chan HF, Stewart NJ, Parra-Robles J, Collier GJ, Wild JM. Whole lung morphometry with 3d multiple b-value hyperpolarized gas mri and compressed sensing. Magn Reson Med 2017;77:1916-1925.
2. Zhang H, Xie J, Xiao S, Zhao X, Zhang M, Shi L, Wang K, Wu G, Sun X, Ye C, Zhou X. Lung morphometry using hyperpolarized (129) xe multi-b diffusion mri with compressed sensing in healthy subjects and patients with copd. Med Phys 2018;45:3097-3108.
3. Westcott A, Guo F, Parraga G, Ouriadov A. Rapid single-breath hyperpolarized noble gas mri based biomarkers of airspace enlargement. . J Magn Reson Imaging 2018.
4. Abascal JFPJ, Desco M, Parra-Robles J. Incorporation of prior knowledge of the signal behavior into the reconstruction to accelerate the acquisition of mr diffusion data. ArXiv e-prints; 2017.
5. Ajraoui S, Lee KJ, Deppe MH, Parnell SR, Parra-Robles J, Wild JM. Compressed sensing in hyperpolarized 3he lung mri. Magn Reson Med 2010;63:1059-1069.
6. Svenningsen S, Kirby M, Starr D, Leary D, Wheatley A, Maksym GN, McCormack DG, Parraga G. Hyperpolarized (3) he and (129) xe mri: Differences in asthma before bronchodilation. J Magn Reson Imaging 2013;38:1521-1530.
7. Kirby M, Heydarian M, Svenningsen S, Wheatley A, McCormack DG, Etemad-Rezai R, Parraga G. Hyperpolarized 3he magnetic resonance functional imaging semiautomated segmentation. Acad Radiol 2012;19:141-152.
8. Goldstein T, Osher S. The split bregman method for l1-regularized problems. SIAM J Imaging Sci 2009;2:323-343.
9. Eddy RL, Svenningsen S, McCormack DG, Parraga G. What is the minimal clinically important difference for helium-3 magnetic resonance imaging ventilation defects? Eur Respir J 2018;51.
Figures