4133
Monitoring of Pulmonary Function in Real-time with 1D Hyperpolarized Xenon-129 MRI1Radiology, University of Pennsylvania, Philadelphia, PA, United States, 2Anesthesiology and Critical Care, University of Pennsylvania, Philadelphia, PA, United States
Synopsis
Data sampling for pulmonary function measurements using hyperpolarized gas MRI typically lasts for several seconds due to the time requirements for spatial signal encoding. Consequently, highly-dynamic processes are largely invisible to existing lung-imaging techniques. In an initial attempt to observe pulmonary function in real time, we traded spatial resolution for a high temporal resolution of 10 ms by limiting spatial information to 1D projection acquisitions. We tested the technique in a rabbit model by observing pulmonary signal oscillations throughout the lung and by detecting alveolar collapse during expiration at high PEEP in acid-induced acute lung injury.
Purpose
Many functionally-relevant physiological processes in the lung occur in the 10 – 1,000 ms regime. However, due to the time requirements for spatial signal encoding, data sampling for pulmonary function measurements using hyperpolarized gas MRI typically lasts for several seconds1-7. Consequently, highly-dynamic processes are largely invisible to existing lung-imaging techniques despite their potential importance for a more holistic characterization of lung disease. In an initial attempt to observe pulmonary function in real time, we traded spatial resolution for a high temporal resolution of 10 ms by limiting spatial information to 1D projection acquisitions. We evaluated the feasibility of such an approach in a rabbit model.Methods
Imaging experiments were performed in sedated New Zealand rabbits (approx. 4 kg). Animals were ventilated with room air until imaging began, at which point the gas mix was switched to 20% oxygen and 80% HXe for 3 breaths (6 ml/kg tidal volume), followed by a 6-s breath-hold. In one animal, mild lung injury was induced via instillation of 1.5 ml/kg of HCl into the left lung, followed by application of 4 cm positive end-expiratory pressure (PEEP) for 15 minutes. Measurements were conducted at PEEP 0 and 9 cmH2O after induction of acute lung injury. All studies were approved by the Institutional Animal Care and Use Committee.
MR imaging was conducted using a 1D-projection gradient-echo sequence with left-to-right frequency encoding that employed a non-selective 700-μs Gaussian RF excitation pulse centered 3,530 Hz downfield from the gas-phase resonance. Taking advantage of the large frequency difference between the two phases combined with a sufficiently small acquisition bandwidth, HXe in the pulmonary air spaces and dissolved in the lung tissue were imaged simultaneously, side-by-side8-10. The following sequence parameters were used: matrix size 28×80; flip angle 7°; TR 10 ms (TR90°,equiv 1,340 ms10); TE 2.6 ms; FOV 220 mm; receiver bandwidth 110 Hz/pixel. Corresponding 2D projection images (TR90°,equiv 1,490 ms10 were acquired as described in Ruppert et al9,10 for visualization purposes. All MR studies were performed at 1.5T (Avanto; Siemens) using a custom xenon-129 transmit/receive birdcage coil (Stark Contrast, Erlangen, Germany). Enriched xenon gas (87% xenon-129) was polarized using a prototype commercial system (XeBox-E10, Xemed LLC, Durham, NH).
Results and Discussion
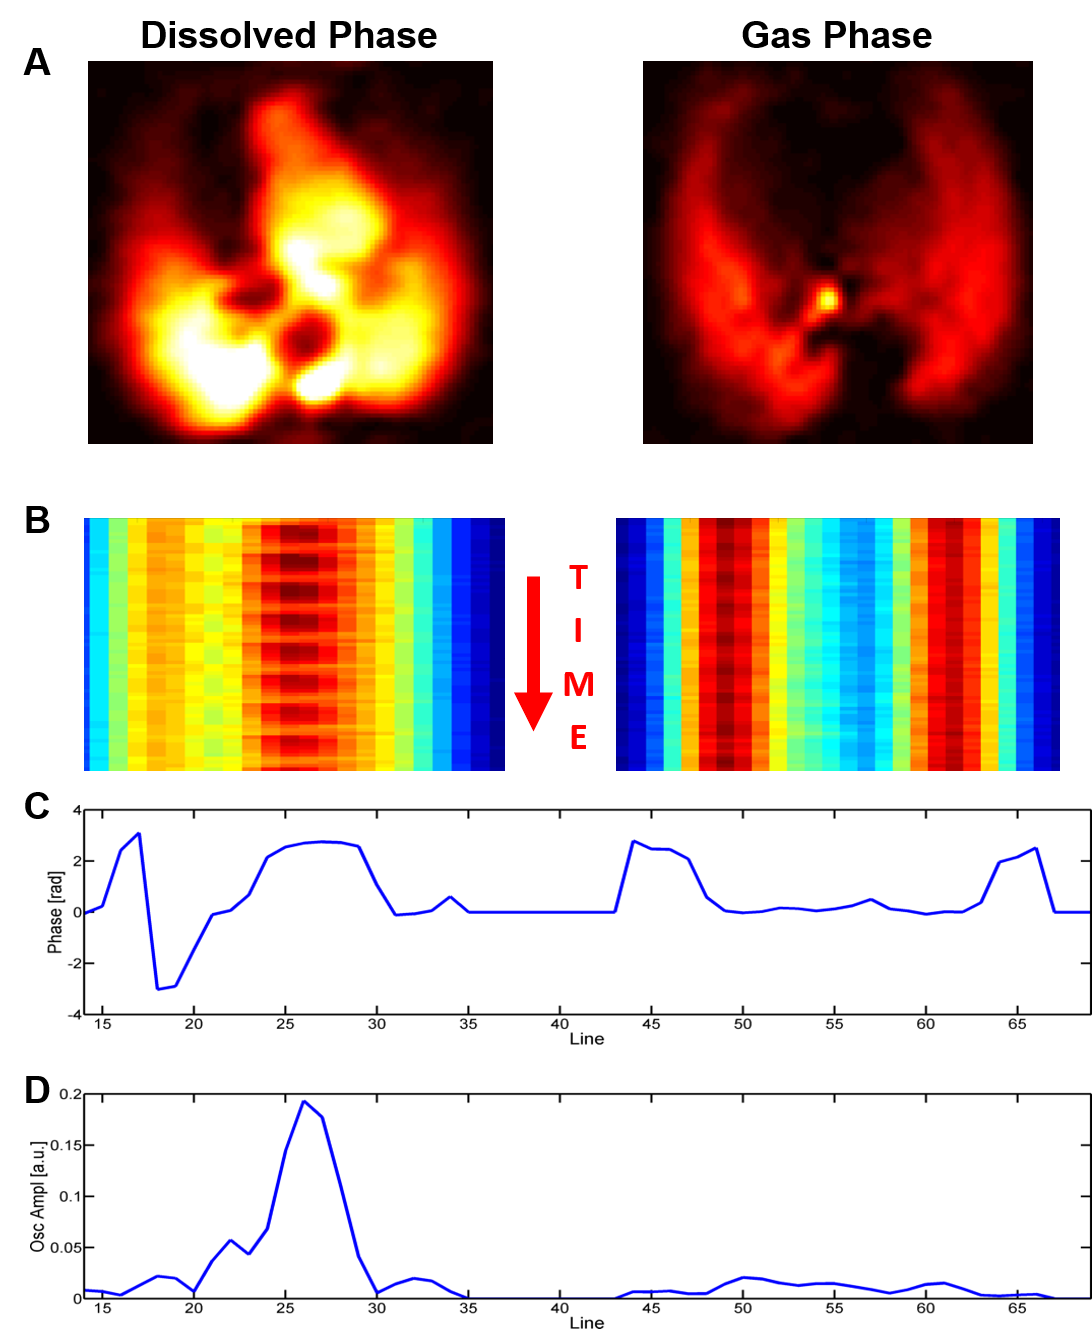
Figure 1A shows axial static 2D projection maps of simultaneously acquired dissolved- and gas-phase signal distributions in a healthy rabbit. Removing anterior-posterior phase encoding and sampling only frequency-encoded data every 10 ms yields the dynamic 1D projections in Fig. 1B. In this time-resolved measurement, periodic oscillations in the gas- and dissolved-phase amplitudes become apparent throughout the lung. While the oscillation frequencies are equal to the heart rate, the oscillation phases (Fig. 1C) and amplitudes (Fig. 1D) in the dissolved-phase signal differ vastly and are likely tied to regional variations in gas transport rates throughout the cardiac cycle. The gas-phase signal, on the other hand, pulsates uniformly throughout the lung (albeit with lower amplitude), 180° out of phase with the dissolved-phase signal in the heart. We hypothesize that the observed oscillation amplitudes could also be correlated with tissue compliance and are likely to decrease with increased tissue stiffness, e.g., in fibrotic or inflammatory disease.
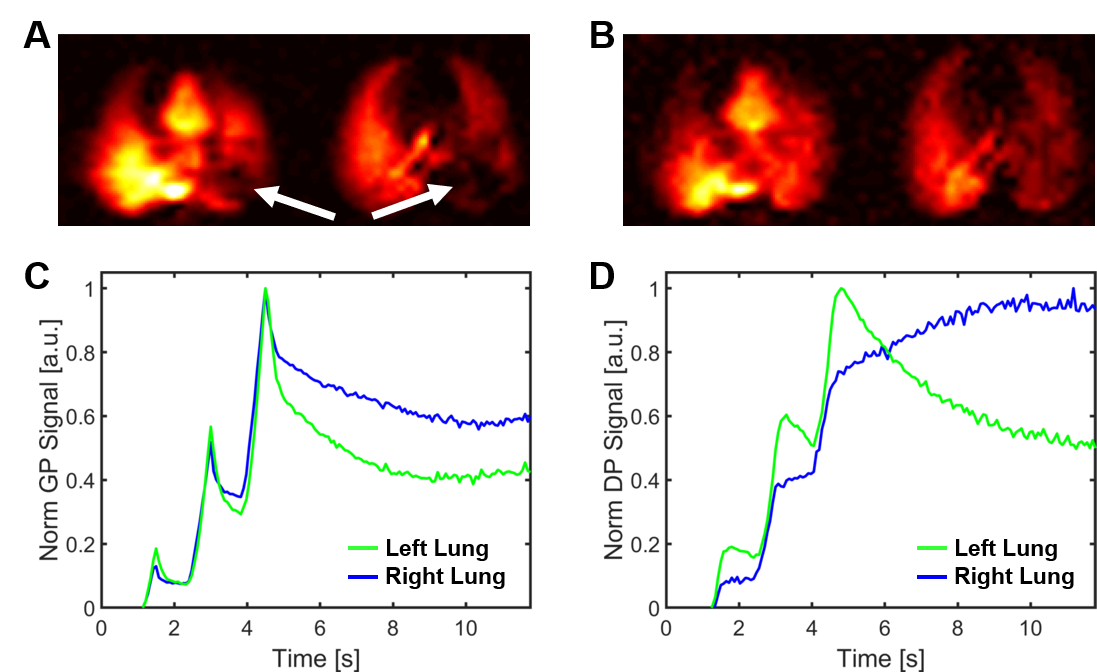
Figure 2A depicts a 2D axial projection of HXe dissolved in the lung parenchyma, blood and heart, as well as the corresponding ventilation images without PEEP. The acid-induced lung injury resulted in partial collapse of the lung, as evidenced by the large voids in both maps (arrows), while a PEEP of 9 cmH2O largely re-inflated the affected volume (Fig. 2B). Acquiring only one-dimensional data allowed us to replace the single measurement of xenon distribution underlying Fig. 2B with hundreds of measurements of the xenon magnetization in the air spaces (Fig. 2C) and dissolved in the lung tissue (Fig. 2D) every 10 ms. While the left and right lung inflate and deflate in synchrony in healthy animals at PEEP 9 cmH2O, the left lung in the injured rabbit deflated much faster during expiration, indicating collapse of the re-inflated volume. In parallel, the dissolved xenon magnetization decreased in the injured left lung during exhalation, as less xenon magnetization entered from the alveoli than was removed by the blood stream.
Conclusion
Real-time measurement of the xenon gas- and dissolved-phase signals in the lung has the potential to reveal important dynamic aspects of lung function that are lost in static images. Nevertheless, due to their limited spatial resolution, dynamic measurements will likely be most useful in combination with high-resolution images that provide the detailed structural information required for a comprehensive characterization of pulmonary pathologies.Acknowledgements
Supported by NIH grants R01 EB015767, R01 HL129805, S10 OD018203 and R01 CA193050.References
[1] Qing et al. Assessment of lung function in asthma and COPD using hyperpolarized 129Xe chemical shift saturation recovery spectroscopy and dissolved-phase MRI. NMR in Biomed 2014;27(12):1490-1501. [2] Kaushik et al. Single-breath clinical imaging of hyperpolarized 129Xe in the airspaces, barrier, and red blood cells using an interleaved 3D radial 1-point Dixon acquisition. MRM 2016;75(4):1434-1443. [3] Using hyperpolarized (129)Xe MRI to quantify regional gas transfer in idiopathic pulmonary fibrosis. Thorax 2018;73(1):21-28. [4] Zhong et al. Simultaneous assessment of both lung morphometry and gas exchange function within a single breath‐hold by hyperpolarized 129Xe MRI. NMR in Biomed 2017 (epub). [5] Doganay et al. Quantification of regional early stage gas exchange changes using hyperpolarized 129Xe MRI in a rat model of radiation-induced lung injury. Med Phys 2016;43(5):2410-2420. [6] Kern et al. Regional investigation of lung function and microstructure 129Xe chemical shift saturation recovery parameters by localized and dissolved‐phase imaging: A reproducibility study. MRM 2018 (epub). [7] Zanette et al. Physiological gas exchange mapping of hyperpolarized 129Xe using spiral-IDEAL and MOXE in a model of regional radiation-induced lung injury. Med Phys 2018;45(2):803-816. [8] Mugler et al. Simultaneous magnetic resonance imaging of ventilation distribution and gas uptake in the human lung using hyperpolarized xenon-129. Proc Natl Acad Sci USA 2010;107(50):21707-21712. [9] Ruppert et al. Assessment of Pulmonary Gas Transport in Rabbits Using Hyperpolarized Xenon-129 Magnetic Resonance Imaging. Scientific reports 8, 7310, doi:10.1038/s41598-018-25713-0 (2018). [10] Ruppert et al. Assessment of flip angle-TR equivalence for standardized dissolved-phase imaging of the lung with hyperpolarized 129Xe MRI. MRM 2018 (epub).Figures