4131
Comparison of apparent diffusion coefficient mapping in the lungs of healthy volunteers with 19F C3F8 and hyperpolarized 129Xe gas MRI1Academic Unit of Radiology, University of Sheffield, Sheffield, United Kingdom
Synopsis
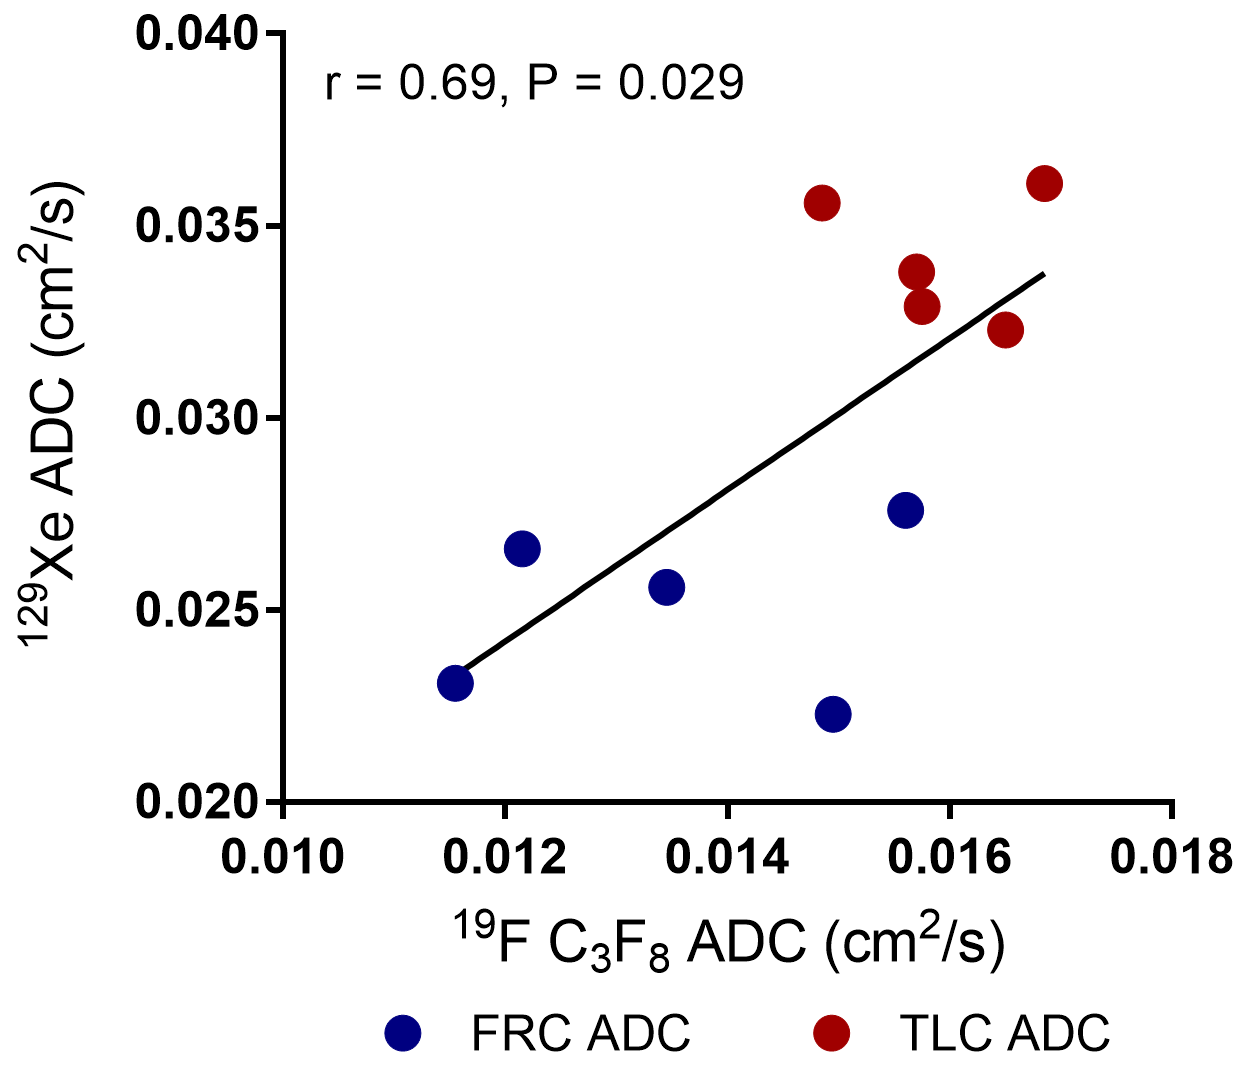
In this work we derive in-vivo 19F C3F8 and 129Xe apparent diffusion coefficient (ADC) maps from healthy volunteers’ lungs at functional residual capacity (FRC) and total lung capacity (TLC) to evaluate the sensitivity of C3F8 ADC to changes in alveolar dimensions. Each volunteer’s C3F8 ADC values at FRC was significantly smaller than the respective TLC value (P=0.008), and both FRC and TLC values were smaller than the free diffusion coefficient of C3F8. Furthermore, a significant correlation between 129Xe and C3F8 ADC was observed (r=0.69, P=0.029); demonstrating the clinical potential of in-vivo C3F8 ADC mapping.
Introduction
Inhaled inert fluorinated gases (C2F6 and C3F8) have recently emerged as a potential alternative imaging technique to hyperpolarized gases (3He or 129Xe) for functional imaging of the lungs 1. Diffusion-weighted (DW) MRI with hyperpolarized gases can provide structural information of the alveolar airspace through the derived apparent diffusion coefficient (ADC), which is sensitive to changes in alveolar dimensions 2,3. The inherent lower image SNR, shorter T2*, and lower diffusivity of fluorinated gases, with respect to hyperpolarized gases, has to date restricted ADC mapping with fluorinated gases to animal models 4 and ex-vivo human lungs 5,6. Preliminary in-vivo 19F ADC maps in human lungs have been reported 7, but 19F ADC sensitivity to alveolar dimension changes has not yet been demonstrated. In this work, we derive in-vivo 19F C3F8 ADC maps obtained in healthy volunteers’ lungs at two lung inflation levels, and benchmark C3F8 ADC against corresponding 129Xe ADC measurements.Methods
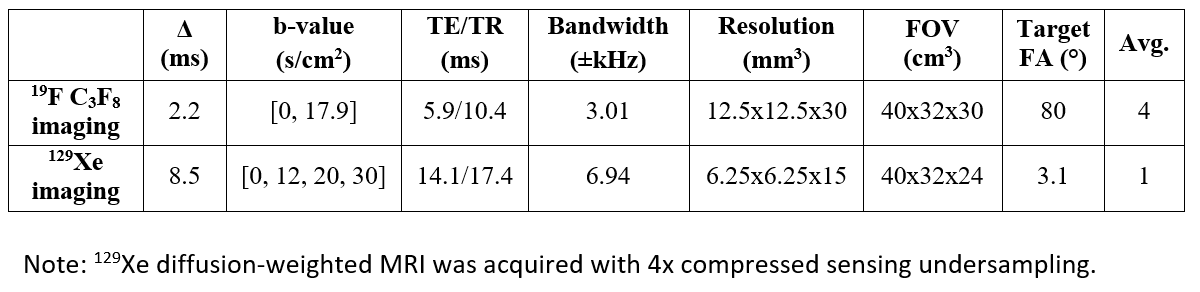
Five healthy volunteers (30±4 years) were imaged with inhaled 19F C3F8 and 129Xe DW-MRI at 1.5T (GE HDx). 19F imaging was performed with an 8-element transceiver vest coil 8 modified to include an additional 6 receive-only elements (total of 14 elements), using a 3D SPGR sequence with a diffusion time of 2.2 ms, and b=0, 17.9 s/cm2, as previously used with C2F6 in excised lungs 5,6. 129Xe imaging was acquired with a flexible transmit/receive quadrature vest coil, using a 3D multiple b-value SPGR sequence with compressed sensing 9. DW-MRI acquisition parameters for each gas are shown in Table 1. 129Xe and 19F ADC values were calculated for each acquisition on a voxel-by-voxel basis using a mono-exponential fit between b=0 and 12 s/cm2 (129Xe) or b=0 and 17.9 s/cm2 (19F) diffusion interleaves. Each volunteer was imaged with both gases at two lung inflation levels; function residual capacity (FRC) and total lung capacity (TLC).
The 19F imaging breathing manoeuvres first involved two deep breaths of the fluorinated gas mixture (79% C3F8, 21% O2) to fully saturate the lungs, and was followed by four separate breath-holds with recovery whilst breathing from the gas mixture in between each breath-hold. The first two breath-holds were performed at TLC; while the last two were performed after exhalation to FRC. Each 19F imaging breath-hold was 22 s, and a 25L bag of gas mixture was found to be sufficient for all four DW-MRI acquisitions. The C3F8 gas inside the bag was also imaged with same 19F sequence parameters to determine the free diffusion coefficient (D0) of the inhaled fluorinated gas mixture. All 129Xe imaging acquisitions were performed in two separate single 16s breath-holds 9. For 129Xe FRC, the volunteer inhaled a 1L gas mixture (900ml 129Xe, 100 ml N2) from FRC and then exhaled back to FRC; while for TLC, a 1L gas mixture (600 ml 129Xe, 400 ml N2) was inhaled from FRC and the volunteer then continued inhaling room air to TLC.
Results and Discussion
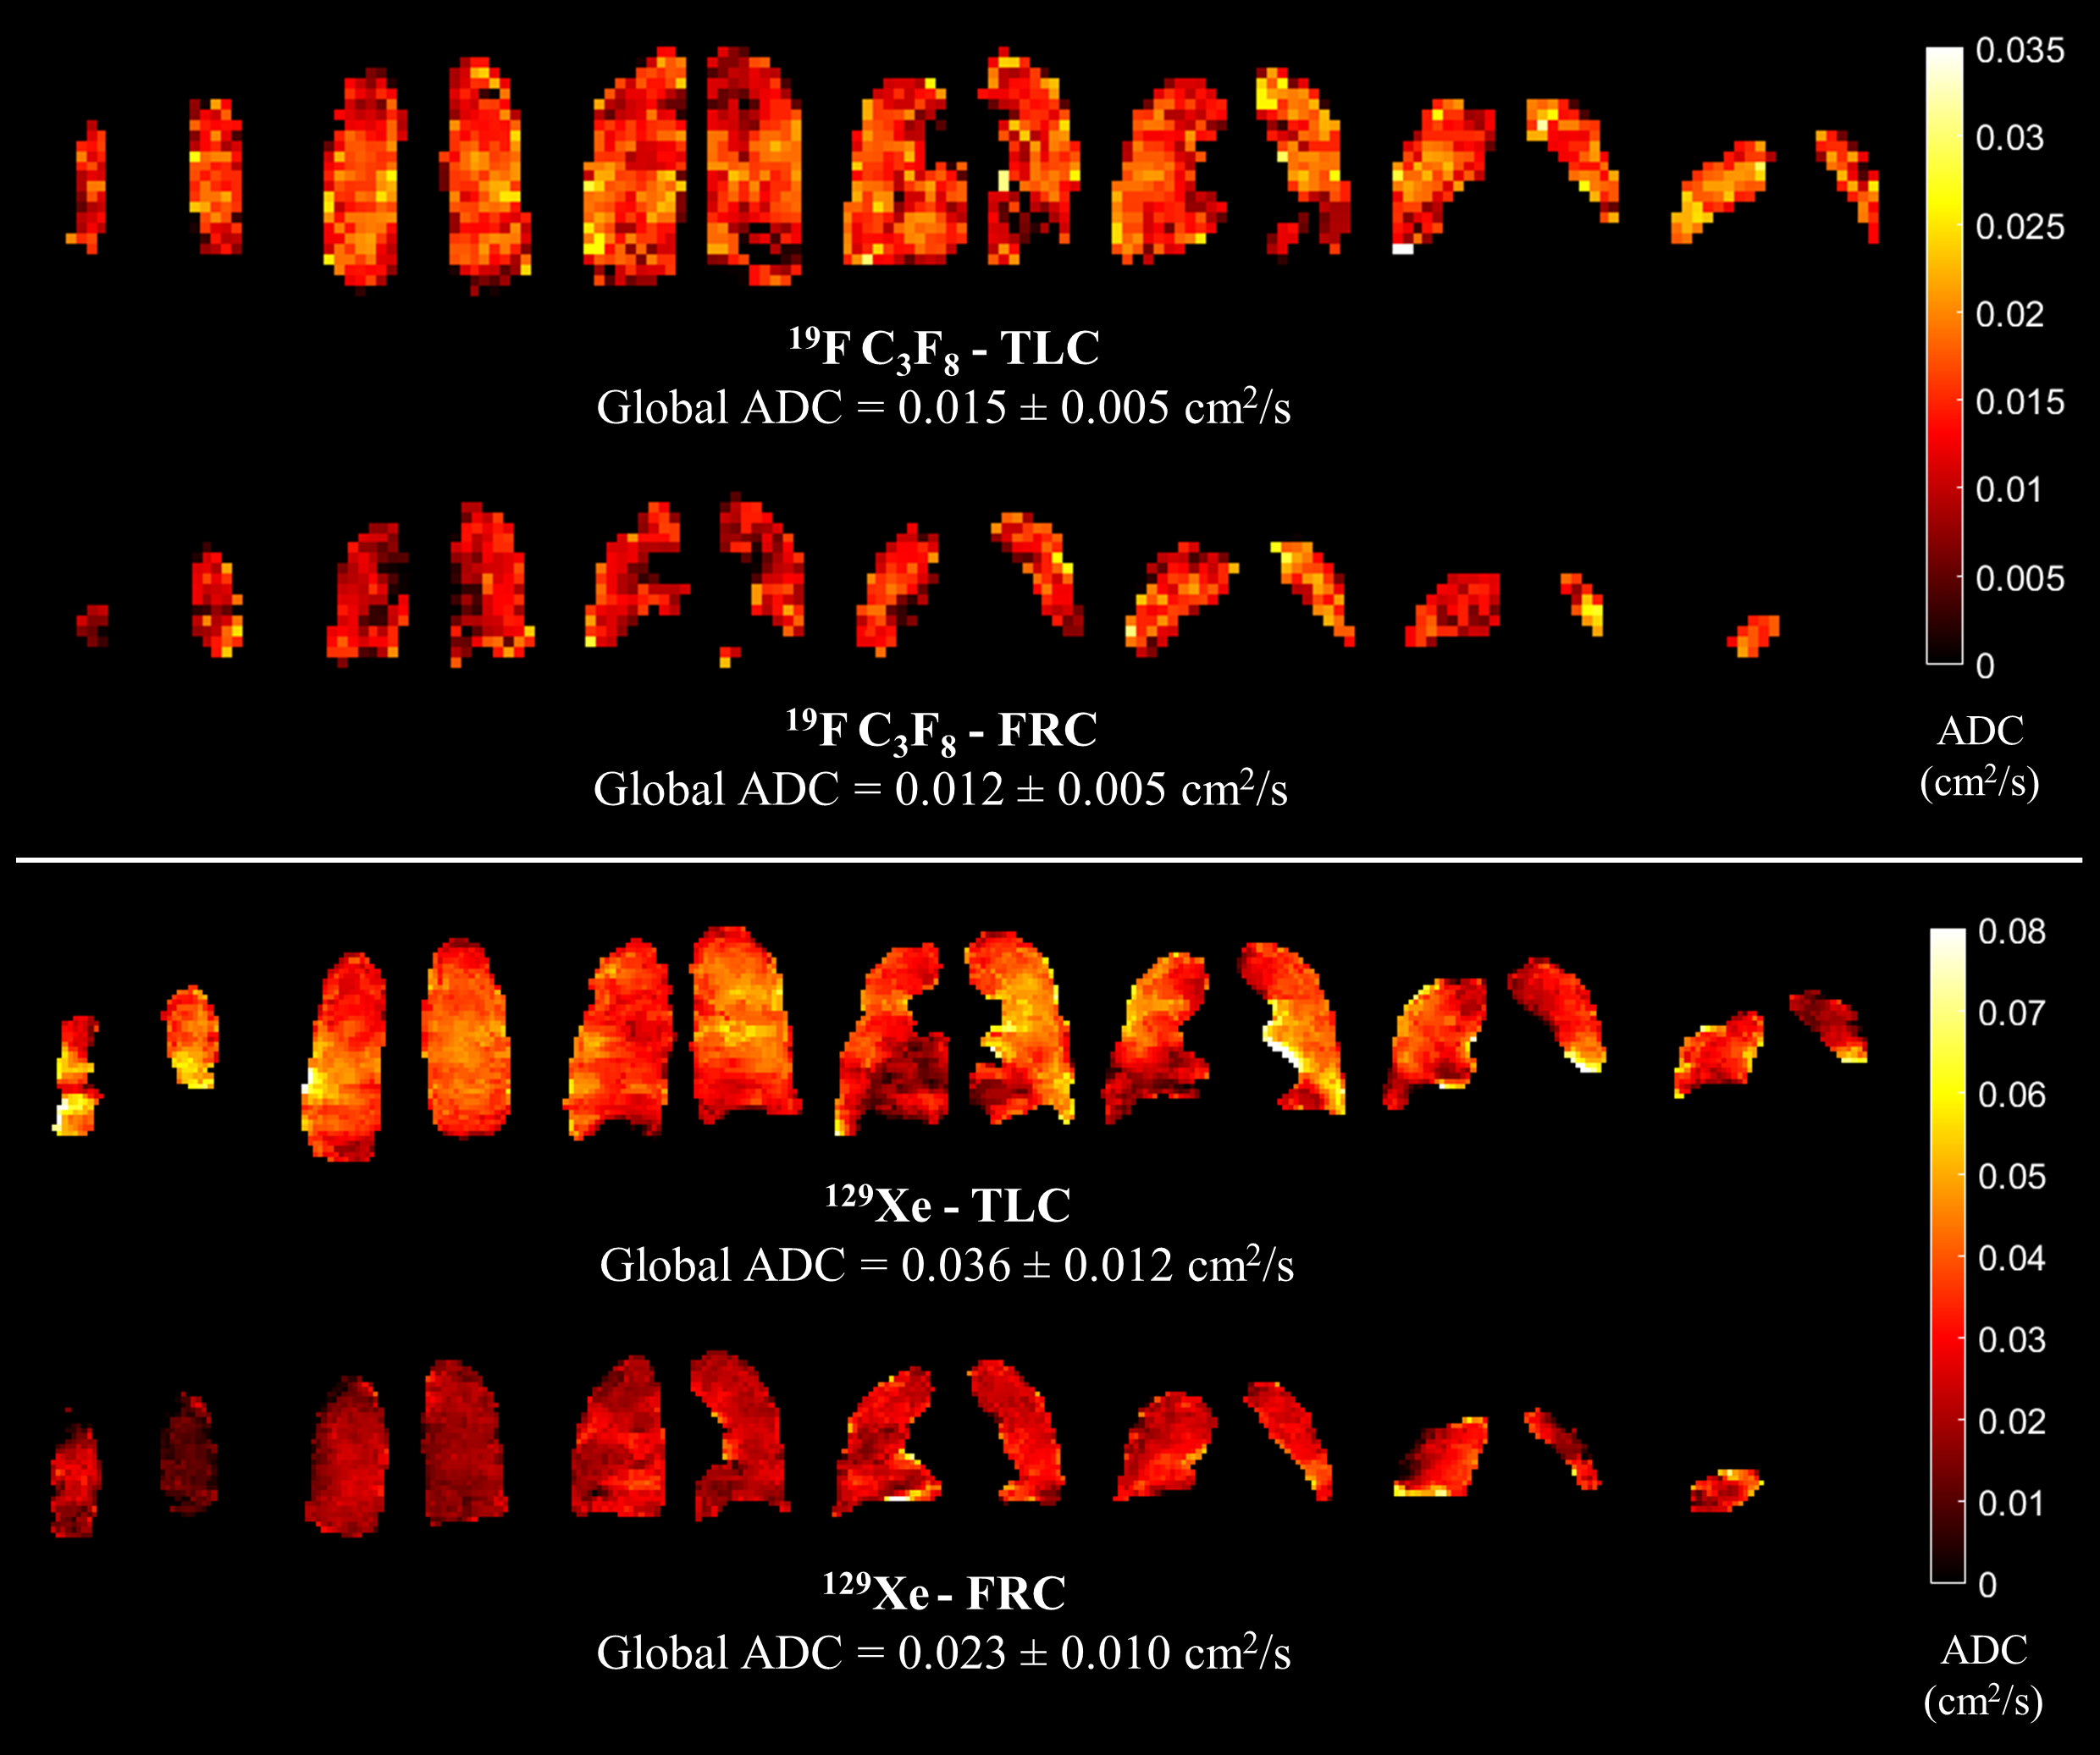
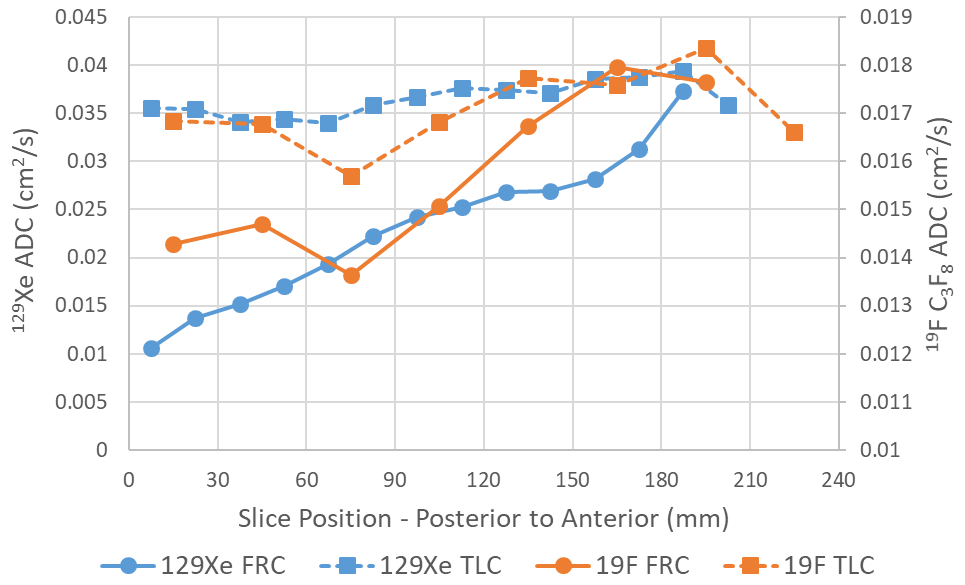
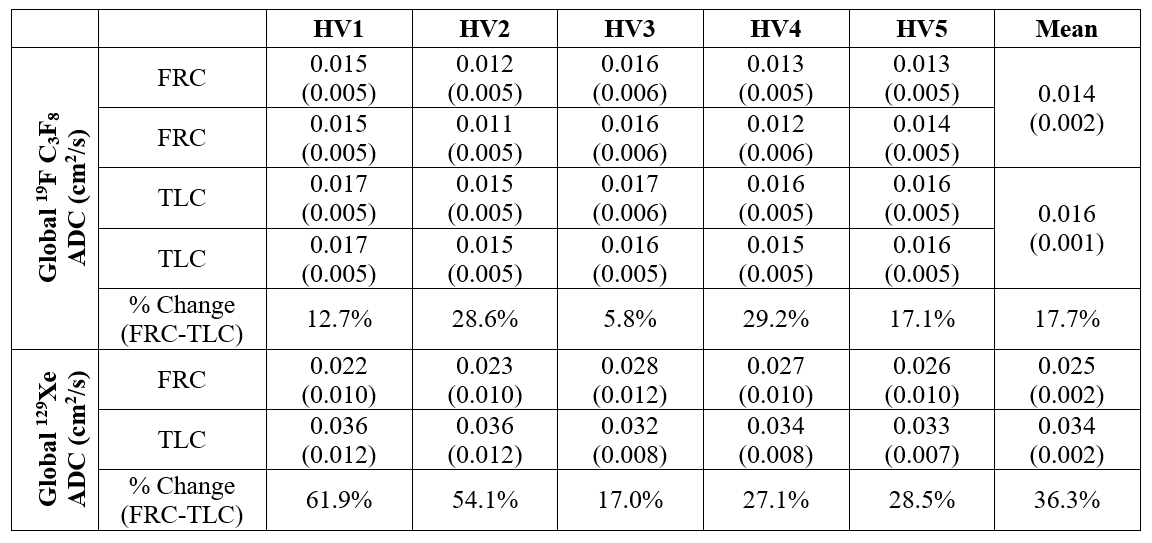
Table 2 provides a summary of global ADC values from 19F and 129Xe acquisitions for each healthy volunteer. Coronal 19F and 129Xe ADC maps for a representative healthy volunteer are shown in Figure 1. The mean D0 of the fluorinated gas mixture in the bag was 0.024 cm2/s, similar to the reported D0 (0.021 cm2/s) of C3F8 5. In all five healthy volunteers, the global mean 19F ADC values at both FRC and TLC are smaller than the D0 indicating there is diffusion restriction within the lungs. The C3F8 ADC values are similar to C2F6 ADC values (~0.017 cm2/s) obtained in excised human lungs using the same diffusion time and b-values 5,6. C3F8 ADC values were also significantly different between inflation levels (P=0.008) with a mean difference of 17.7% from FRC to TLC. A reduction in the gravitational (posterior-anterior) ADC gradient was observed from FRC to TLC with both gases (Figure 2). The change in C3F8 ADC with lung inflation matches the trend observed previously with 3He 10 and 129Xe ADC in this study (Table 2); suggesting C3F8 ADC is sensitive to lung inflation dependent changes in alveolar dimensions. C3F8 ADC values are significantly correlated with 129Xe values (r=0.69, P=0.029) in Figure 3, further demonstrating the potential of fluorinated gas DW-MRI.Conclusion
This work demonstrates the feasibility of in-vivo 19F ADC mapping in human lungs with C3F8, and its sensitivity to lung inflation level in healthy lungs. Future work will involve C3F8 ADC mapping in patients with COPD to fully evaluate the sensitivity of C3F8 to emphysematous changes in alveolar airspaces.Acknowledgements
This work was supported by NIHR grant NIHR-RP-R3-12-027 and MRC grant MR/M008894/1. The views expressed in this work are those of the author(s) and not necessarily those of the NHS, the National Institute for Health Research or the Department of HealthReferences
1. A. Maunder, P. J. C. Hughes, H. F. Chan, G. Norquay, G. J. Collier, O. Rodgers, I., et al., "Comparing 19F C3F8 Lung Ventilation Imaging with Hyperpolarized 129Xe: Similarities and Limitations," in Proc. Intl. Soc. Mag. Reson. Med., 2018, p. 1085.
2. B. T. Saam, D. A. Yablonskiy, V. D. Kodibagkar, J. C. Leawoods, D. S. Gierada, J. D. Cooper, et al., "MR imaging of diffusion of 3He gas in healthy and diseased lungs," Magn Reson Med, vol. 44, pp. 174-179, 2000.
3. S. S. Kaushik, Z. I. Cleveland, G. P. Cofer, G. Metz, D. Beaver, J. Nouls, et al., "Diffusion-weighted hyperpolarized 129Xe MRI in healthy volunteers and subjects with chronic obstructive pulmonary disease," Magn Reson Med, vol. 65, pp. 1154-65, Apr 2011.
4. J. Ruiz-Cabello, J. M. Perez-Sanchez, R. Perez de Alejo, I. Rodriguez, N. Gonzalez-Mangado, G. Peces-Barba, et al., "Diffusion-weighted 19F-MRI of lung periphery: Influence of pressure and air-SF6 composition on apparent diffusion coefficients," Respir Physiol Neurobiol, vol. 148, pp. 43-56, Aug 25 2005.
5. R. E. Jacob, Y. V. Chang, C. K. Choong, A. Bierhals, D. Zheng Hu, J. Zheng, et al., "19F MR imaging of ventilation and diffusion in excised lungs," Magn Reson Med, vol. 54, pp. 577-85, Sep 2005.
6. M. Conradi, B. Saam, D. Yablonskiy, and J. Woods, "Hyperpolarized 3He and perfluorocarbon gas diffusion MRI of lungs," Progress in Nuclear Magnetic Resonance Spectroscopy, vol. 48, pp. 63-83, 2006.
7. I. K. Ball, M. J. Couch, T. Li, M. S. Fox, J. A. Lovis, R. Hashoian, et al., "19F Apparent Diffusion Coefficient MRI of Inert Fluorinated Gases in Human Lungs," in Proc Intl Soc Mag Reson Med, 2013.
8. A. Maunder, M. Rao, F. J. L. Robb, and J. M. Wild, "Combined Transmit Array and 8-Channel Receive Coil Array for 19F/1H for Human Lung Imaging at 1.5 T Utilizing MEMS Transmit-Receive Detuning," Proc. Intl. Soc. Mag. Reson. Med., vol. 25, p. 1052, 2017.
9. H. F. Chan, N. J. Stewart, G. Norquay, G. J. Collier, and J. M. Wild, "3D diffusion-weighted (129) Xe MRI for whole lung morphometry," Magn Reson Med, vol. 79, pp. 2986-2995, Jun 2018.
10. A. F. Halaweish, E. A. Hoffman, D. R. Thedens, M. K. Fuld, J. P. Sieren, and E. J. van Beek, "Effect of lung inflation level on hyperpolarized 3He apparent diffusion coefficient measurements in never-smokers," Radiology, vol. 268, pp. 572-80, Aug 2013.
Figures