4129
Two-site Reproducibility of Hyperpolarized 129Xe MRI Ventilation in Severe Asthma: Implications for Multicenter Clinical Studies1Department of Medicine, McMaster University, Hamilton, ON, Canada, 2Firestone Institute for Respiratory Health, St. Joseph’s Healthcare, Hamilton, ON, Canada, 3Robarts Research Institute, Western University, London, ON, Canada, 4Imaging Research Centre, St. Joseph's Healthcare, Hamilton, ON, Canada, 5Department of Medical Biophysics, Western University, London, ON, Canada, 6Department of Medicine, Western University, London, ON, Canada, 7Department of Electrical and Computer Engineering, McMaster University, Hamilton, ON, Canada
Synopsis
Despite the demonstrated sensitivity of
hyperpolarized 129Xe MRI biomarkers to pulmonary disease onset,
progression and treatment response, comparison of findings across sites is
challenging as acquisition protocols and procedures are not standardized. To better understand the agreement of
hyperpolarized 129Xe MRI ventilation across different clinical
sites, severe asthmatics underwent 129Xe
MRI at two sites within 24 hours. 129Xe
MRI ventilation defect percent was significantly correlated between sites
despite inter-site differences in 129Xe polarization, 129Xe
volume, gas mixture composition and signal-to-noise ratio. These findings have important implications when
generalizing 129Xe MRI data collected at different sites and
undertaking multicenter studies.
Introduction
Hyperpolarized 129Xe MRI
has been developed and validated as a research tool to non-invasively visualize
and quantify the functional consequence of airway obstruction in pulmonary
disease.1 Despite the demonstrated sensitivity
of 129Xe MRI biomarkers to disease onset, progression and treatment
response, comparison of findings across sites is challenging as acquisition
protocols and procedures are not standardized.
Although several studies have demonstrated high scan-rescan
reproducibility at a single site,2,3 inter-site
agreement has not been investigated and is controversial as measurements may be
affected by numerous variables including scanner field strength, scanner vendor,
coil design, 129Xe polarization, 129Xe gas mixture
composition and administration technique.
Therefore, in severe asthmatics, our objective was to evaluate the agreement
of hyperpolarized 129Xe MRI ventilation across two different
clinical sites using 3T MR scanners with similar hardware and software.
Methods
Seven severe asthmatics (five males, two females; mean age 49 years, range 32-71 years) provided written-informed-consent to an ethics-board-approved protocol and underwent spirometry and hyperpolarized 129Xe MRI pre- and post-bronchodilator at two sites within 24 hours: site 1 and 2. Site order was randomized. Images were acquired at the two sites using MRI systems with similar hardware and software (3.0 Tesla Discovery MR750, GEHC, USA) and the same quadrature birdcage 129Xe coil.4 Hyperpolarized 129Xe gas was provided by turn-key, spin-exchange polarizer systems (Polarean 9820 at site 1, polarization range: 35-45%; Polarean 9800 at site 2, polarization range: 7-15%). 129Xe ventilation images were acquired using a 3D fast gradient-echo pulse sequence5 in breath-hold after inspiration of 1.0L of gas (129Xe/4He mixture at site 1; 129Xe/N2 mixture at site 2) from functional residual capacity.
Data Analysis: 129Xe MRI ventilation signal-to-noise ratio (SNR) was calculated and semi-automated segmentation was performed to generate ventilation defect percent (VDP) values according to previously described methods.5
Statistical Analysis: Pre- and post-bronchodilator data were pooled for the purpose of this preliminary analysis. Wilcoxon matched-pairs signed rank tests were performed to provide the statistical significance of inter-site differences in 129Xe polarization, hyperpolarized 129Xe volume, SNR, VDP and the forced expiratory volume in one second (FEV1). Linear regression (r2) and Lin’s concordance correlation coefficient (ρc) were used to evaluate the inter-site reproducibility of VDP and FEV1. Bland-Altman analysis was used to measure agreement. Statistics were performed using GraphPad Prism version 7.00 (La Jolla, USA).
Results
The mean time between imaging sessions at each site was 21 hours (range 6-28 hours). Inter-site differences in 129Xe polarization, volume administered and SNR are summarized in Figure 1. 129Xe polarization (Site 1=29±5%, Site 2=11±1%, p=0.0001) and SNR (Site 1=40±19, Site 2=23±5, p=0.02) were greater at Site 1, and the volume of hyperpolarized 129Xe administered to the subject (Site 1=406±18mL, Site 2=522±36mL, p=0.0001) was less at Site 1. Figure 2 shows coronal center-slice 129Xe ventilation images acquired at each site for five subjects. For subjects 1 and 2, small differences in 129Xe gas distribution were observed between sites; however, focal abnormalities in gas distribution were visually larger and/or more numerous at site 2 for the remaining subjects. Figure 3 quantitatively summarizes the inter-site reproducibility of 129Xe VDP. There was a statistically significant bias (mean of paired difference, -3%; 95% limits of agreement, -10% to 5%) towards smaller 129Xe VDP at site 1 (8±7%) than at site 2 (11±9, p=0.046). Importantly however, 129Xe VDP at site 1 and 2 were strongly correlated (r=0.94, ρc=0.83, r2=0.83, p<0.0001). Repeated spirometry also showed a significant bias towards greater FEV1 (mean difference, 0.12L; 95% limits of agreement, -0.16L to 0.41L) at site 1 (2.22±0.72L) compared to site 2 (2.09±0.67L, p=0.007). The inter-site difference in VDP was not related to the inter-site difference in FEV1 (r=-0.31, p=0.28), 129Xe polarization (r=0.25, p=0.39), hyperpolarized 129Xe volume (r=0.16, p=0.59) or SNR (r=-0.17, p=0.58).Discussion
Hyperpolarized 129Xe MRI performed in severe asthmatics at two different sites (about 150km distance) was highly correlated, although qualitative and quantitative differences were observed which may be due to site-specific gas mixture differences (129Xe/4He versus 129Xe/N2 mixture) or patient physiology. While scan-rescan studies are necessary to determine the effect of gas mixture differences, there is the potential that the time between scans also played a role.Conclusions
Hyperpolarized 129Xe MRI VDP, measured in seven subjects at two-sites within 24-hours, was strongly and significantly correlated despite inter-site differences in 129Xe polarization, 129Xe volume, gas mixture composition and SNR. Qualitative and quantitative inter-site differences in 129Xe regional gas distribution and VDP point to site-specific variability that is pertinent to consider when pooling data acquired at different sites in multicenter studies.Acknowledgements
No acknowledgement found.References
1. Ebner L, Kammerman J, Driehuys B, Schiebler ML, Cadman RV, Fain SB. The role of hyperpolarized 129Xe in MR imaging of pulmonary function. Eur J Radiol. 2017;86:343-352.
2. Mathew L, Evans A, Ouriadov A, et al. Hyperpolarized 3He magnetic resonance imaging of chronic obstructive pulmonary disease: reproducibility at 3.0 tesla. Acad Radiol. 2008;15(10):1298-1311.
3. Stewart NJ, Chan HF, Hughes PJC, et al. Comparison of 3He and 129Xe MRI for evaluation of lung microstructure and ventilation at 1.5T. J Magn Reson Imaging. 2018.
4. Farag A, Wang J, Ouriadov A, Parraga G, Santyr G. Unshielded and Asymmetric RF Transmit Coil for Hyperpolarized 129Xe Human Lung Imaging at 3.0T 2012;Proc. Intl Soc Mag Reson Med.
5. Svenningsen S, Kirby M, Starr D, et al. Hyperpolarized 3He and 129Xe MRI: differences in asthma before bronchodilation. J Magn Reson Imaging. 2013;38(6):1521-1530.
Figures
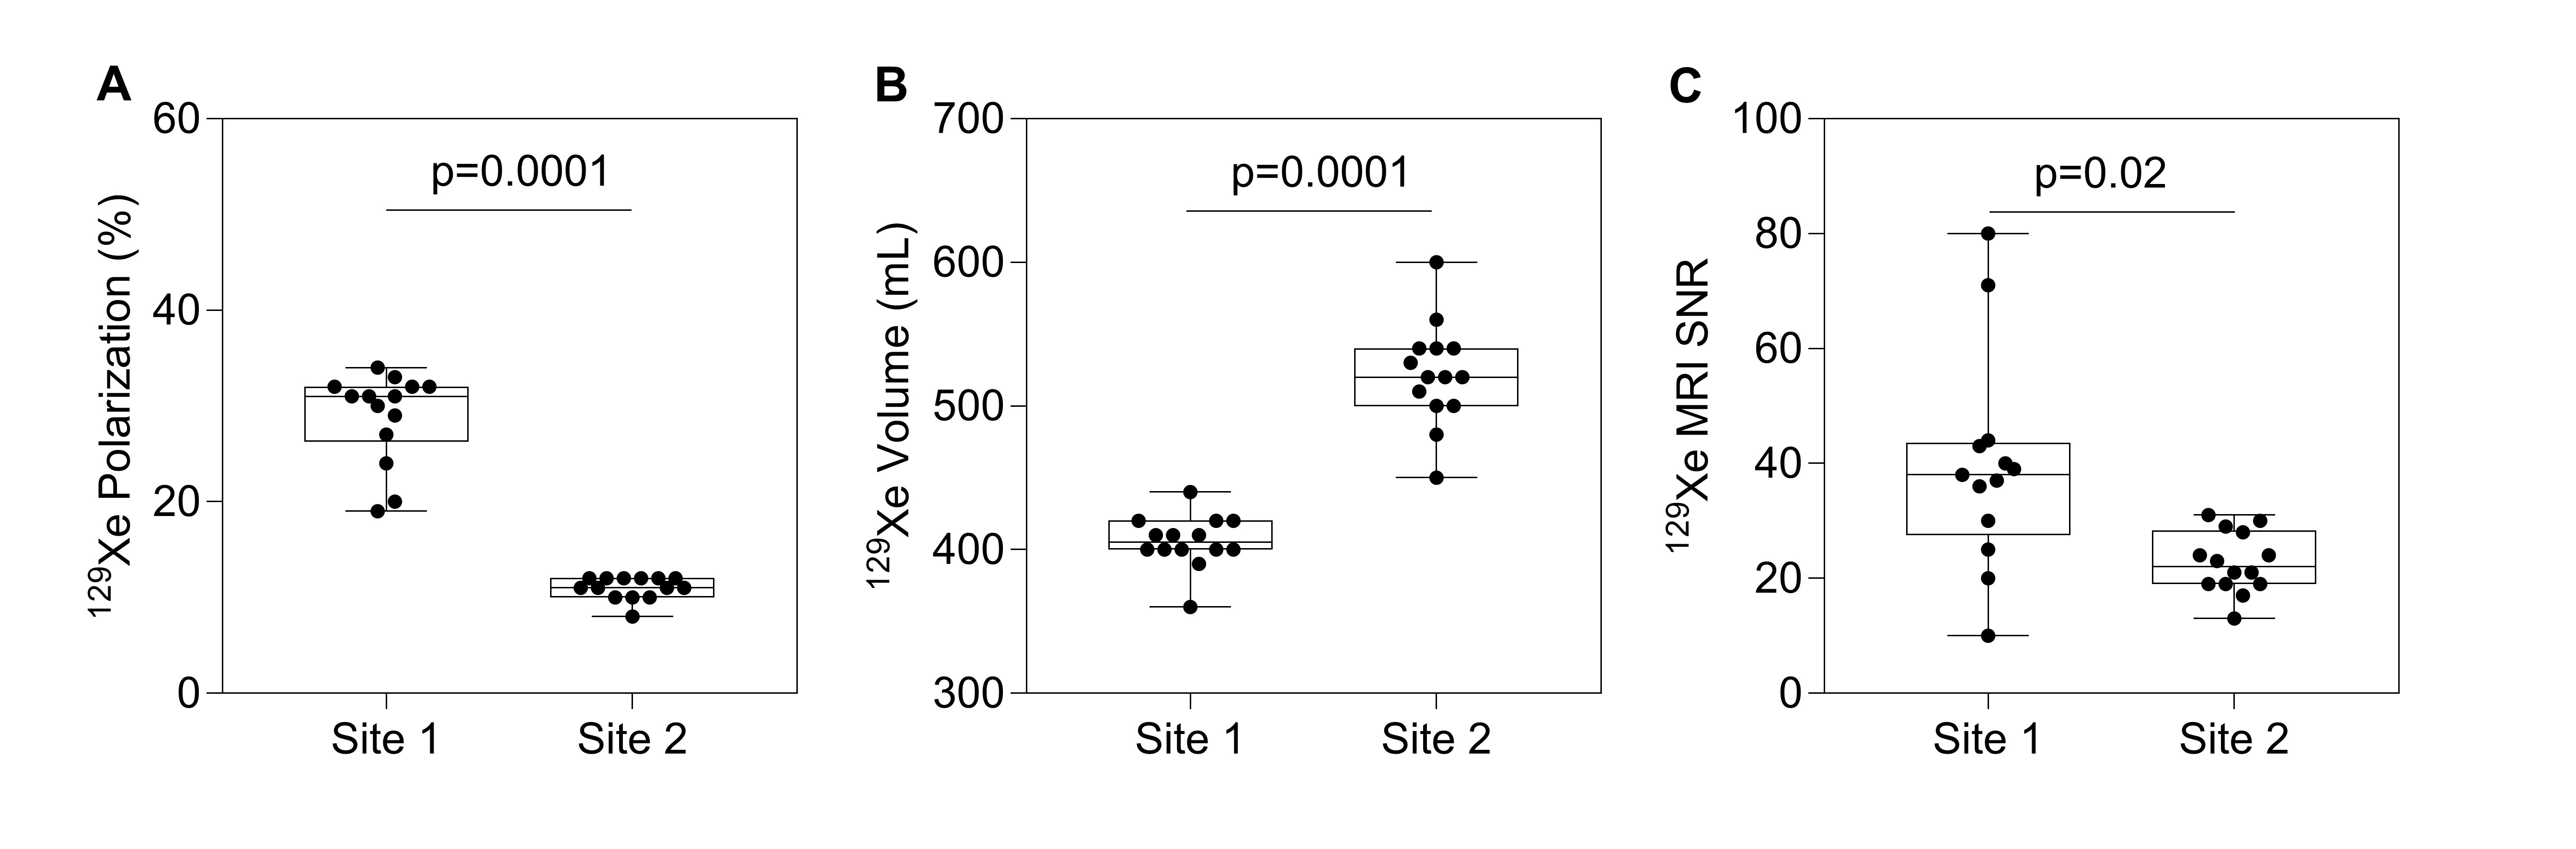
Figure 1. 129Xe polarization (A), volume of hyperpolarized 129Xe administered to the subject (B), and hyperpolarized 129Xe MRI SNR (C) at site 1 and 2.
Box and whisker plots show the minimum, 25th percentile, median, 75th percentile and maximum with individual data points superimposed on the plot. P-values were determined using a Wilcoxon matched-pairs signed rank test.
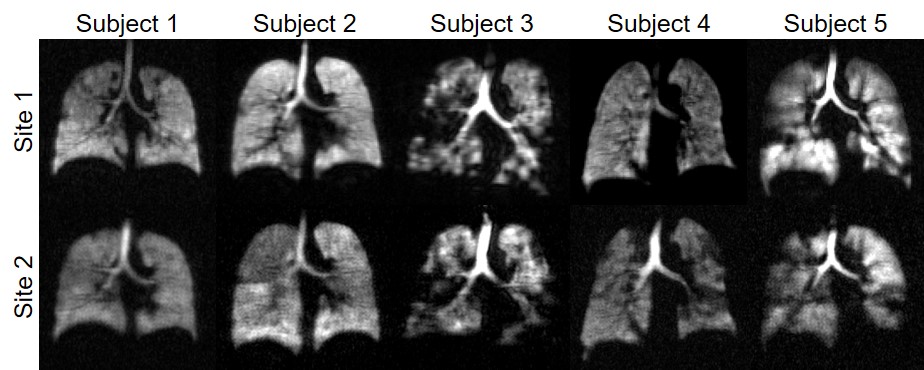
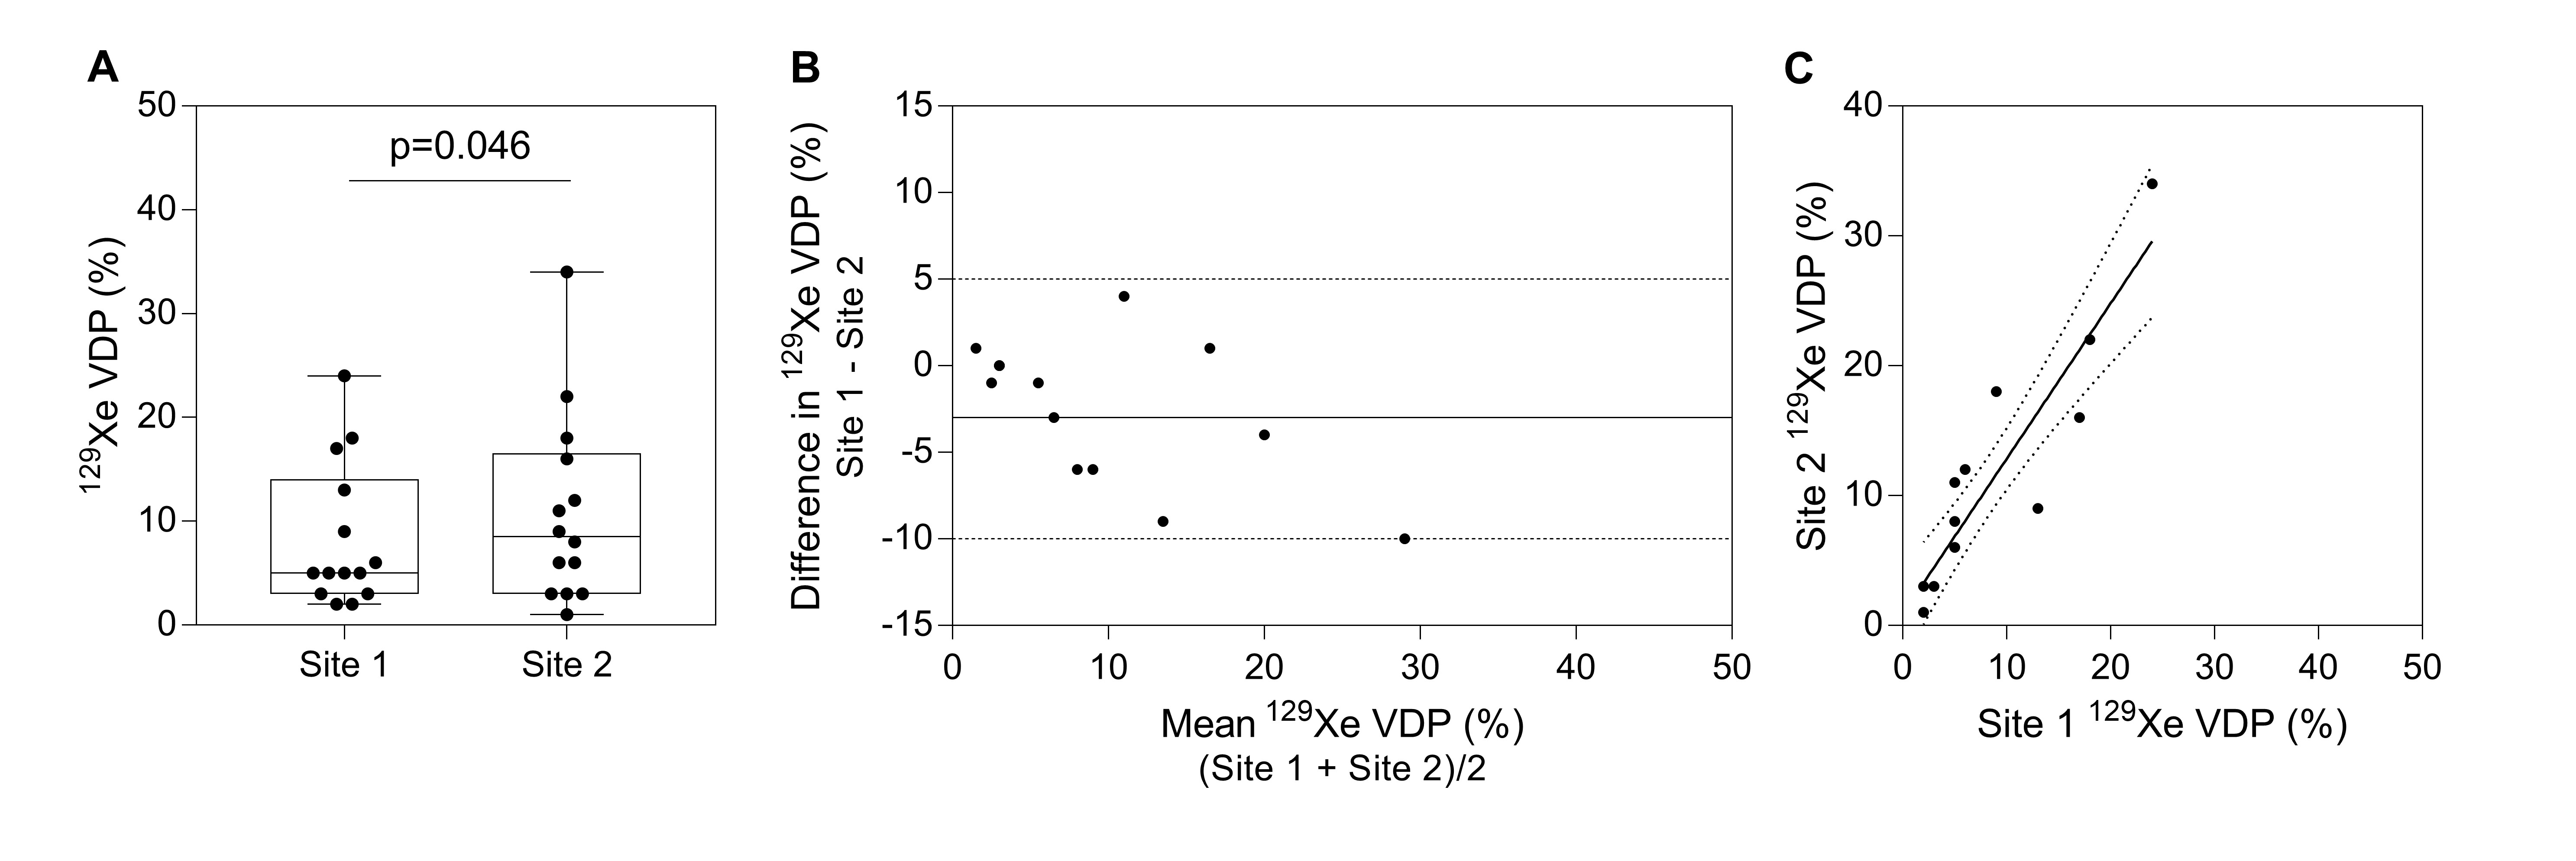
Figure 3. Inter-site reproducibility of 129Xe MRI VDP
(A) Lower 129Xe VDP at site 1 (8±7%) than at site 2 (11±9, p=0.046). Box and whisker plots show the minimum, 25th percentile, median, 75th percentile and maximum with individual data points superimposed on the plot.
(B) Bland-Altman plot of the difference between 129Xe VDP at site 1 and 2. Plot shows the mean of the paired differences (solid line) and the 95% limits of agreement (dotted lines). The mean difference was -3% (95% limits of agreement, -10% to 5%).
(C) Relationship between 129Xe VDP at site 1 and 2 (r=0.94, ρc=0.83, r2=0.83, p<0.0001).