4128
A magnetic susceptibility model of hyperpolarized 129Xe spectroscopy in alveolar tissues1Medical Physics, University of Wisconsin, Madison, Madison, WI, United States
Synopsis
Hyperpolarized 129Xe MRI has been used to characterize gas exchange in the lung by measuring xenon dissolved in the red blood cells and pulmonary barrier tissues. However, recent work identified a potential third component of the dissolved-phase spectrum, observed as a splitting of the barrier peak. We propose to explain the appearance of this peak using a signal model that considers the susceptibility differences at the air tissue interface of the alveoli. Integrating this model into whole lung HP 129Xe spectroscopy measures in 8 healthy subjects and 16 patients with idiopathic pulmonary fibrosis, we find improved correlations between the RBC-to-barrier ratio and DLCO %predicted compared to conventional modeling of the dissolved-phase spectrum.
Introduction
Imaging and whole lung spectroscopy of hyperpolarized (HP) 129Xe dissolved in the pulmonary tissues has been shown to characterize gas exchange within the lung [1]. The dissolved-phase HP 129Xe is composed of two resonant peaks – xenon in the red blood cells (RBC) at 216 ppm and in the parenchymal barrier tissues at 197 ppm. A recent paper raised the possibility of an additional component in the dissolved-phase spectrum, seen as a separation of the barrier peak into two distinct resonances [2]. While the properties of the new barrier peak were repeatable across subjects, there was no clear physical interpretation of the proposed additional resonance. This led Robertson, et al [2] to theorize that the new peak arises from susceptibility effects at the air-tissue interfaces of the lung.
In this work, we employ a model of the HP 129Xe signal in the tissues of the alveolar surface that considers the signal dynamics induced by the air-tissue interfaces. We show that this model successfully describes the observation of two resonant peaks in the barrier tissues in whole lung spectroscopy. Furthermore, this model results in improved correlation between the derived RBC-to-barrier ratios and the diffusing capacity of the lung for carbon monoxide (DLCO), a pulmonary function test measuring gas exchange.
Theory
The dissolved-phase resonances have been treated as four parameter Lorentzian curves with distinct magnitudes ($$$A$$$), phases ($$$\phi$$$), frequencies ($$$f$$$) and exponential decay time constants ($$$T_2^*$$$),
$$s(t) = A e^{i\phi + (2\pi i f - \frac{1}{T_2^*})t}$$.
Buschle, et. al. have proposed a signal model for excited spins in the alveolar tissues based upon the magnetic susceptibility difference between air and tissue [3]. Based on a thin-sphere geometry, the signal dynamics are given by:
$$s(t) = A e^{i\phi+(i(\frac{\Delta\chi\gamma B_0}{3} + 2\pi f)-\frac{1}{T_2^*})t)} \frac{1+i}{4\sqrt{\Delta\chi\gamma B_0 t}} erfi ([1-i]\sqrt{\Delta\chi \gamma B_0 t})$$
where $$$\Delta\chi = \chi_{air}-\chi_{tissue}$$$ and $$$erfi$$$ is the imaginary error function. Figure 1 shows the dynamics of this model both in the time domain and frequency domain. The modeled signal shows two distinct peaks in the frequency domain, consistent with the observed splitting of the barrier peaks.
Methods
8 healthy subjects (aged 45-69 years) and 16 patients with idiopathic pulmonary fibrosis (IPF) (aged 55-77 years) underwent HP 129Xe whole lung spectroscopy at 1.5T. Subjects inhaled 200mL of HP 129Xe diluted with 800 mL of N2 for a 15s breathhold, during which 200 FIDs were acquired (TE/TR = 0.7/20.0ms, flip ≈20°, BW = 15.63 kHz).
The acquired spectra were averaged together, then fit in the time domain to a Lorentzian curve at the RBC resonance and alveolar signal model at the barrier resonance. The gyromagnetic ratio ($$$\gamma$$$) and magnetic field strength ($$$B_0$$$) were held constant at their physical values, while the effective susceptibility difference ($$$\Delta\chi$$$) was fit as a model parameter. The resulting fits were compared to the two Lorentzian peak (RBC, Barrier) and three Lorentzian peak (RBC, Barrier 1, Barrier 2) models.
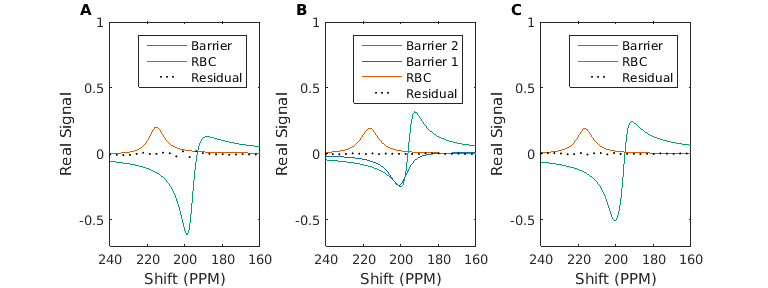
Results
Figure 2 shows a comparison of the fits and residuals between the three models in a healthy normal subject. The use of the alveolar signal model for the barrier resonance results in a substantially lower residual of fit than the typical two-Lorentzian peak fit. As seen in Figure 3, the RBC-to-Barrier ratios show increased correlation with DLCO when using the alveolar signal model. Additionally, $$$\Delta\chi$$$ was significantly correlated with DLCO (Figure 4).Discussion
Due to the reduced residual of fit to measured data and the improved correlation with DLCO, we believe accounting for the susceptibility induced signal dynamics in the barrier tissues is important when analyzing dissolved-phase HP 129Xe signal. In particular as demonstrated in Figure 1, at the longer acquisition times used in whole lung spectroscopy (>=20ms) the observed signal deviates substantially from the exponential decay that is typically assumed. If unaccounted for, these dynamics will confound estimates of the amount of Xenon in the RBC and barrier compartments.Conclusion
The reported appearance of two spectrally close but out of phase barrier peaks may be explained physically by the susceptibility differences between the airspaces and alveolar walls using the proposed alveolar signal model.Acknowledgements
The authors would like ot acknowledge funding and support from the Pulmonary and Metabolic Imaging Center and the University of Wisconsin, Madison, and NIH/NCRR S10 OD016394.References
[1] J. M. Wang et al., “Using Hyperpolarized 129Xe MRI to Quantify Regional Gas Transfer in Idiopathic Pulmonary Fibrosis,” Thorax, vol. 73, no. 1, pp. 21–28, Jan. 2018.
[2] Robertson, Scott H. et al., “Uncovering a third dissolved‐phase 129Xe resonance in the human lung: Quantifying spectroscopic features in healthy subjects and patients with idiopathic pulmonary fibrosis,” Magn. Reson. Med., vol. 78, no. 4, pp. 1306–1315, Sep. 2017.
[3] L. R. Buschle et al., “Dephasing and diffusion on the alveolar surface,” Phys. Rev. E, vol. 95, no. 2, p. 022415, Feb. 2017.
Figures