4125
Whole-Tumor Histogram and Textural Analysis of Model-based T2 Mapping for the Ki-67 Labeling Index of Breast Cancer1Radiology, Fudan University Shanghai Cancer Center, Shanghai, China, 2Radiology, Longhua Hospital, Shanghai University of Traditional Chinese Medicine, Shanghai, China, 3MR Application Development, Siemens Shenzhen Magnetic Resonance, Shenzhen, China, 4MR Application Predevelopment, Siemens Healthcare, Erlangen, Germany, 5Advanced Clinical Imaging Technology, Siemens Healthcare AG Switzerland, Lausanne, Switzerland
Synopsis
Recently, there has been increased interest in quantitative MR parameters for assessing tumor proliferation. In this study, we proposed the use of whole-tumor histogram texture features using the model-based T2 mapping method GRAPPATINI to differentiate the positive and negative Ki-67 status of breast cancer. Classification performed between Ki-67-positive and Ki-67-negative groups resulted in an area under the ROC curve of 0.808.
Introduction
Breast cancer is a heterogeneous disease. The Ki-67 labelling index (LI) indicates the level of tumor aggressiveness, with a higher Ki-67 LI associated with adverse overall or progression free survival [1]. Recently, MR DCE and DWI potentially provided important information for the assessment of the Ki-67 LI of breast cancer [2, 3]. To our knowledge, there has been no study that shows the relationship between the parameters of the R2 value and Ki-67 LI. The purpose of this study was to evaluate whole-tumor histogram and textural features from model-based accelerated R2 maps in the correlation of the Ki-67 status with breast cancer.Methods
This prospective study included 19 patients (mean age, 49.8 years; range 35 - 73 years) who underwent breast MRI before surgery and were diagnosed with pathologically-confirmed breast invasive ductal carcinoma (IDC). A sample was considered positive if the Ki-67 LI was greater than 14% (n = 13) and was otherwise considered negative (n = 6). Images were obtained on a 3T MRI scanner (MAGNETOM Skyra; Siemens Healthcare, Erlangen, Germany). The prototype model-based GRAPPATINI T2 mapping sequence [4] was performed with the following parameters: TR = 7380 ms; number of echos =16 with TEmin/deltaTE/TEmax = 10.8/10.8/172.8 ms; field of view = 350 x 350 mm2; fat saturation mode of spectral adiabatic inversion recovery (SPAIR); matrix = 320 x 224; slice thickness = 5.0 mm; number of slices= 30; under-sampling factor = 5; and duration = 3:36 min. T2/R2 maps as well as synthetic T2w images (based on T2 maps, simulated TE=100ms) were generated inline in the image reconstruction. The R2 map was loaded to the prototype MR Multiparametric Analysis software (Siemens Healthcare, Erlangen, Germany). Whole-tumor based histogram and texture analysis were performed. The histogram features included mean, standard deviation, median, percentiles (5th, 95th), skewness, excess, kurtosis and difference entropy. The textural features include difference variance, contrast, and entropy. The Student’s t-test was performed using SPSS (v22.0; IBM Corporation, New York) for pairwise comparisons. The receiver operating characteristic (ROC) curve of those significant parameters were plotted, and the area under the curve (AUC) of the ROC was calculated.Results
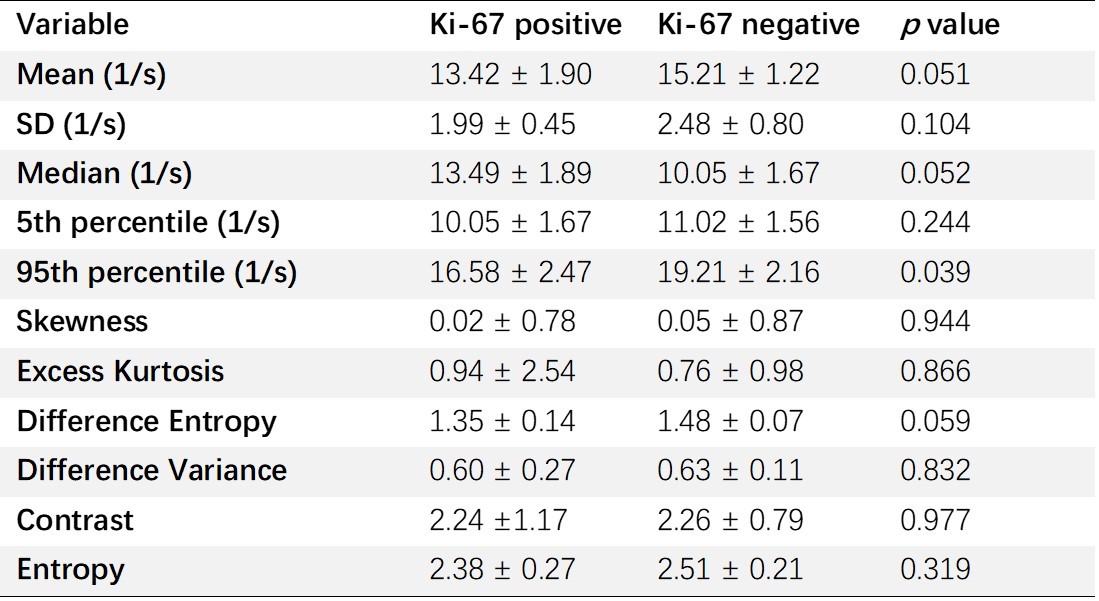
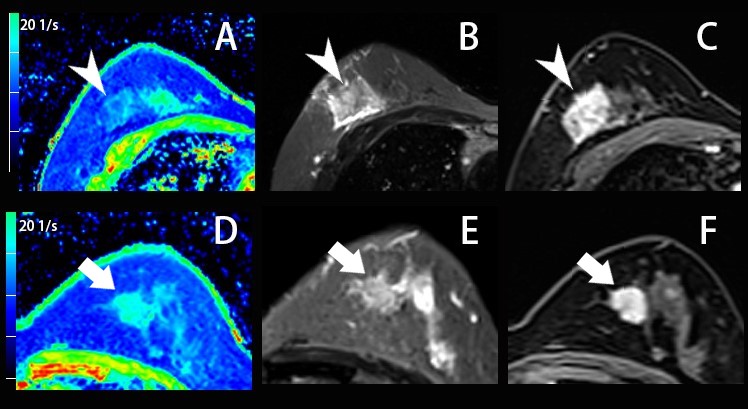
The classification performed with both pairwise datasets is presented in Table 1. The R295th percentile (p = 0.039) was significantly lower in the Ki-67-positive group than those in Ki-67-negative group. No significant differences were found across groups regarding other histogram features (p = 0.051 - 0.944). The area under the ROC curve for the classification between positive Ki-67 and negative Ki-67 groups was 0.808 (95% CI: 0.580, 1.000) using the R295th percentile features. Figure 1 shows exemplary R2 maps, synthetic T2w images (simTE=100ms), and the 1st phase of DCE images for the Ki-67-positive and Ki-67-negative breast cancers.Discussion and conclusion
In our study, we were able to acquire bilateral whole-breast R2 maps in a clinically feasible scan time of 3:36 min using a model-based iterative acceleration technique. Whole-tumor histogram features of the R2 map yielded promising results for discriminating between different Ki-67 levels of breast cancer. Our study result might indicate that the whole-tumor histogram analysis of the R2 map might have added value for assessing tumor proliferation of breast cancer in clinical practice.Acknowledgements
No.References
1. Inwald EC, Klinkhammer-Schalke M, Hofstadter F, et al. Ki-67 is a prognostic parameter in breast cancer patients: results of a large population-based cohort of a cancer registry. Breast Cancer Res Treat. 2013;139(2):539-52.
2. Martincich L, Deantoni V, Bertotto I, et al. Correlations between diffusion-weighted imaging and breast cancer biomarkers. European Radiology. 2012;22(7):1519-28.
3. Shin JK, Kim JY. Dynamic Contrast-Enhanced and Diffusion-Weighted MRI of Estrogen Receptor-Positive Invasive Breast Cancers: Associations Between Quantitative MR Parameters and Ki-67 Proliferation Status. Journal of Magnetic Resonance Imaging. 2017;45(1):94-102.
4. Hilbert T, Sumpf TJ, Weiland E, et al. Accelerated T2 mapping combining parallel MRI and model-based reconstruction: GRAPPATINI. J Magn Reson Imaging. 2018;48(2):359-68.
Figures