4122
Threshold isocontouring on high b-value diffusion weighted images in magnetic resonance mammography1The Key Laboratory for Interdisciplinary Research, Institute of Biophysics, China Academy of Sciences, Beijing, China, 2Department of Radiology, German Cancer Research Centre (DKFZ), Heidelberg, Germany, 3Medical Physics in Radiology, German Cancer Research Centre (DKFZ), Heidelberg, Germany, 4Radiological Practice at the ATOS Clinic Heidelberg, Heidelberg, Germany, 5Radiology Centre Mannheim, Mannheim, Germany, 6Department of Clinical and Interventional Radiology, University Hospital Heidelberg, Mannheim, Germany, 7Department of Radiology and Biomedical Imaging, University of California San Francisco, San Francisco, CA, United States, 8UCSF/UC Berkeley Joint Graduate Group in Bioengineering San Francisco, San Francisco, CA, United States, 9MacDiarmid Institute for Advanced Materials and Nanotechnology, School of Physical and Chemical Sciences, Victoria University of Wellington, Wellington, New Zealand, 10Institute of Radiology, University Hospital Erlangen, Friedrich-Alexander-Universität Erlangen-Nürnberg (FAU), Erlangen, Germany
Synopsis
Quantitative evaluation in clinical practice is important for accurate diagnosis, which is often difficult in breast diffusion measurements where large variability of the diffusion metrics is present. Motivated by similar appearance of malignant breast lesions in high b-value diffusion-weighted imaging (DWI) and positron emission tomography (PET), we propose a threshold isocontouring approach commonly used in PET to analyse breast DWI data with minimal inter-observer variability. Our results support that using a relative threshold level of 0.85 almost completely suppresses the intra- and inter-individual variability. This study suggests that the proposed approach is advantageous in the breast DWI data analysis and quantitative evaluation.
Introduction
Inter-observer variance is a major source of variability in quantitative breast diffusion weighted imaging (DWI) [1]. While newly developed clustering and iterative segmentation algorithms have shown excellent performance in organs, e.g. liver and brain infarcts [2,3], their applications to breast DWI may not succeed because of the heterogeneous structure and less visible boundaries of breast tissues in DW images.
High b-value images (with b$$$\geq$$$1500 s/mm2) were reported to be suitable for the detection of breast lesions at a magnetic field as low as 1.5 Tesla [4]. Here, we propose a straightforward approach for breast lesion segmentation and evaluate its feasibility combined with high b-value DWI data [5].
Methods
This study was approved by institutional and governmental ethical review boards. Written informed consent was obtained. Twenty female participants were imaged on a 1.5T Siemens MRI scanner (Magnetom Aera, Erlangen, Germany) prior to biopsy. DWI data was acquired with b-values of 0, 100, 750 and 1500 s/mm2 using an echo planar imaging sequence and an additional spectral attenuated inversion recovery technique for fat suppression.
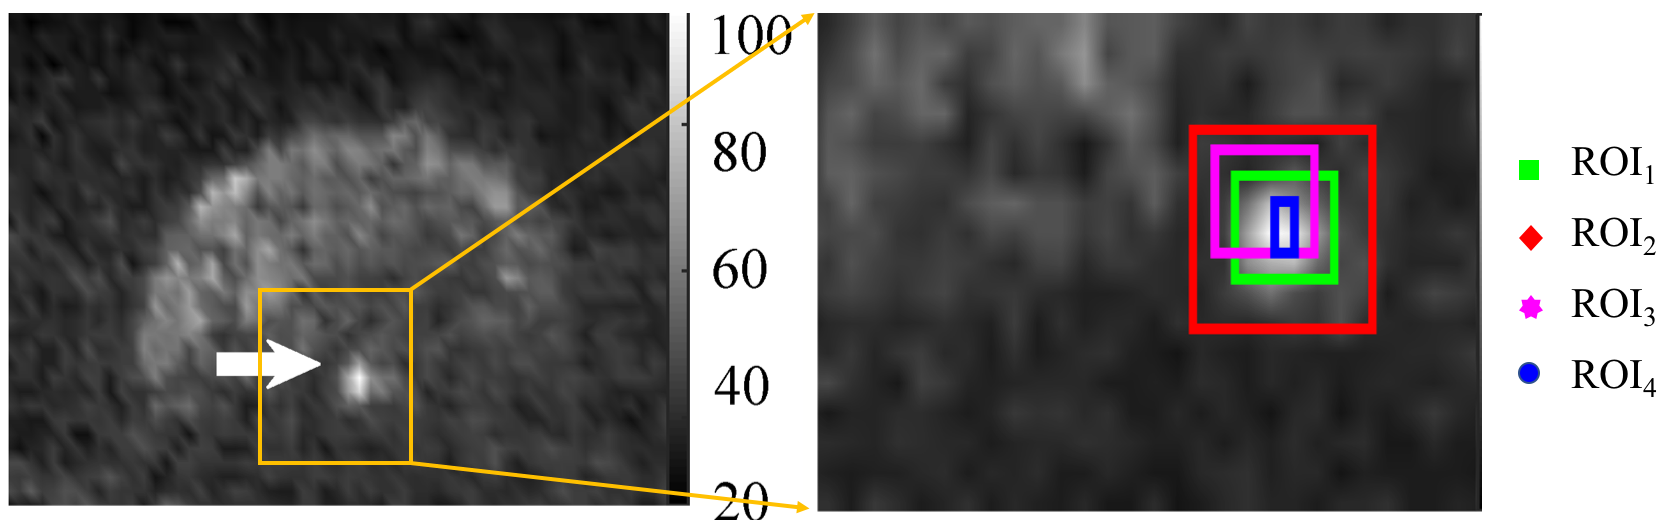
Four rectangular ROIs (ROI1,2,3,4) were determined to test the effect of varying ROI sizes and positions on the obtained diffusion metrics. ROI1 and ROI4 were drawn by two radiologists and included the voxel with the maximal signal intensity in the DW image with b=1500 s/mm2 (“b1500 image”). ROI2 expanded ROI1 by two pixels, whereas ROI3 shifted ROI1 by two voxels along both read and phase directions. Subsequently, a threshold ($$$\epsilon$$$) relative to the maximal signal intensity in the ROI was used to select a number of voxels for the following analysis. A bi-exponential intravoxel incoherent motion (IVIM) model was used to calculate the diffusion coefficient $$$D_{IVIM}$$$ and perfusion fraction $$$f$$$ [6]. Both diffusion metrics were evaluated either by ROI- or voxel-based analysis. For the ROI-based analysis, signals of all selected voxels were averaged and then fit to the IVIM equation (“Averaged Signal”). For the voxel-based analysis, the signal of each voxel was fitted individually and the mean of the diffusion metrics was calculated (“Pixelwise Mean”). Meanwhile, the median of diffusion metrics was calculated (“Pixelwise Median”).
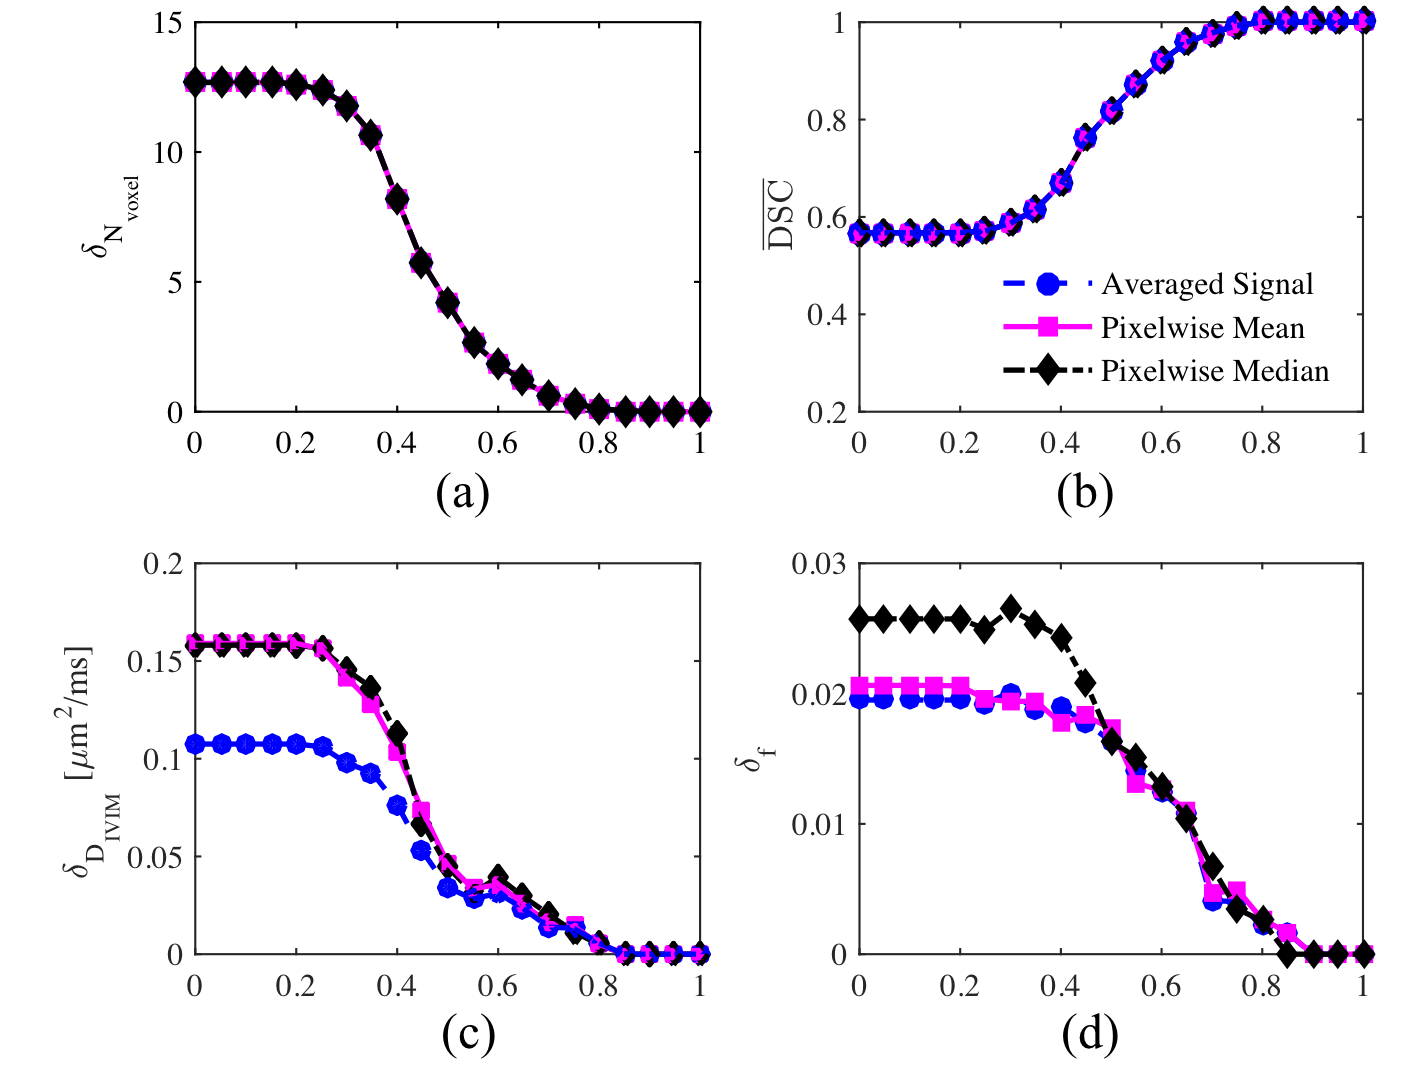
The average observer differences of voxel numbers $$$N_{voxels}$$$ , $$$D_{IVIM}$$$ and $$$f$$$ between ROI1 and ROI4 were calculated and defined as $$$\delta_{N_{voxels}}$$$, $$$\delta_{D_{IVIM}}$$$ and $$$\delta_f$$$ by replacing $$$X$$$ in the following equation:
$$\delta_X=\frac{1}{N_s}\sum^{N_s}_{i=1}\mid X_1-X_4\mid, $$
where $$$N_s$$$ is the number of subjects. $$$X_1$$$ and $$$X_4$$$ are the values obtained from ROI1 and ROI4, respectively. In addition, the Sørensen-Dice similarity coefficient $$$DSC$$$ [7] of ROI1 and ROI4 for each subject were firstly calculated and then averaged throughout all subjects to obtain $$$\overline{DSC}$$$.
Results and discussions
The four ROIs of one representative subject are shown in Figure 1. It is apparent that the ROIs were defined in a very different manner which illustrates the need for minimizing such observer-defined ROI deviations.
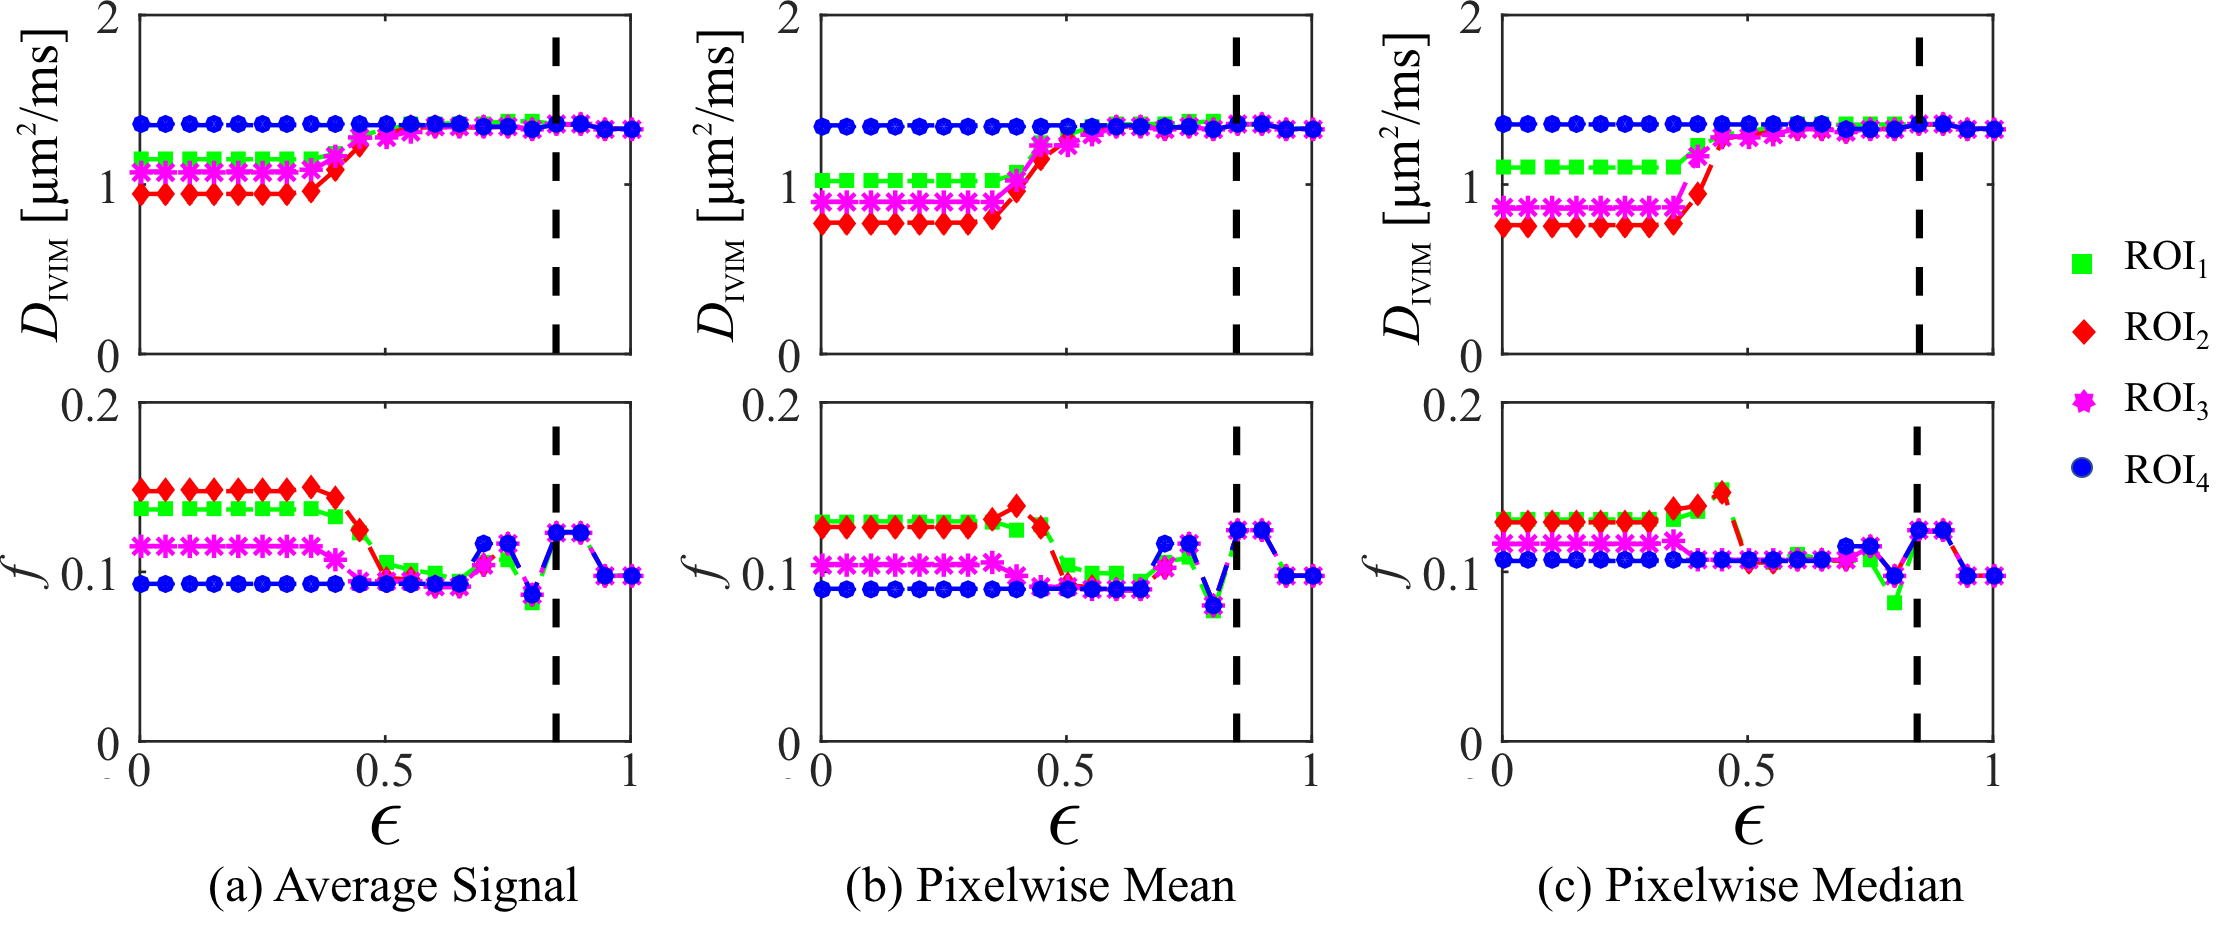
As a representative example, the dependence of $$$D_{IVIM}$$$ and $$$f$$$ on the relative thresholds for four ROIs of the subject in Figure 1 are shown in Figure 2. The $$$D_{IVIM}$$$ and $$$f$$$ values for four ROIs were diverse at small $$$\epsilon$$$, but converged at larger $$$\epsilon$$$. All metrics returned the same value for each ROI for $$$\epsilon\geq 0.85$$$.
The average observer differences $$$\delta_{N_{voxels}}$$$, $$$\delta_{D_{IVIM}}$$$, $$$\delta_f$$$ and averaged Sørensen-Dice similarity coefficients $$$\overline{DSC}$$$ of ROI1 and ROI4 are depicted in Figure 3. The larger $$$\epsilon$$$ , the smaller the average observer differences. For $$$\epsilon\geq 0.85$$$, the average observer differences almost vanish and $$$\overline{DSC}$$$ approaches 1. This holds true for all evaluations and proves the good performance of the threshold isocontouring approach.
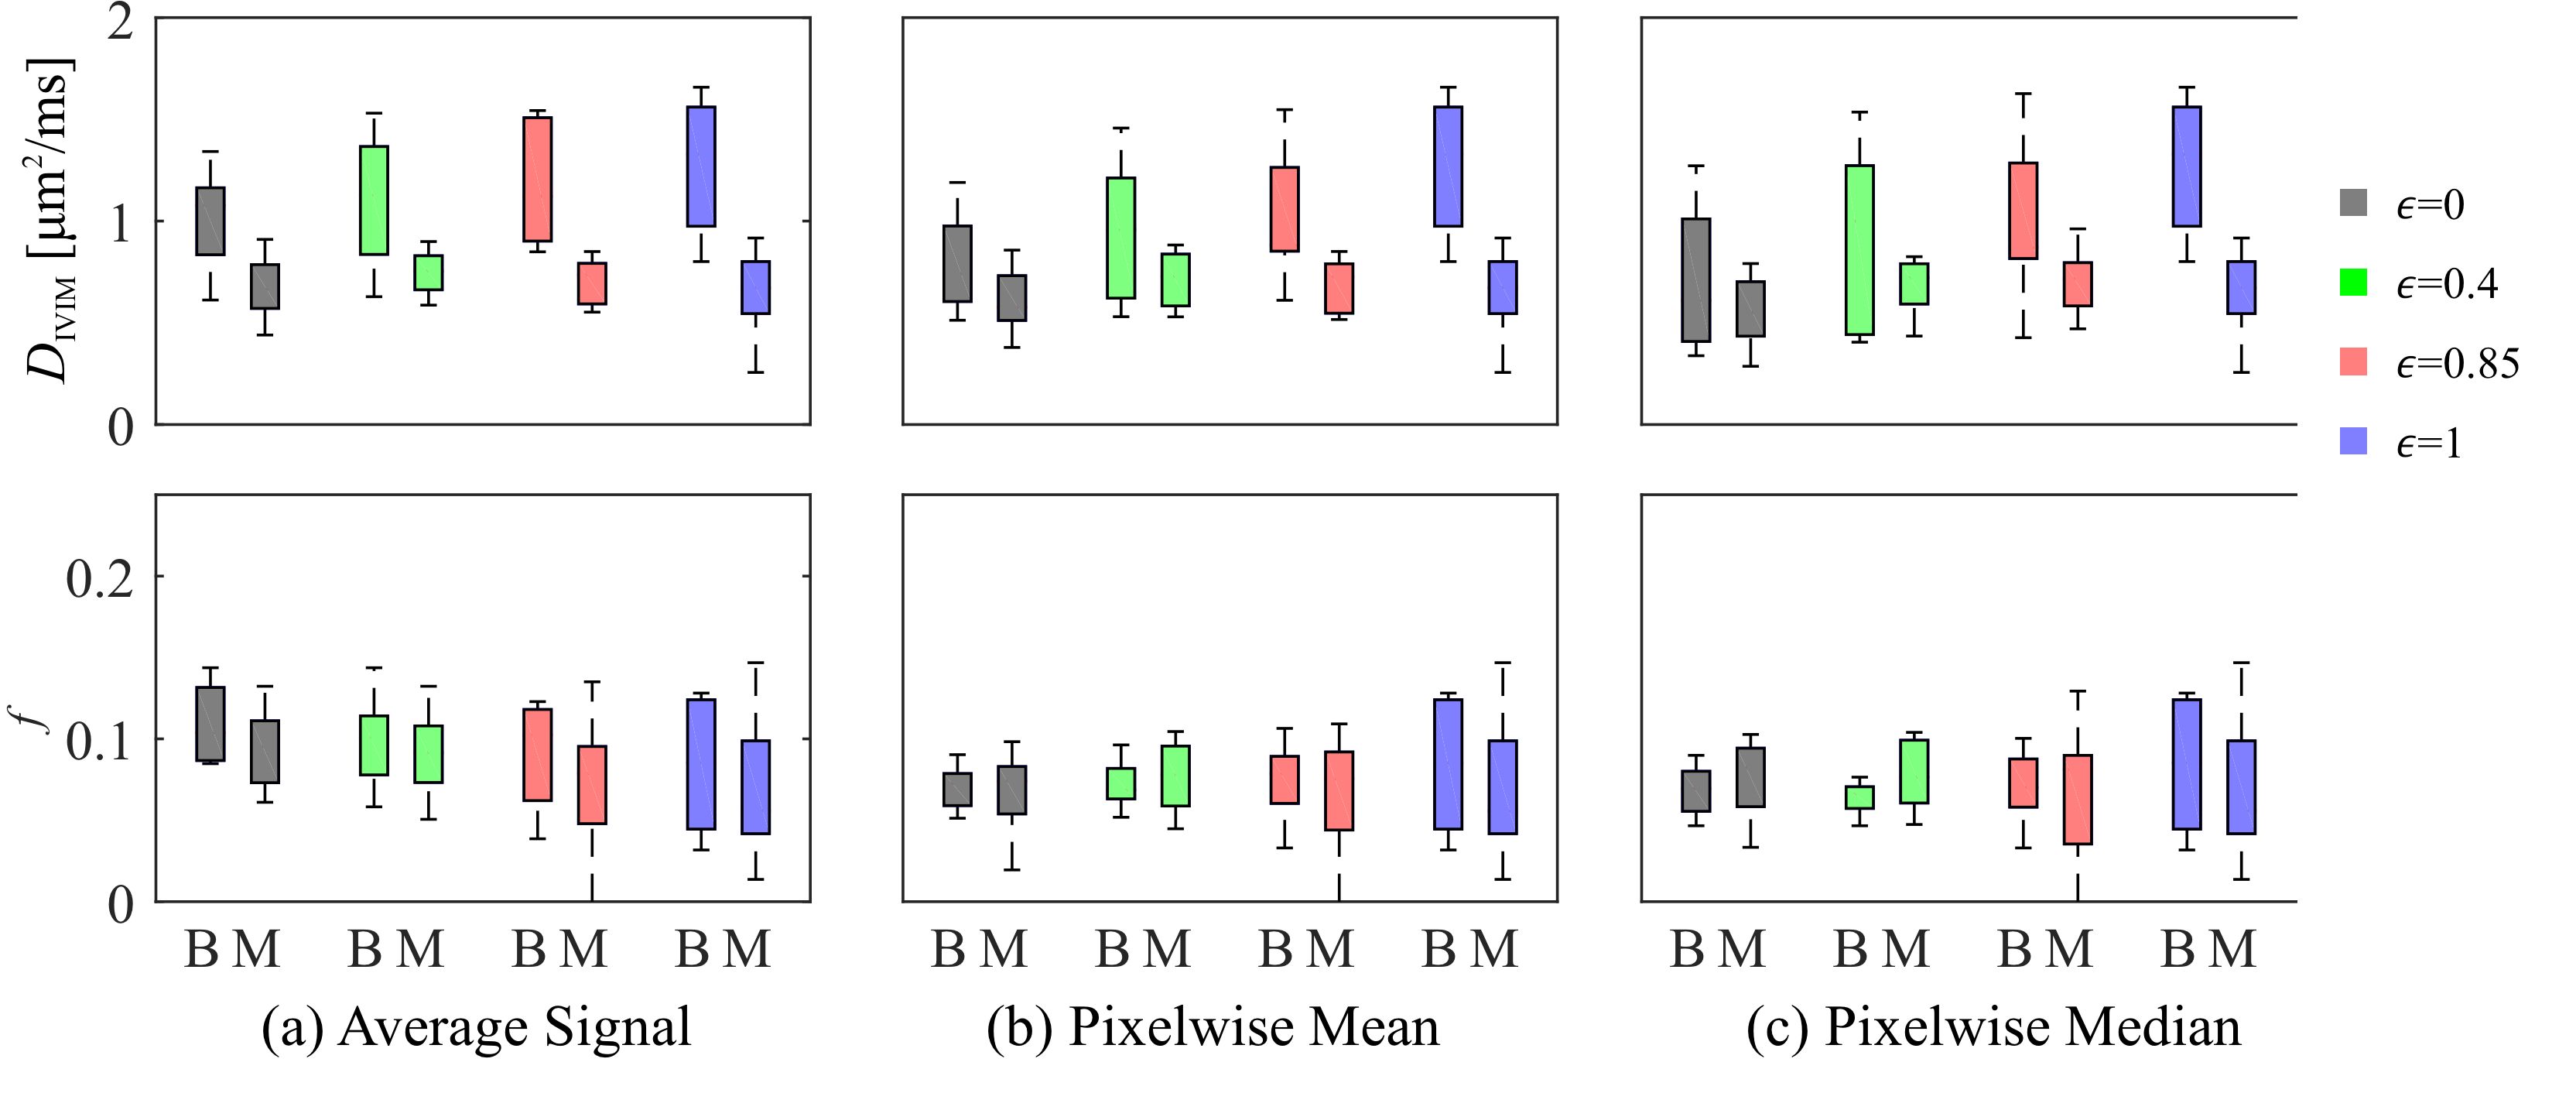
Boxplots of $$$D_{IVIM}$$$ and $$$f$$$ are shown in Figure 4. $$$D_{IVIM}$$$ allows a good quantitative separation for $$$\epsilon\geq 0.85$$$ whereas $$$f$$$ can hardly separate benign and malignant lesions. Moreover, the lesion separation by means of $$$D_{IVIM}$$$ is less dependent on $$$\epsilon$$$ for “Averaged Signal” than voxel-based methods.
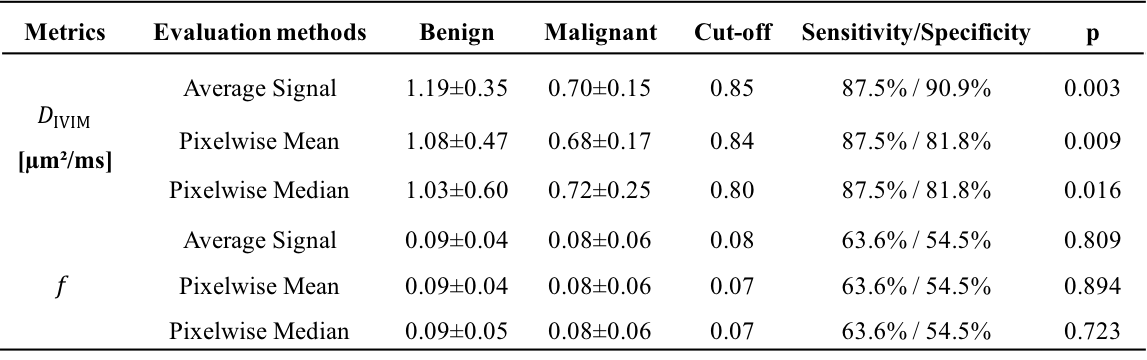
For $$$\epsilon=0.85$$$, Table 1 shows mean quantitative values of the diffusion metrics, sensitivities, specificities, cut-off values, and p-values. In general, three evaluation methods yielded similar mean and cut-off values. Sensitivity and specificity values were higher for $$$D_{IVIM}$$$ and worse for $$$f$$$.
Conclusions
The threshold isocontouring strategy on the selected ROI is a reliable and intuitive approach that can largely reduce the influences from ROI sizes, thus applying it prior to the quantitative evaluation and statistical analysis of DWI data is suggested. The presented results support that the diffusion coefficient is a promising parameter in providing high sensitivity and specificity with a ROI-based evaluation.Acknowledgements
All data acquisition and analysis were completed at the German Cancer Research Centre (DKFZ). We thank Ministry of Business, Innovation and Employment, New Zealand via the grant “New NMR Technologies” and Chinese Academy of Sciences via the Hundred Talents Program Class-A Award and the Dietmar-Hopp-Foundation, the Deutsche Forschungsgemeinschaft (DFG LA 2804/6-1) for their financial support for the collaborative research.References
[1] Giannotti E, Waugh S, Priba L, et al. Assessment and quantification of sources of variability in breast apparent diffusion coefficient (ADC) measurements at diffusion weighted imaging. European Journal of Radiology. 2015;84(9):1729-1736.
[2] Jha AK, Rodríguez JJ, Stephen RM, Stopeck AT. A clustering algorithm for liver lesion segmentation of diffusion-weighted MR images. Image Analysis & Interpretation, 2010; 93-96.
[3] Martel AL, Allder SJ, Delay GS, et al. Measurement of Infarct Volume in Stroke Patients Using Adaptive Segmentation of Diffusion Weighted MR Images. International Conference on Medical Image Computing and Computer-Assisted Intervention, 1999; 22-31.
[4] Bickelhaupt S, Laun FB, Tesdorff J, et al. Fast and Noninvasive Characterization of Suspicious Lesions Detected at Breast Cancer X-Ray Screening: Capability of Diffusion-weighted MR Imaging with MIPs. Radiology. 2016;278(3):689-697.
[5] Zong, F, Bickelhaupt S, Tristan AK, Wolfgang L, Heidi D, Anne S, et al. Threshold isocontouring on high b-value diffusion weighted images in magnetic resonance mammography, Journal of Computer Assisted Tomography, in minor revision.
[6] Bihan DL, Breton E, Lallemand D, et al. MR Imaging of incoherent motion: application to diffusion and perfusion in neurologic disorders. Radiology. 1986;161(2):401-407.
[7] Dogra DP, Majumdar AK, Sural S. Evaluation of segmentation techniques using region area and boundary matching information. Journal of Visual Communication & Image Representation. 2012;23(1):150-160.
Figures