4117
Correction of B0 Inhomogeneities-Induced Artifacts in EPI for Breast ImagingAna Rodríguez-Soto1, Helen Park2, Dominic Holland3, Hauke Bartsch1, Haydee Ojeda-Fournier1, Anders Dale1, and Rebecca Rakow-Penner1
1Radiology, University of California, San Diego, La Jolla, CA, United States, 2School of Medicine, University of California, San Diego, La Jolla, CA, United States, 3Neuroscience, University of California, San Diego, La Jolla, CA, United States
Synopsis
Echo-planar imaging (EPI) is prone to B0 inhomogeneities that arise from susceptiblity effects resulting in spatial distortions more pronounced in the phase-encoded (PE) direction. Reduction and correction of such distortion artifacts are performed in both acquisition and post-processing stages. The present work evaluates the combined effect of a field-of-view (FOV) optimized and constrained undistorted single-shot (FOCUS) EPI and a distortion correction approach to that exploits the symmetry of the artifact on EPI images acquired with opposite PE polarities. After distortion correction good agreement was found between corrected EPI datasets and anatomical images.
Introduction
Breast MRI is widely used to screen for cancers and monitor treatment response.1 Diffusion weighted imaging (DWI), which is typically acquired with echo-planar imaging (EPI), has been recently incorporated to breast MRI protocols to improve the detection of lesions.2 EPI is prone to B0 inhomogeneities that arise from susceptiblity effects due to air-tissue interfaces resulting in spatial and intensity distortions in the phase-encoded (PE) direction.3 In order to reduce the magnitude of these artifacts, a sequence that utilizes a field-of-view (FOV) optimized and constrained undistorted single-shot (FOCUS) EPI was developed. In previous applications FOCUS improved the image quality in spinal cord and prostate DWI applications.4,5 Similarly, the use of reverse polarity gradient (RPG), a retrospective approach to correct B0 inhomogeneities-induced distortions by exploiting the symmetry of the artifact in the forward and reverse PE trajectories improves the localization of prostate cancer.6,7 However, data describing the capacity of these methods to reduce the spatial disagreement between EPI and anatomical data in the breast are lacking. Therefore, the purpose of this work was to test the combined effect of FOCUS acquisition and post-processing in reducing distortion artifacts for breast imaging.Methods
A group of 30 patients underwent breast MRI in a 3T scanner using a breast array. Imaging parameters: T2 fat suppressed FSE— TE/TR=107/4520ms, FA=111°, FOV=340×340mm2, voxel size=0.66×0.66×5mm3; Conventional EPI— TE/TR=82/9000ms, FOV=340×340mm2, voxel size=2.66×2.66×5mm3, PE direction L/R; FOCUS-EPI— TE/TR=82/9000ms, FOV=160×340mm2, voxel size=2.5×2.5×5mm3, PE direction A/P. Both EPI and FOCUS-EPI datasets were acquired in forward and reverse PE polarities and were then used to calculate a deformation map to correct for distortions. The performance of the distortion correction algorithm on both EPI datasets was evaluated by computing the intensity normalized 2D cross-correlation between T2 FSE and corrected EPI images. In addition, the displacement between corrected and uncorrected EPI images and the discrepancy between corrected EPI and anatomical images were reported. Two-tailed paired t-tests were used to evaluate the agreement between FOCUS- and conventional-EPI.Results
A representative case before and after distortion correction is shown in Figure 1. The average and maximum displacements between uncorrected and corrected for both FOCUS- and conventional-EPI datasets were 0.9±0.6 and 5.9±2.1 pixels and 1.4±0.5 and 9.0±1.7 pixels, respectively. These results suggest that the magnitude of the distortion artifact in conventional EPI is ~55% larger than that in FOCUS-EPI of the breast. After distortion correction, good agreement was found between both FOCUS- and conventional-EPI and anatomical images as reflected by the 2D cross-correlation coefficients: 0.90 and 0.96. In addition, T2 FSE images were registered to corrected EPI datasets to estimate the deformation map between the corrected EPI and the anatomical images. These were used to quantify the discrepancy between EPI and anatomical data. The average discrepancies of FOCUS- and conventional-EPI datasets with respect to the anatomical images were 1.0±0.5 and 1.8±1.0 pixels or 2.5±1.3 and 4.5±2.5 mm (p<0.0001).Discussion and Conclusions
As expected, the magnitude of the B0 inhomogeneities-induced artifact was reduced in the FOCUS-EPI images compared to conventional-EPI. Good agreement was found between both corrected EPI datasets and anatomical images. The slightly higher cross-correlations on conventional-EPI is attributed to the reduced signal-to-noise ratio (SNR) of the FOCUS images compared to conventional-EPI. In summary, the work presented here demonstrates that the B0 inhomogeneities-induced distortion correction algorithm performs well based on the 2D cross-correlations values for both EPI methods. However, in both FOCUS- and conventional-EPI a small residual discrepancy w.r.t anatomical images remains; this inconsistency is roughly half when FOCUS-EPI is used. Future work will focus on evaluating the diagnostic capacity of FOCUS- vs conventional-EPI DWI.Acknowledgements
GE HealthcareReferences
[1] Houssami et al. J Clin Oncol 2008;26(19):3248-3258. [2] Joe et al. Radiology 2014;273(2 Suppl):S23-44. [3] Haacke et al. 1999. Wiley. [4] Saritas et al. Magn Reson Imaging 2005;23(1):1-25. [5] Warndahl et al. Magn Reson Imaging 2018;47:67-76. [6] Holland et al. Neuroimage 2010;50(1):175-183. [7] Rakow-Penner et al. Magn Reson Imaging 2015;33(9):1178-1181.Figures
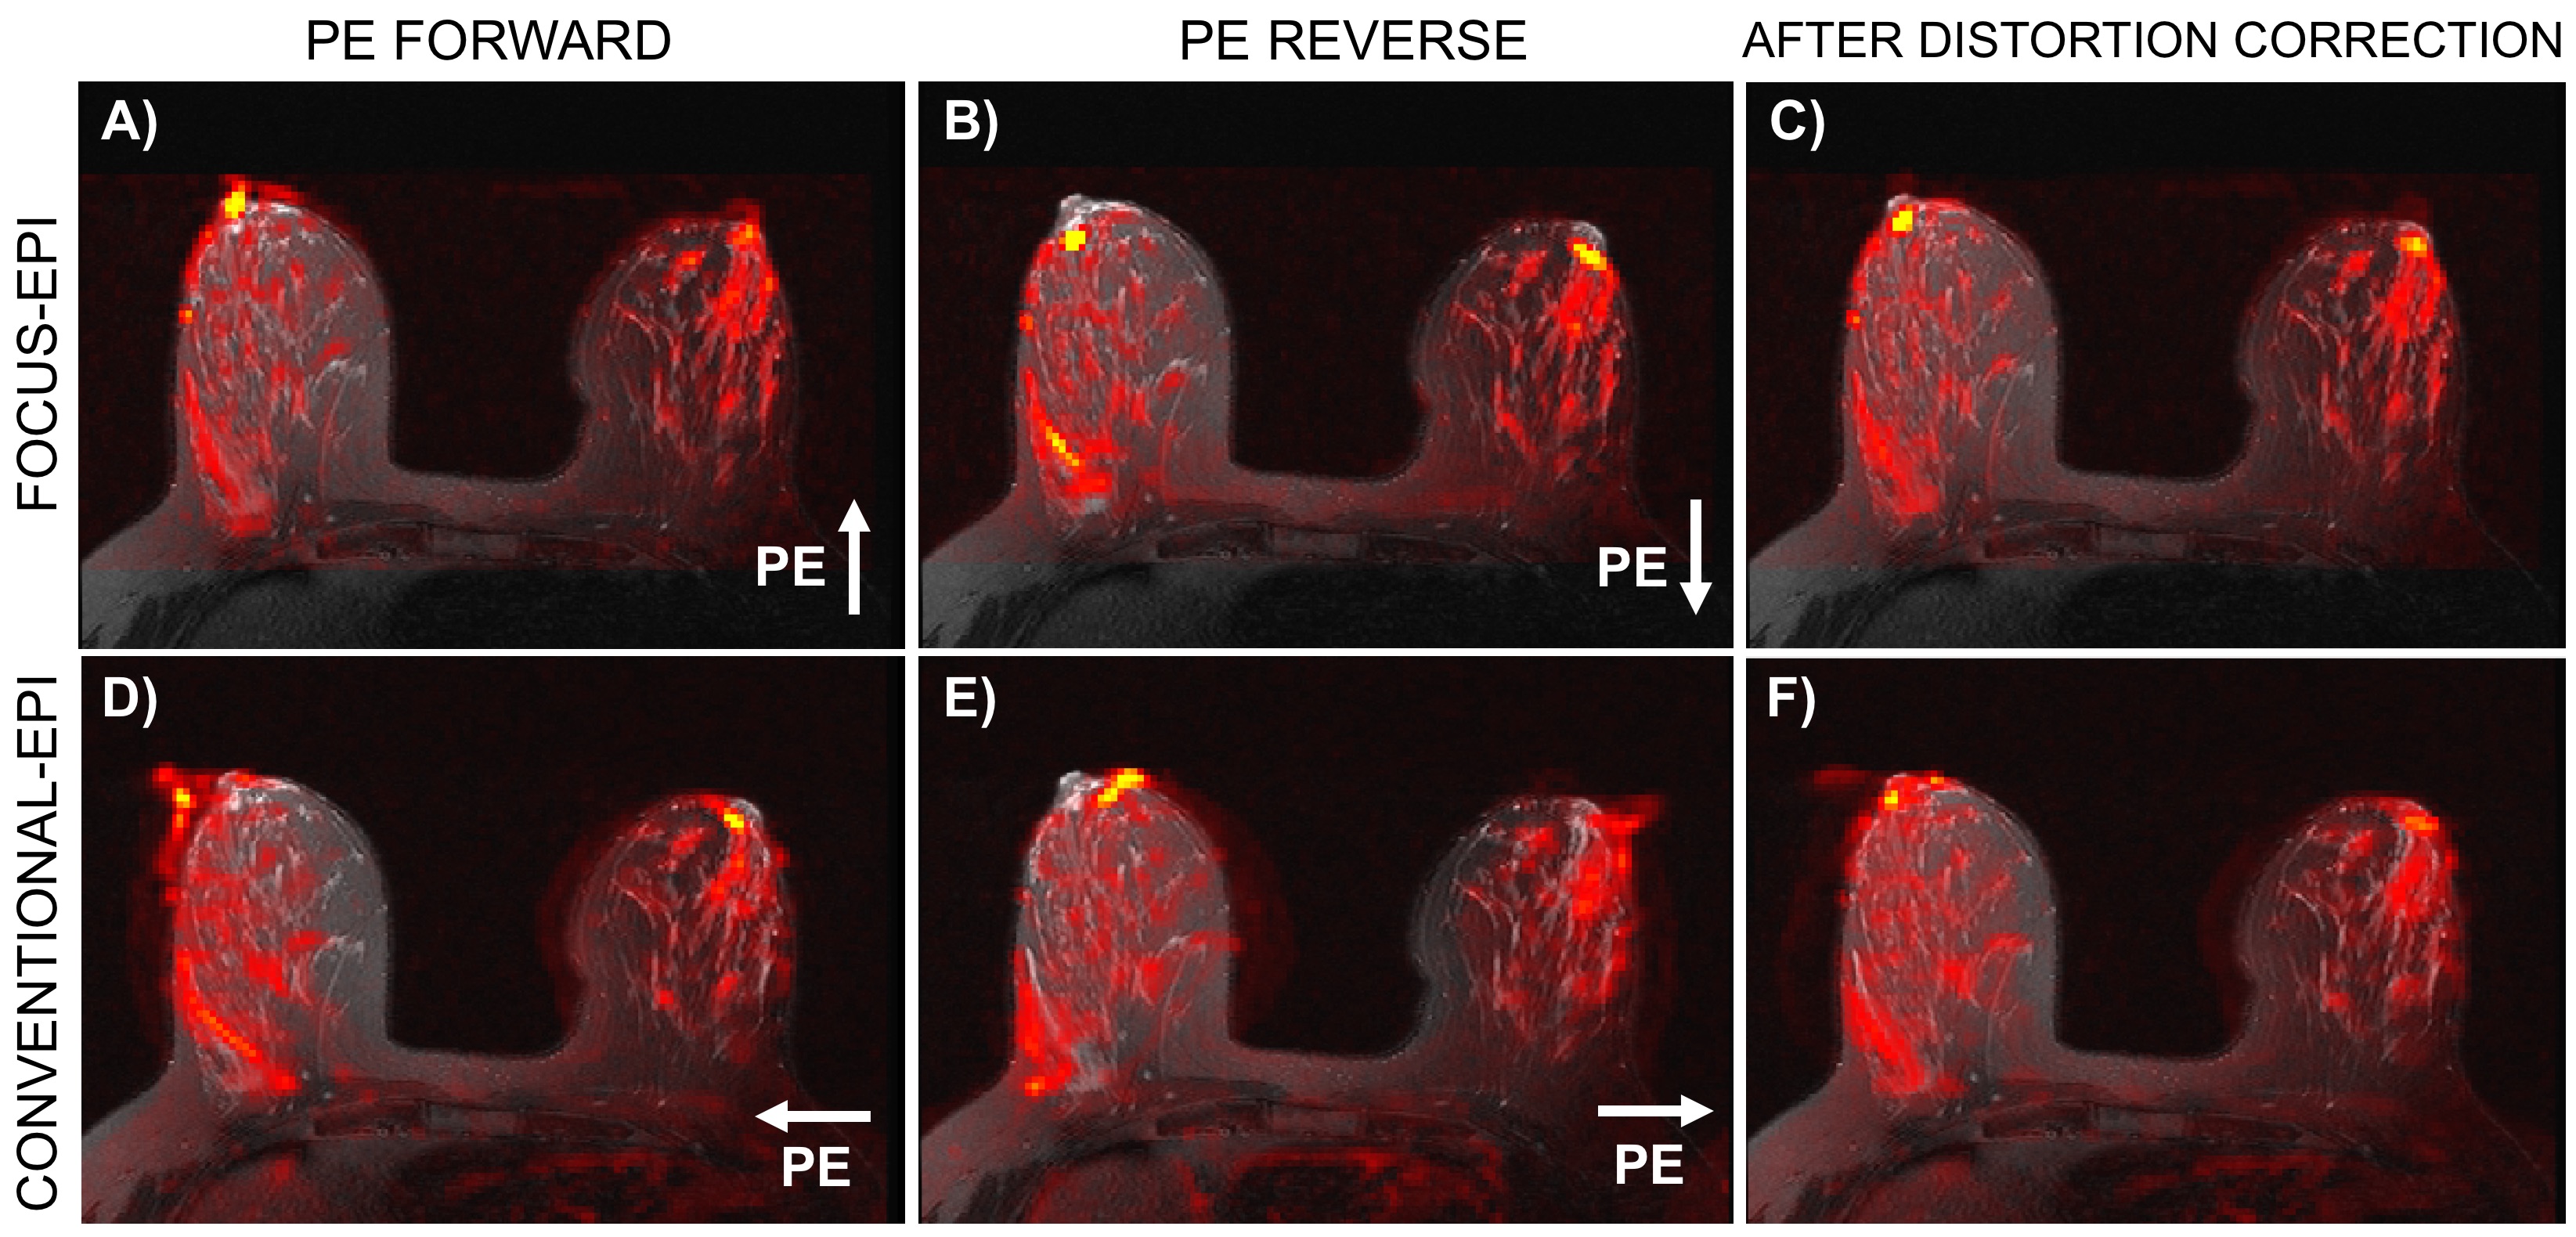
Figure 1. Overlay of FOCUS- and conventional-EPI on T2 FSE images. FOCUS-EPI (top row) and conventional-EPI (bottom row) datasets were acquired in forward (left column) and reverse (center column) phase encoding (PE) polarities. Reverse polarity gradient (RPG) a B0 inhomogeneities-induced distortions correction algorithm that exploits the symmetry of the distortions between forward and reverse PE trajectories was used to calculate a deformation map and correct for B0 inhomogeneities induced distortion (right column).