4115
Radiomic Analysis of Breast Cancer Peritumoral Tissue on Contrast Enhanced MRI Prior to Neoadjuvant Chemotherapy1Radiology, Brigham and Women's Hospital, Boston, MA, United States, 2Geisel School of Medicine at Dartmouth, Hanover, NH, United States, 3Surgical Planning Laboratory, Brigham and Women's Hospital, Boston, MA, United States
Synopsis
This study set out to identify key
Introduction
The purpose of this study was to identify key radiomic features in peritumoral breast tissue associated with a high response to neoadjuvant chemotherapy.Methods
For this retrospective study, we identified 27 biopsy-proven invasive breast cancer cases (BIRADS 6) with dynamic contrast-enhanced MR (DCE-MRI) studies performed prior to receiving neoadjuvant chemotherapy. These pretreatment MR images were segmented using the open-access image-processing software 3D Slicer. For each case, a tumor label map and five distinct masks were created by thresholding subtracted pre and 1st post-contrast images and dilating the tumor label map to voxel-equivalent distances of 2.5mm, 5mm, 10mm, 15mm and 20mm beyond the tumor border. After segmentation, a total of 57 metrics including distribution statistics, shape, morphology and texture were computed from each tumor label map and peritumoral mask using the 3D Slicer HeterogeneityCAD module. To assess response to treatment, cases were separated into 2 response groups using Miller-Payne scores acquired from final surgical pathology reports. Scores of 1-3 were placed into a “low-response” group while scores of 4-5, indicating reduction of tumor cells greater than 90%1, were placed into a “high-response” group. Statistical correlation was performed using univariate Mann-Whitney tests to compare low-response and high-response groups at the tumor and individual peritumoral levels. Metrics of interest were plotted by distance to visualize trends in distribution.Results
Six metrics showed a significant difference between the low-response group and the high-response group at the tumor level, 2.5 mm peritumoral level, and 5mm peritumoral level. These metrics were the following:
- volume
- maximum 3D diameter
- sphericity
- LRE (Long Run Enhancement)
- surface area
- compactness
Among these metrics, Volume and Maximum 3D Diameter achieved a statistically significant difference of P≤0.05 at all three levels. Metrics for Sphericity, Long Run Enhancement (indicative of coarseness) and Compactness 2 achieved a statistically significant difference of P≤0.05 at the tumor level and P≤0.001 at the 2.5mm peritumoral level but failed to achieve a statistically significant difference at the at the 5mm peritumoral level. Lastly, the Surface Area metric achieved significant difference at all three levels with a P≤0.001 at the 2.5mm peritumoral level.
Conclusion
Our study showed that radiomic features of peritumoral breast tissue extracted from DCE-MRI, such as greater sphericity and compactness, and lower surface area, volume, and coarseness are associated with a higher response to neoadjuvant chemotherapies.Acknowledgements
No acknowledgement found.References
1: Ogston KN, Miller ID, Payne S, Hutcheon AW, Sarkar TK, Smith I, Schofield A, Heys SD. A new histological grading system to assess response of breast cancers to primary chemotherapy: prognostic significance and survival. Breast. 2003 Oct;12(5):320-7. PubMed PMID: 14659147.Figures
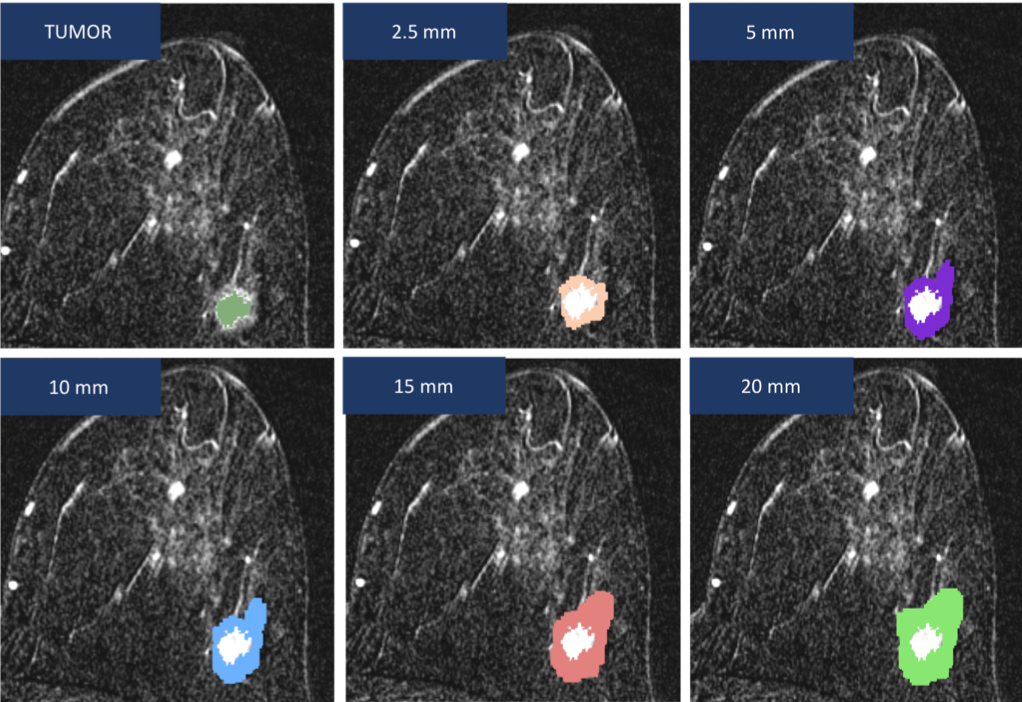
Segmentation -
Example of tumor label map and peritumoral masks at 2.5, 5, 10, 15, and 20mm

Overview of trends -
Box and Whiskers plots of high-response and low-response groups by distance from tumor border for all 6 metrics

Sphericity, compactness, surface area, & LRE -
Box and Whiskers plots comparing high-response and low-response groups for sphericity, compactness, surface area, and LRE at 0, 2.5, and 5mm from tumor border