4113
Determine Breast Density from T1-weighted Images using a 3D Convolutional Neural Network1Biomedical Engineering, Stony Brook University, Stony Brook, NY, United States, 2Psychiatry, Stony Brook Medicine, Stony Brook, NY, United States, 3Radiology, Stony Brook Radiology, Stony Brook, NY, United States
Synopsis
Using MRI-based breast density (BD) measurements, we trained a convolutional neural network to take a T1-weighted MRI and output a BD value. Our CNN yielded a 3.1% error for the entire data set and 4.1% error in the testing set. Having a CNN work on T1-weighted MRI to quantify BD will allow BD to be a part of every practice.
Introduction
Breast cancer is among the most prevalent diseases for women in developed countries and is a public health concern. Previous studies indicate that Breast density (BD) can be used as a biomarker for assessing breast cancer risk1-3. The gold standard to obtain BD is through mammography. Our lab has previously developed an MRI-based BD measurement (MRD)4 based on fat-water decomposition. MRD is comparable to the mammography based BD without patient burden of breast compression and ionizing radiation. Unfortunately, despite its fast acquisition time, MRD relies on multi-echo acquisition that is not pervasively used in the clinic. Therefore, in order to promote clinical availability of BD analysis, we investigated if BD can be extracted from routine clinical T1-weighted MRI through the use of a 3D convolutional neural network (CNN).Methods
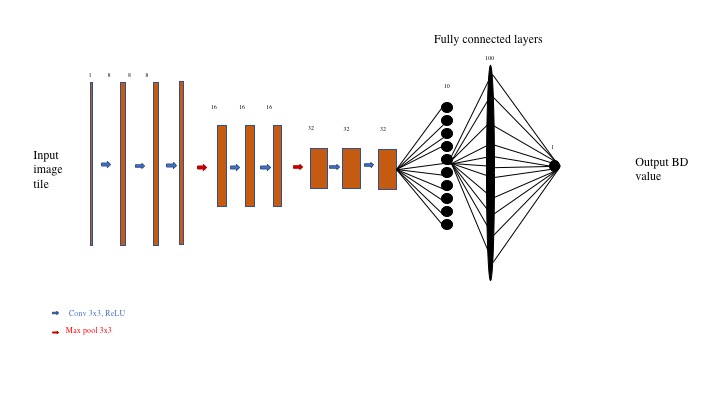
Seventy-six 3-D breast cancer volumes in a prevention trial were identified for this study. Each volume was imaged in a 3T scanner. The fat-water decomposition MRI were performed using a 3D Cartesian 6-echo gradient echo pulse sequence with the following parameters: 64 slices, acquisition matrix 78x192, pixel size=2x2mm2, slice thickness=4mm, flip angle=6⁰, repetition time(TR)=31 ms, and 6 echoes with echo time(TE)=1.37,2.66,4.92,6.15,7.38,8.81ms. T1-weighted images were acquired using T1-weighted FL3D sequence without fat saturation and the following acquisition parameters were used:128 slices, acquisition matrix 512x512, pixel size=0.625x0.625 mm2, slice thickness=1.4 mm, flip angle=20⁰, TR=6.3 ms, and TE=2.37 ms. MRD was calculated using our previous method4. We used a CNN architecture, shown in Figure 1, that includes three blocks with three 3D-convolutions in each followed by a max pooling layer. A fully connected layer then connected to a single unit to output the BD value from the T1-weighted MRI. Our network was trained by the MRD values and sought to minimize the mean squared error between the network output and MRD value. Our subjects were divided into a training and validation set where the training contained 69 volumes and testing set contained 7 volumes.Results
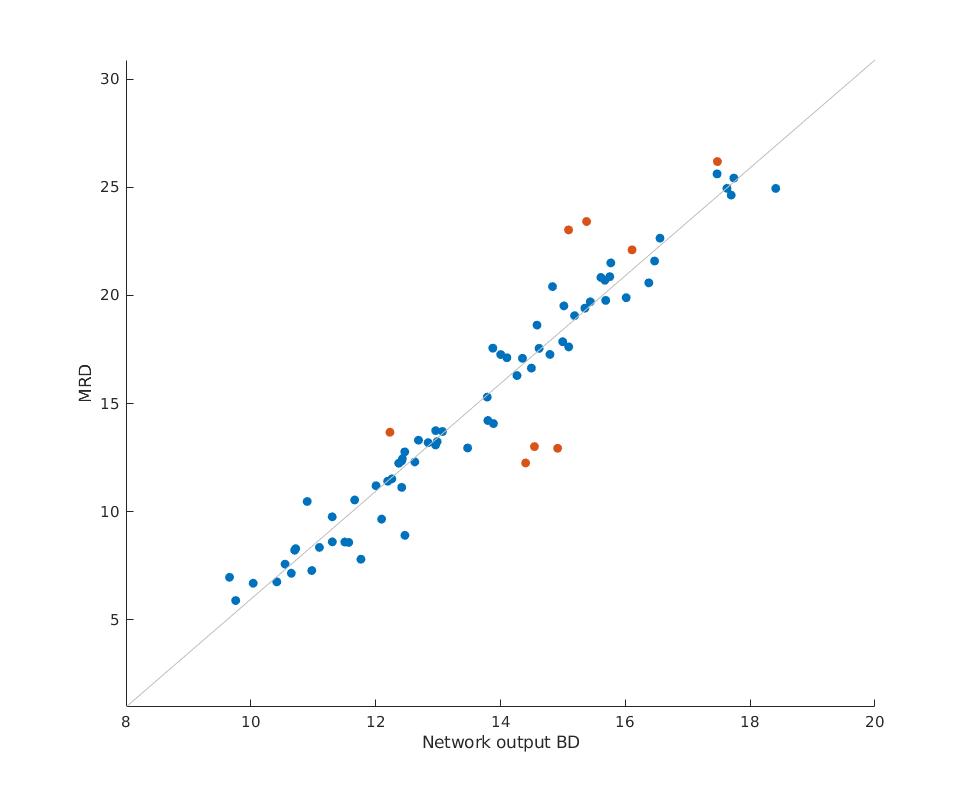
Our CNN yielded a mean absolute error of 3.1% and a root mean squared error of 3.83% for the entire data set, with the testing set having a 4.1% error and 5.6% mean squared error (breast density is represented as a number between 0%~100%). Figure 2 displays training set data in blue and testing set data in orange. The correlation between the CCN output and the MRD values was also shown with r =0.96, and p<<0.0001.Discussion
Previous protocols to measure BD were mammograpy and MRD. Both of these measures, regardless of how accurate and reproducible they determined BD in clinical trials, have certain fallbacks. A certain fallback of mammography-based BD measurement is that it uses ionizing radiation. MRD does not use ionizing radiation, and it measures both water and glandular tissue in the breast and immune from partial volume effect. Yet, the fallback of MRD is that it requires multi-echo fat-water decomposition MR images, which has not been widely adapted into everyday practice. Hence, the notion that BD can be extracted from T1-weighted MRI may be extremely useful. Our study found that our CNN had a mean error of 3.1%, and root mean squared error of 3.83% for the entire data set. This finding can be useful by giving clinicians an accurate quantification of what the patient’s BD, which can help assess the patient’s risk better. This type of assessment will allow clinicians to obtain a quantitative breast density measure from patient’s T1-weighted MRI, which is superior than a simple BIRADS classification. For example, certain studies have concluded that BD can be used for adjuvant therapy treatment response assessment6. Nevertheless, our CNN was limited to 76 breast volumes and could be improved with a larger data set. As one can see, Figure 2 has a bias since the network seems to output larger BD values for lower MRD and lower BD for larger MRD values. The reasoning for this is because the network minimizes the cost function by staying within the MRD range of the dataset. A future approach will take this drawback into consideration.to optimize the network. Different types of CNN architectures can also be explored to potentially improve the results. Its cross-scanner, cross-center reliability also needs to be further validated.Conclusion
We have showed that BD can be estimated through the use of a 3D CNN trained with T1-weighted images and MRD. After training, the network can be used fully automatically without any human interaction. Given that we used an input of a clinically routine T1-weighted MRI, which is used virtually in every breast protocol, it has the potential to be useful in everyday clinical practice for accurate and quantitative breast density measurement.Acknowledgements
No acknowledgement found.References
1. N. F. Boyd, G. S. Dite, J. Stone, A. Gunasekara, D. R. English, M. R. McCredie, G. G. Giles, D. Tritchler, A. Chiarelli and M. J. Yaffe, New England Journal of Medicine 347 (12), 886-894 (2002).
2. N. F. Boyd, L. J. Martin, M. Bronskill, M. J. Yaffe, N. Duric and S. Minkin, Journal of the National Cancer Institute (2010).
3. N. J. Engmann, M. K. Golmakani, D. L. Miglioretti, B. L. Sprague and K. Kerlikowske, JAMA oncology (2017).
4. J. Ding, A. T. Stopeck, Y. Gao, M. T. Marron, B. C. Wertheim, M. I. Altbach, J. P. Galons, D. J. Roe, F. Wang and G. Maskarinec, Journal of Magnetic Resonance Imaging (2018).
5. C. Nioche, F. Orlhac, S. Boughdad, S. Reuze, M. Soussan, C. Robert, C. Barakat and I. Buvat, Journal of Nuclear Medicine 58 (supplement 1), 1316-1316 (2017).6. Ding, J, Stopeck, AT, Gao, Y, Marron, MT, Wertheim, BC, Altbach, MI, Galons, J-P, Roe, DJ, Wang, F, Maskarinec, G, Thomson, CA, Thompson, PA & Huang, C Journal of Magnetic Resonance Imaging no. 4, p. 971 (2018).
Figures