4109
Parenchymal Enhancement in Peritumoral Breast Tissue During DCE-MRI Reflects Response to Neoadjuvant Therapy1The University of Texas at Austin, Austin, TX, United States
Synopsis
DCE-MRI induced enhancement of fibroglandular parenchyma surrounding breast tumors reflects response to neoadjuvant therapy. Longitudinal MRI performed over the course of NAT demonstrates progressive declines in fibroglandular parenchymal enhancement, with more pronounced declines in patients achieving favorable response to therapy. The degree of parenchymal enhancement is affected by patient age and increases with both tumor enhancement and proximity to the tumor.
Introduction
Dynamic contrast-enhanced MRI (DCE-MRI) plays a crucial role in breast cancer detection, as well as monitoring of therapeutic response by assessing the tumor vascular network. The contrast agent not only enhances the tumor tissue, but also normal breast tissue, a phenomena known as background parenchymal enhancement (BPE). The degree of BPE can be variable between different individuals, is influenced by the hormonal milieu, and displays variable anatomical and kinetic patterns.1 Changes in BPE over the course of neoadjuvant therapy (NAT) have been found to correlate with response to therapy in both the ipsilateral2 and contralateral3 breast. The present study assesses spatial and temporal patterns in BPE over the course of NAT to predict eventual response to NAT.Methods
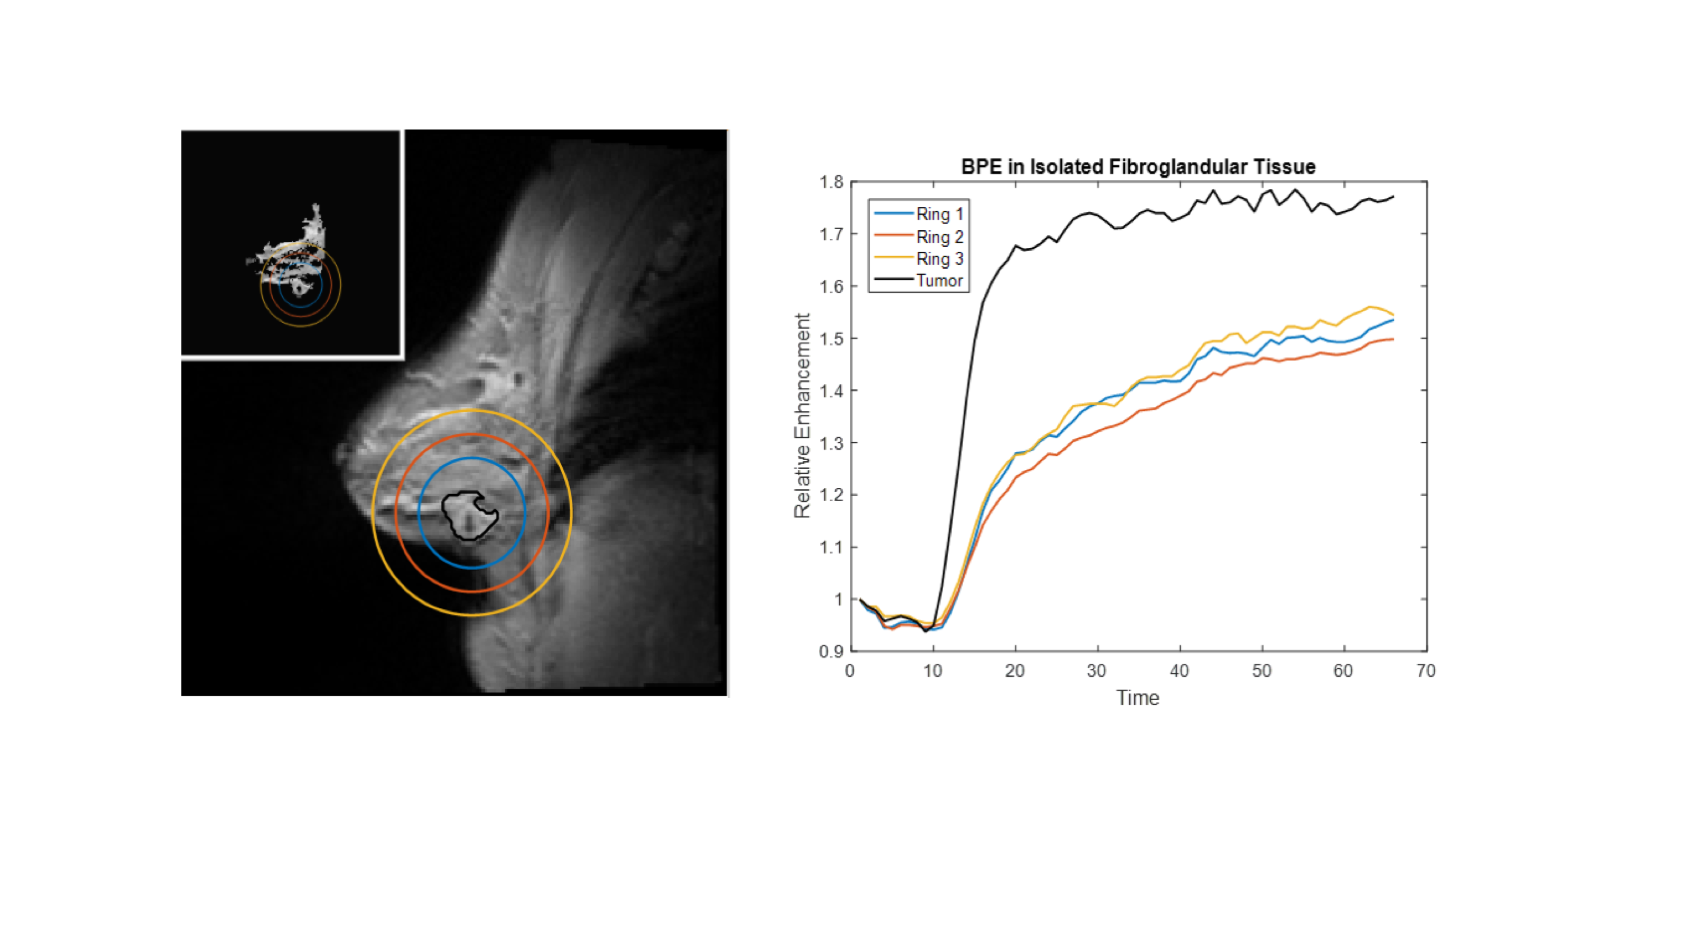
Women with stage II or stage III breast cancer (N = 11) were imaged four times during the course of NAT: 1) prior to the start of NAT, 2) after 1 cycle of NAT, 3) after 2-4 cycles of NAT, and 4) 1 cycle after MRI #3. Imaging data was acquired on a 3T Siemens Skyra scanner (Erlangen, Germany) equipped with an 8- or 16-channel receive double-breast coil (Sentinelle, Invivo). A catheter placed within an antecubital vein delivered gadolinium-based contrast agent (0.1 mmol/kg of Multihance or 10 mL of Gadovist) at 2 mL/sec (followed by a saline flush) via a power injector after the acquisition of the first minute of (baseline) dynamic scans. DCE-MRI data was collected in 10 sagittal slices with a temporal resolution of 7.27 sec for a total acquisition time of eight minutes. Additional scan parameters included a flip angle of 6 degrees, TR/TE = 7.02/4.60 ms, and a GRAPPA acceleration factor of 2. The tumor was semi-automatically segmented using a manually drawn region of interest (ROI) followed by fuzzy c-means clustering of a post-contrast high-resolution anatomical scan. Fibroglandular parenchyma was segmented using fuzzy c-means clustering of a post-contrast high-resolution anatomical image and further segmented into regions at increasing radial distance from the tumor centroid (Figure 1). Tumor and parenchymal enhancement were quantified using a signal enhancement ratio (SER) of the average final minute intensity over the background intensity prior to contrast agent injection; i.e., SER = average signal intensity over final minute of DCE acquisition / average pre-contrast baseline signal intensity.Results
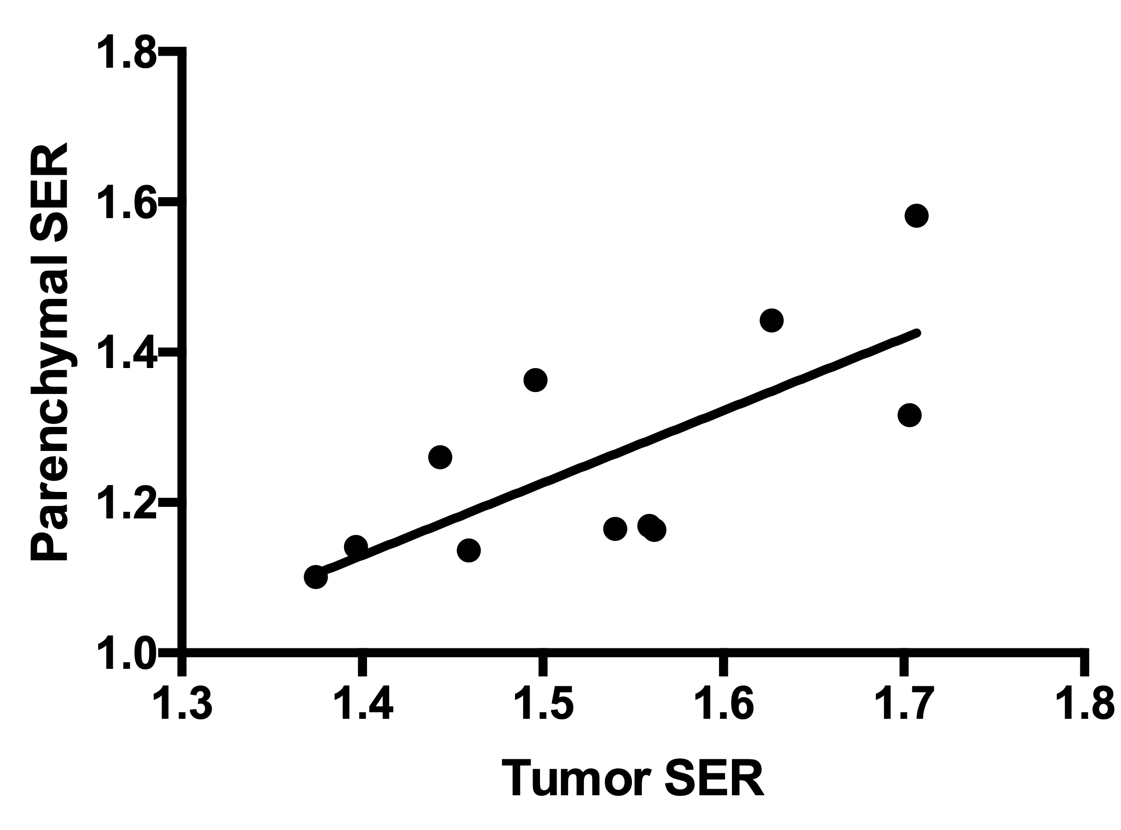
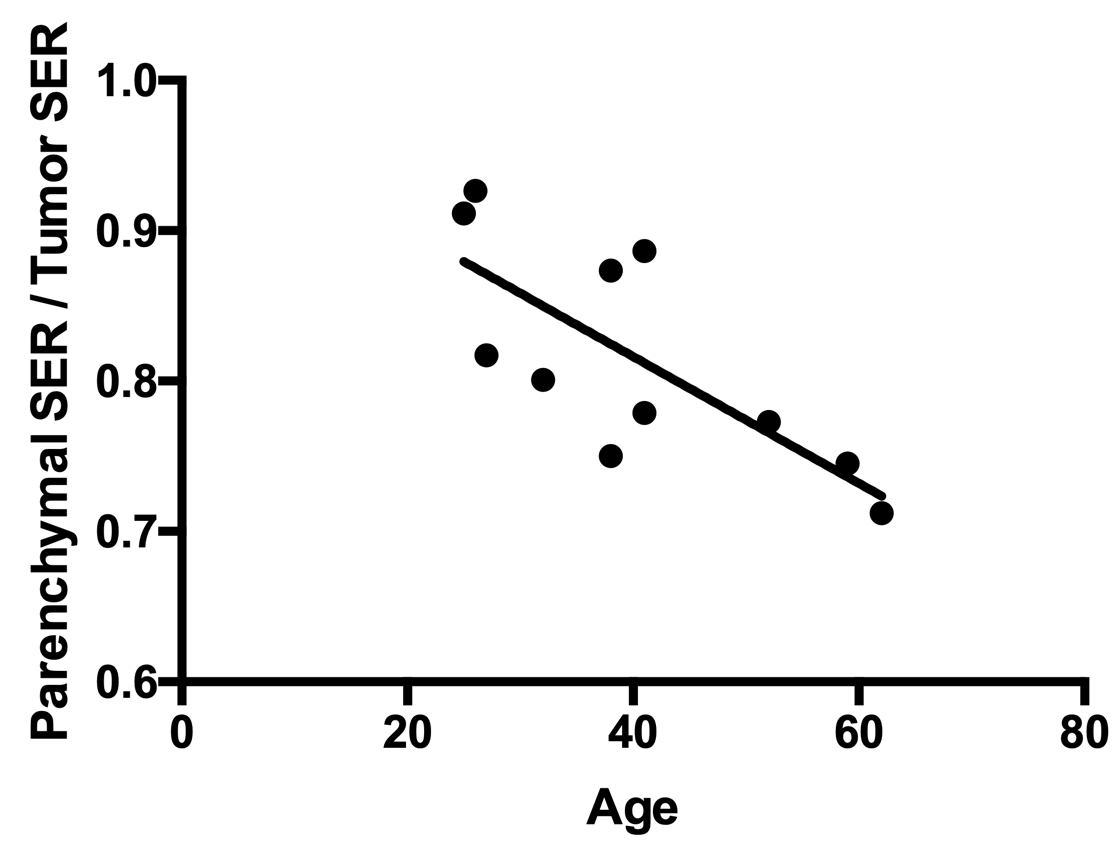
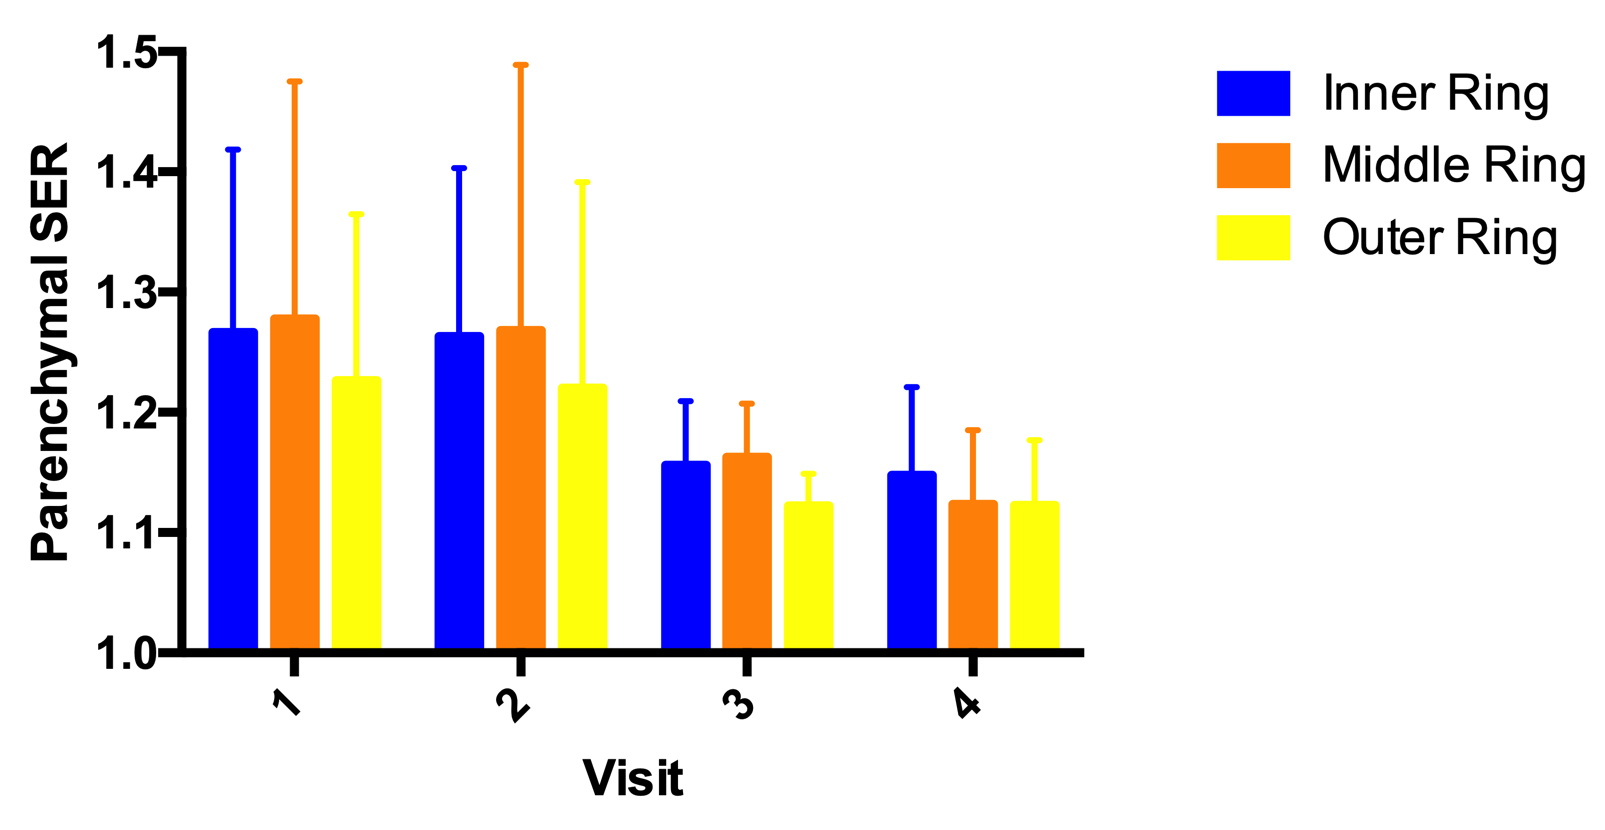
Women with higher SER within the tumor had a higher parenchymal SER (R2 = 0.51; p < 0.05; Figure 2). Prior to the start of NAT, the ratio of parenchymal SER to tumor SER was higher in younger women (R2 = 0.55; p < 0.01; Figure 3). Over the course of NAT, the parenchymal SER decreased on average across all patients; in particular, the SER decreased between the start of NAT and the third MRI which is typically performed at the midpoint of NAT (Figure 4; p < 0.05). Women who ultimately achieved pathological complete response (pCR) or near-pCR (n = 5) had a greater decrease in parenchymal SER between the start of therapy and the third MRI than women who did not achieve pCR or near pCR (n = 5; p < 0.05). Spatially, the regions of fibroglandular parenchyma most proximal to the tumor had higher SER than the most distal region.Discussion and Conclusion
These results demonstrate that decreases in fibroglandular parenchymal enhancement in patients receiving NAT for breast cancer reflect response to therapy. This suggests that tumor stroma may be affected by NAT and that assessment of changes to the stroma may be predictive of ultimate tumor response. Parenchymal enhancement increases with higher tumoral enhancement and proximity to the tumor, suggesting interaction between the tumoral and stromal vasculature. Incorporating quantitative characterization of parenchymal enhancement into treatment response models warrants further investigation.Acknowledgements
We acknowledge financial support for these studies from NCI U01CA142565, U01CA174706, CPRIT RR160005, LIVESTRONG Cancer Institutes Pilot Funding.References
1. Giess CS, Yeh ED, Raza S, Birdwell RL. Background Parenchymal Enhancement at Breast MR Imaging: Normal Patterns, Diagnostic Challenges, and Potential for False-Positive and False-Negative Interpretation. Radiographics. 2014;34(1):234-47.
2. Hattangadi J, Park C, Rembert J, Klifa C, Hwang J, Gibbs J, Hylton N. Breast stromal enhancement on MRI is associated with response to neoadjuvant chemotherapy. AJR Am J Roentgenol. 2008;190(6):1630-6.
3. You C, Peng W, Zhi W, He M3, Liu G, Xie L, Jiang L, Hu X, Shen X, Gu Y. Association Between Background Parenchymal Enhancement and Pathologic Complete Remission Throughout the Neoadjuvant Chemotherapy in Breast Cancer Patients. Transl Oncol. 2017;10(5):786-792.
Figures