4106
Classifying HER-2 expression level in breast cancer with types of MRI time-signal intensity curve1Department of Radiology, Zhengzhou University People’s Hospital & Henan Provincial People’s Hospital, Zhengzhou, China, 2Medical Imaging School, Mudanjiang Medical University, Mudanjiang, China, 3Cooperative Innovation Center of Internet Healthcare & School of Software and Applied Technology, Zhengzhou University, Zhengzhou, China
Synopsis
Breast cancer is one most common cancer in women worldwide. Human epidermal growth factor receptor-2(HER-2)is an important biomarker whose expression status closely relates to the disease outcomes in patients with breast cancer. This study retrospectively explored the difference of MRI time-signal intensity curve types between patients with HER-2 overexpression and patients without HER-2 overexpression. The results indicated the type of washout time-signal intensity curve(TIC) and Non-tumor strengthening is more common in HER-2 amplification or overexpression. The MRI TIC can assess Her-2 status of amplification or overexpression non-invasively before surgery ,and this can help to guide clinician treatment decision and prognosis evaluation.
Background and Purpose
Breast cancer is one of the most frequent cancer worldwide and become more prevalent among female1. Several bio-markers are routinely used to guide its treatment2. Among them, expression status of the human epidermal growth factor receptor-2 (HER-2) plays a crucial role in determining the treatment strategy. The study is to investigate the relationship between MRI time-signal intensity curve type and Her-2 amplification or overexpression in breast cancer.Methods
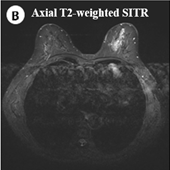
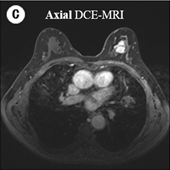
A total of 89 patients with breast cancer confirmed by surgery and pathology in our institution were retrospectively enrolled in this study from January 2016 to June 2018. Imaging data were collected on a 3T MAGNETOM Prisma MR scanner (Siemens, Erlangen, Germany). All patients underwent MRI dynamic contrast enhanced scan before surgery. The detailed parameters are as follows:T1 TR:5.43ms, TE:2.46ms, Slice thickness:1.5mm,FoV read: 340mm;T2 STIR TR:3100ms, TE:69ms, Slice thickness:5mm,FoV read: 320mm; DynaVIEWS spair 1+7 TR:4.56ms, TE:1.74ms, Slice thickness:1.6mm,FoV read: 320mm. According to the status of HER-2 immunohistochemistry and fluorescence in situ hybridization detection Breast cancers in 89 patient were divided into Her-2 non-amplification or overexpressed and HER-2 amplification or overexpressed breast cancer, and the relationship between MRI time-signal intensity curve type and HER-2 amplification or overexpression status was analyzed.Results
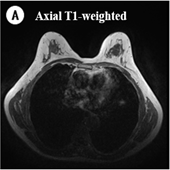
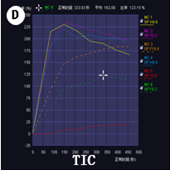
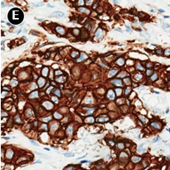
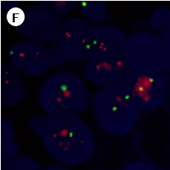
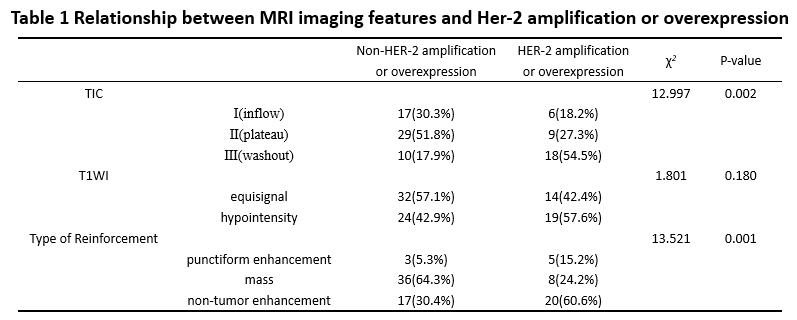
In our study, the breast cancers population in HER-2 amplification or overexpression most commonly presented as TIC washout (54.5%), non-tumor enhancement(60.6%) and T1WI hypointensity (57.6%). We found that The MRI time-signal intensity curve appeared as washout in breast cancer were associated with a higher incidence of HER-2 amplification or overexpression than Non-HER-2 amplification or overexpression (P=0.002) and the HER-2 amplification or overexpression showed a higher incidence of non-tumor enhancement on MRI compared to the Non-HER-2 amplification or overexpression (P=0.001). Of note, Non-HER-2 amplification or overexpression and HER-2 amplification or overexpression did not differ significantly in equisignal group and hypointensity group(P=0.180),and the detailed are listed in Table 1 and Figure A-F.Discussion
In our study, we found the relationship between MRI enhancement and TIC type and Her-2 amplification or overexpression in breast cancer. Breast cancer with Her-2 amplification or overexpression are more likely to have MRI non-tumor-enhanced and washout TIC. It has been reported in the literature that the use of trastuzumab in combination with chemotherapy in early Her-2 positive breast cancer can significantly prolong postoperative disease-free survival (DFS) and overall survival (OS)3. Early acquisition of HER-2 expression status is significant for the treatment and prognosis assessment of patients in breast cancer. Routine detection of Her-2 amplification or overexpression status tissue samples are obtained by needle biopsy for IHC or FISH, but this method is inconclusive because of insufficient tumor specimen collection in a small-needle biopsy. Due to the high resolution of soft tissue, the sensitivity of MR detecting breast disease can reach 95-99%4, 5. Therefore, Using magnetic resonance imaging techniques to noninvasively classify status of HER-2 amplification or overexpression is benefcial for guiding therapeutic strategy.Conclusion
In this study, we demonstrated that the status of Her-2amplification and overexpression can be judged by MRI time-signal intensity curve type and enhancement type, which can provide some help clinicians guide treatment and evaluate prognosis.Acknowledgements
This research was supported by the NNSFC (81720108021, 81772009,81601466,81641168, 31470047), National Key R&D Program of China (YS2017YFGH000397), Scientific and Technological Research Project of Henan Province (182102310162) and the Key Project of Henan Medical Science and Technology Project (201501011),The 2017 graduate student innovation research project of mudanjiang medical university(2017YJSCX-31MY)
References
1. Tumas N., Niclis C., Osella A. et al. [Trends in mortality from breast cancer in Cordoba, Argentina, 1986-2011: some socio-historical interpretations][J]. Rev Panam Salud Publica, 2015, 37(4-5): 330-336.
2.cancer: molecular imaging, systemic biomarkers and the cancer metabolome (Review)[J]. Oncol Rep, 2008, 20(4): 699-703.
3.Cameron D., Piccart-Gebhart M.J., Gelber R.D. et al. 11 years' follow-up of trastuzumab after adjuvant chemotherapy in HER2-positive early breast cancer: final analysis of the HERceptin Adjuvant (HERA) trial[J]. Lancet, 2017, 389(10075): 1195-1205.
4.Huang J., Yu J., Peng Y. Association between dynamic contrast enhanced MRI imaging features and WHO histopathological grade in patients with invasive ductal breast cancer[J]. Oncol Lett, 2016, 11(5): 3522-3526. [5] Telegrafo M., Rella L., Stabile Ianora A.A. et al. Breast MRI background parenchymal enhancement (BPE) correlates with the risk of breast cancer[J]. Magn Reson Imaging, 2016, 34(2): 173-176.
Figures