4103
Investigating the feasibility of performing quantitative DCE-MRI in an abbreviated breast examination1Physics, University of Texas at Austin, Austin, TX, United States, 2Institute for Computational Engineering and Sciences, University of Texas at Austin, Austin, TX, United States, 3Biomedical Engineering, University of Texas at Austin, Austin, TX, United States, 4Diagnostic Medicine, University of Texas at Austin, Austin, TX, United States
Synopsis
MRI is the most sensitive imaging modality for detecting breast cancer, but its use as a screening tool is limited. There has been recent interest in developing an “abbreviated” breast MRI protocol as a screening protocol, which involves a significantly shorter breast MRI exam that does not compromise diagnostic accuracy. In this work, we evaluate the accuracy of estimating perfusion parameters from dynamic contrast-enhanced MRI data by truncating the data into a series of abbreviated-time courses and comparing the corresponding parameter estimates to the original, full-time course parameter estimates.
Introduction
Dynamic contrast-enhanced (DCE) MRI has been shown to improve the specificity in the diagnosis of breast cancer by providing quantitative information on tissue properties related to the volume transfer constant (Ktrans) and extravascular/extracellular volume fraction (ve) 1. It has been shown that these two parameters derived from DCE-MRI differ significantly between malignant and benign tissues2. Importantly, the ability to accurately and precisely determine the common DCE-MRI parameters is fundamentally limited by the specifics of the temporal sampling protocol3. In particular, the effects on parameter estimation arising from the limited time course afforded by an abbreviated breast MRI exam in the clinical setting have not yet been determined. Here we analyze the dependence of parameter estimates on the length of the DCE-MRI study to assess the feasibility of performing quantitative DCE-MRI in an abbreviated breast examination.Methods
DCE-MRI simulation: Simulated data was produced using a MATLAB (Mathworks, Natick, MA) implementation of the standard Kety-Tofts model4. We simulated signal intensity curves (N=729) using combinations of Ktrans and ve , generated by choosing 27 linearly-spaced values for Ktrans within the range [0.005 min-1, 2.0 min-1], and 27 linearly-spaced values for ve within the range [0.01, 0.5]. These ranges were chosen based on values observed in clinical data. Lastly, 10% noise from a uniform distribution was added to each simulated data point. Imaging parameters and the arterial input function were set identical to those employed in the clinical acquisition with a pre-contrast T1 value for tumor fixed at 1.5 s.
DCE-MRI data acquisition: Patients (N=22) with locally advanced breast cancer were scanned using a 3T Skyra (Siemens, Tarrytown, NY) equipped with a 16-channel receive double-breast coil (Invivo, Gainsville, FL). DCE-MRI data was collected with TR/TE/a = 7.02 ms/4.60 ms/6o and a GRAPPA acceleration factor of 2 so that each 10-slice set was collected in 7.27 s for eight total minutes of scanning, yielding 66 total time points. After collecting one minute of dynamic scans (first 8 time points), 10 mL of Gadavist (Bayer, Whippany, NJ) was delivered at 2 mL/sec (followed by a saline fush) through a catheter placed within an antecubital vein. One representative patient dataset was used for the preliminary analysis presented in this work.
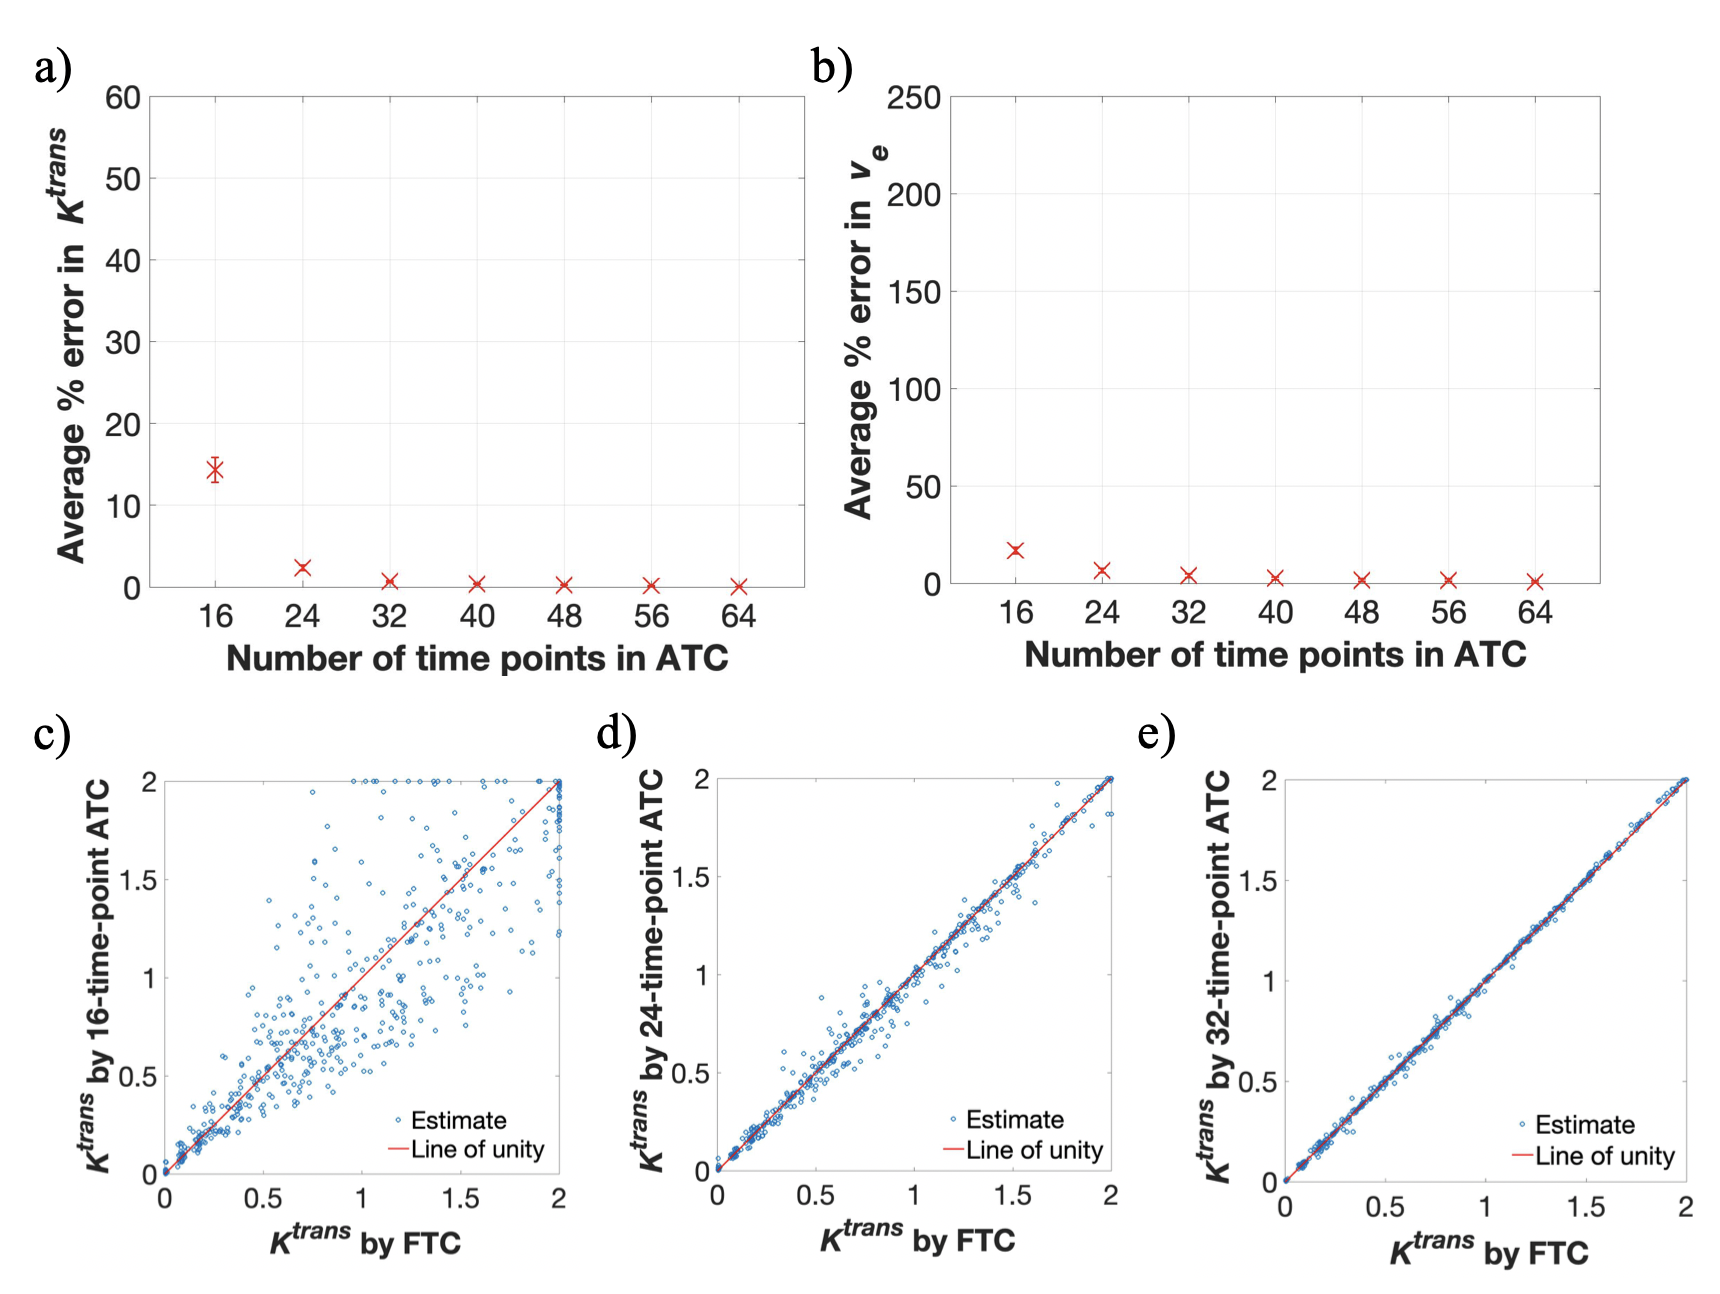
DCE-MRI analysis: Two sets of seven abbreviated-time courses (ATCs) of the same temporal resolution with respective lengths of 16 (1.94 min), 24 (2.91 min), 32 (3.88 min), 40 (4.85 min), 48 (5.82 min), 56 (6.79 min), and 64 (7.75 min) time points were generated by truncating the full-time course (FTC; 66 time points, 8 min length) from the patient and the simulated data. The FTCs for both the patient and simulated data were fit to the standard Kety-Tofts model to estimate Ktrans and ve for each voxel; the results of these fits provided the “gold-standard” to which the fits to the standard Kety-Tofts model using ATCs were compared.
Statistical analysis: We calculated the average percent error between the FTC and ATC estimates of Ktrans and ve for both the simulated and patient data, yielding seven data points for each analysis. 95% confidence intervals were computed for the N = 1750 voxels within the patient’s tumor and the N = 729 simulated time courses.
Results
Results from simulated data are contained in Figure 1, which summarizes the average percent error in Ktrans and ve estimates from the seven ATCs. The reported error (in order from shortest to longest ATC) is as follows: Ktrans error = [14.33%, 2.35%, 0.69%, 0.39%, 0.24%,0.14%, 0.04%] and ve error = [16.88%, 6.47%, 3.93%, 2.54%, 1.66%, 1.65%, 0.69%].
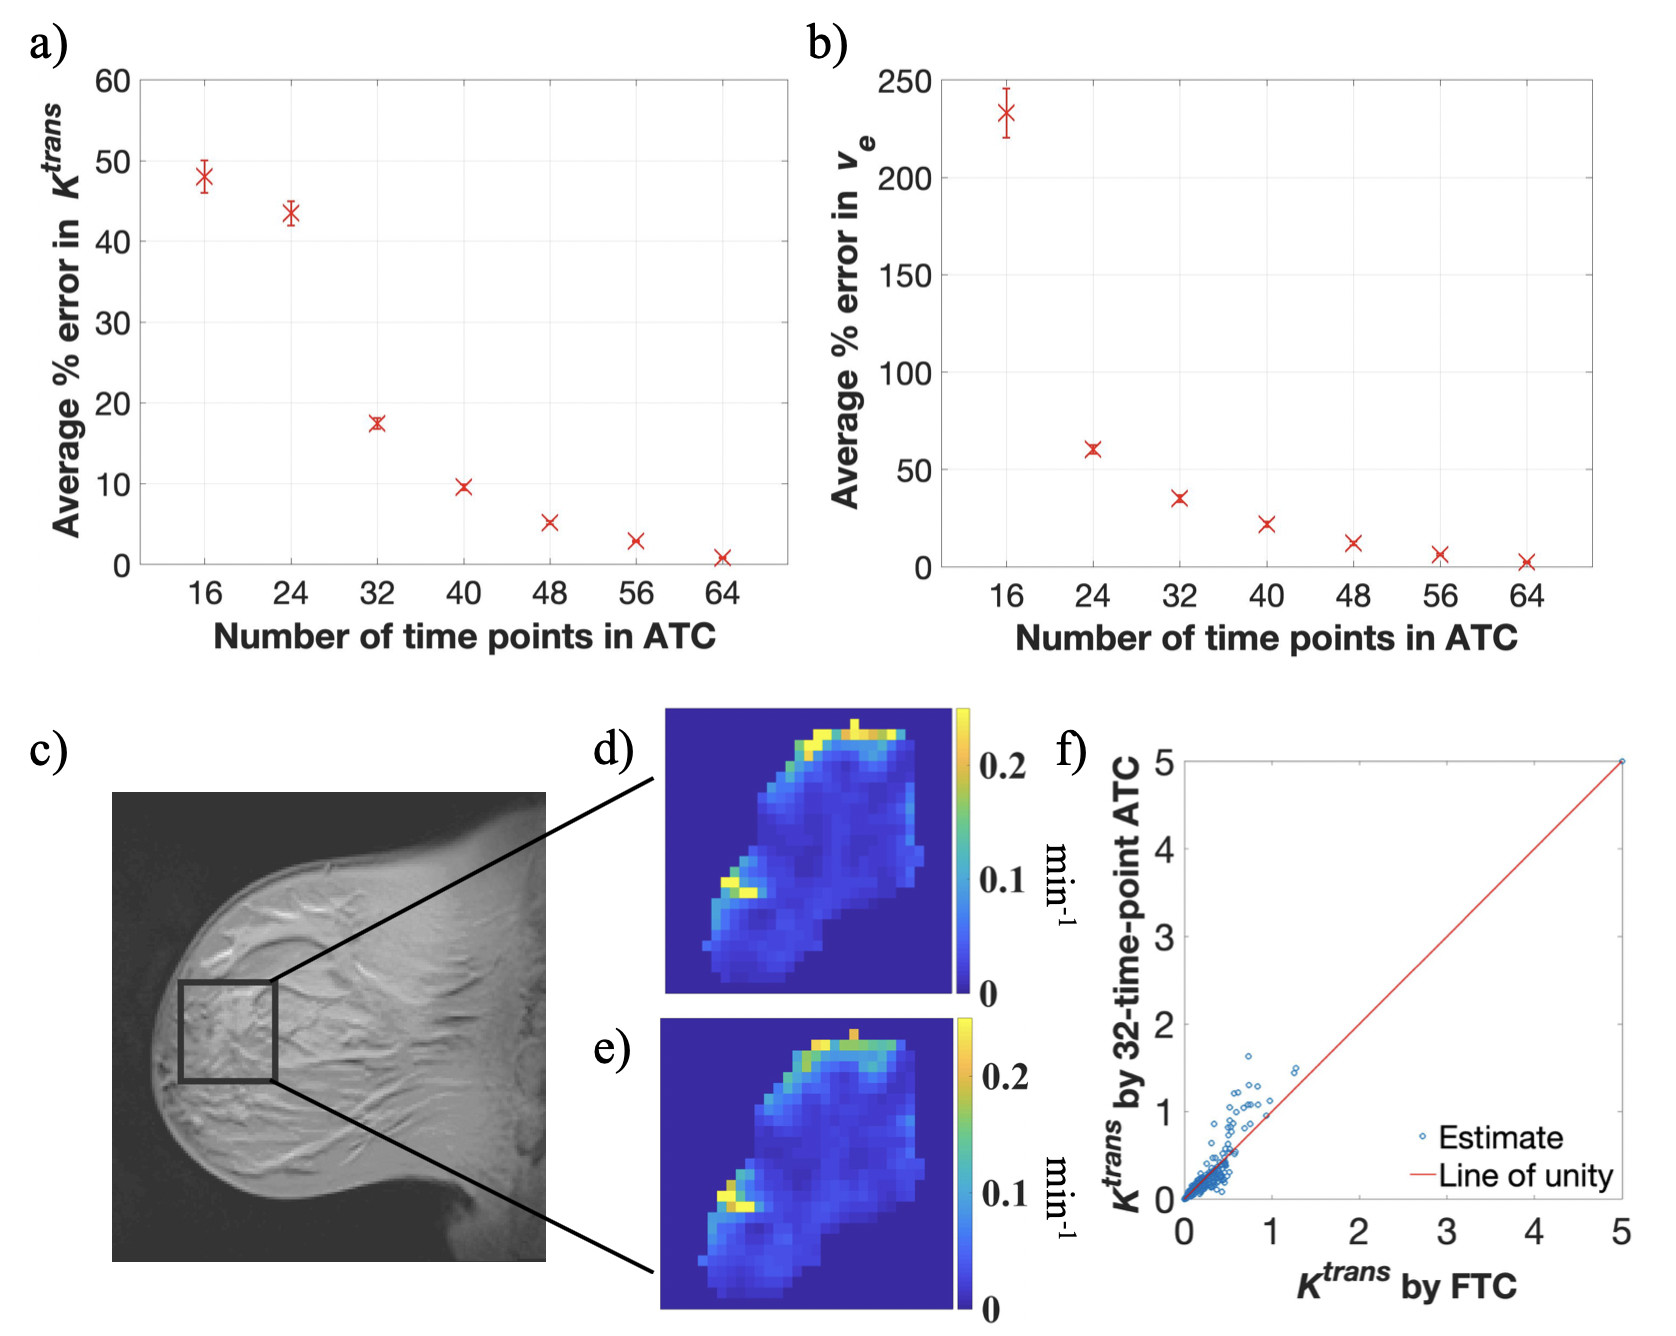
Results from patient data are contained in Figure 2, which summarizes the average percent error in Ktrans and ve estimates from the seven ATCs. The reported error is as follows: Ktrans error = [48.05%, 43.47%, 17.48%, 9.54%, 5.16%, 2.86%, 0.81%] and ve error = [233.00%, 60.28%, 35.03%, 21.76%, 12.04, 6.39%, 2.34%].
Discussion and Conclusion
The average percent error in Ktrans estimates from patient data is below 18% for ATCs at least 3.9 minutes (32 time points ) long, compared to below 2% error from simulated data. The proposed analysis provides one measure for the performance and feasibility of abbreviated breast MRI protocols for high-risk patients, and preliminary results indicate that it may be possible to characterize Ktrans with acceptable error in an abbreviated breast MRI exam. To more completely characterize this error, we are currently expanding the above analyses to more patient data (N=22), other perfusion models (e.g., extended Kety-Tofts and Patlak analysis), and simulations with a more rigorous noise model.Acknowledgements
This work is supported by NCI U01CA142565, U01CA174706, CPRIT RR16000, and ACS-RSG-18-006-01-CCE.References
- Leithner D, Moy L, et al. Abbreviated MRI of the Breast: Does It Provide Value? J. Magn. Reson. Imaging. 2018
- Amarnath J, Sangeeta T, Mehta SB. Role of quantitative pharmacokinetic parameter (transfer constant: K(trans)) in the characterization of breast lesions on MRI. Indian J Radiol Imaging. 2013;23(1):19-25.
- Levine E, Daniel B, et al. 3D Cartesian MRI with Compressed Sensing and Variable View Sharing Using Complementary Poisson-disc Sampling. Magn Reson Med. 2017;77(5):1774-1785.
- Tofts P, Kermode A. Measurement of the Blood-Brain Barrier Permeability and Leakage Space Using Dynamic MR Imaging. 1. Fundamental Concepts. Magn. Reson. in Med. 1991;17:357-367.
Figures