4099
Free-Breathing Magnetic Resonance Elastography of the Lung: A Repeatability and Reproducibility Study.1Department of Biomedical Engineering, The Ohio State University, Columbus, OH, United States, 2Department of Radiology, The Ohio State University, Wexner Medical Center, Columbus, OH, United States, 3MR Application Development, Siemens Healthcare GmbH, Erlangen, Germany
Synopsis
Lung stiffness is altered in many diseases making it an important biomarker of understanding lung mechanics. Many patients struggle to hold their breath during scanning due to shortness of breath. We have developed a free-breathing spin-echo-spiral magnetic resonance elastography (MRE) sequence, and a feasibility study was performed on 5 healthy volunteers. It was found that the shear stiffness of the lung during normal breathing was 1.9±0.51kPa and 8.87±1.44kPa with and without considering lung density correction, respectively. Also the measurements were repeatable and reproducible.
Introduction
Lung diseases alter mechanical properties of the lung parenchyma making it an important parameter to understand1. The changes in mechanical properties such as stiffness of the lungs play an important role in patients’ ability to breathe properly. Due to the altered functionality of the diseased lung, patients often have limitations in holding their breath. Several studies have shown the feasibility of magnetic resonance elastography (MRE) to quantify the shear stiffness of the lungs during breathhold at residual volume (RV) and total lung capacity (TLC)1–3. However, a breathhold might be very challenging for lung disease patients. The aim of this study was to investigate the feasibility of quantifying lung’s shear stiffness by using MRE under free breathing and demonstrate the repeatability and reproducibility of the measurements.Methods
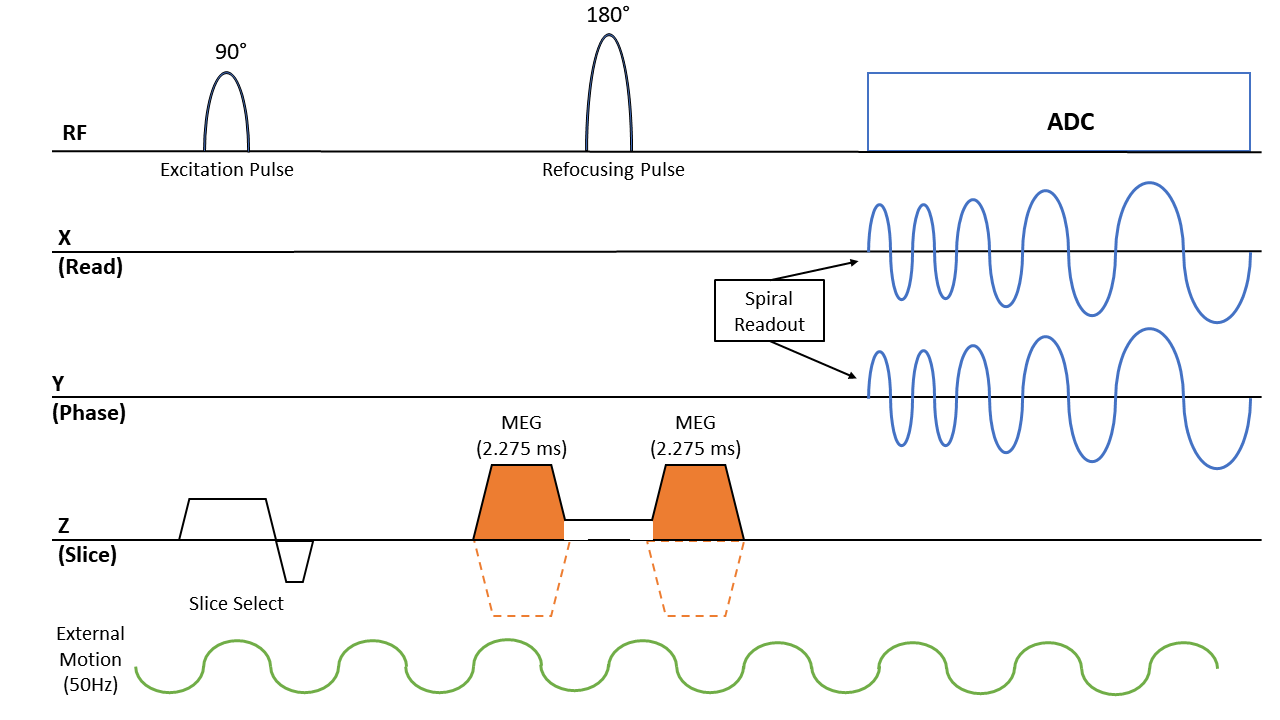
Five healthy volunteers (4 males and 1 female, 26.6±3.3 years old) were scanned using an approved IRB. Lung MRE scans covering the entire right lung were performed using a Spin-Echo Dual-Density Spiral (SE-DDS) sequence (Figure 1) in a 1.5T MR scanner (MAGNETOM Aera, Siemens Healthcare, Erlangen, Germany). Mechanical vibrations (Resoundant Inc, Rochester, MN, USA) of 50Hz were introduced into the lung. The SE-DDS sequence was used due to its robustness to motion and short TE. With a TR of 1020ms and 10 spiral interleaves, the scan time was 1:30 minute for each motion-encoding direction (i.e. X, Y, Z). Depending on the size of the lung, 10 to 16 transverse slices were acquired with a thickness of 10mm. All scans were acquired during free breathing without the use of respiratory navigators and without the need of noble gas. The scan parameters included FOV of 45x45cm2, acquisition matrix of 128x128, and TE of 6.8ms. As shown in figure 1, two unipolar MEGs were placed around the 180° refocusing pulse with a period of 2.275ms (i.e. fractional encoding with a frequency of 220Hz combined) to achieve minimum possible TE. In addition, the MEGs were used as crushers for the 180° refocusing pulse to further reduce the TE and avoid stimulated echoes. Scans were repeated with inverted MEG polarity for phase-difference calculations. To avoid motion/swirling artifacts that appear in spiral acquisition, a dual-density spiral was used in which the center of k-space was fully sampled, and the edges were under-sampled by a factor of four4. Additionally, non-Cartesian SPIRiT image reconstruction was used instead of non-uniform Fourier transform to further reduce spiral motion/swirling artifacts5. 4 out of 5 volunteers went through a repeatability study and 3 out of 5 went through a reproducibility study. For the repeatability study, MRE scans were performed back to back without moving the subject. And for the reproducibility study, the subjects were asked to step out of the scanner room and were repositioned for a second scan. Lung density (LD) estimation scans were performed by using a GRE sequence to estimate the lung’s stiffness3,6,7. LD scans involved four acquisitions with different TEs of 0.98, 1.28, 1.58, and 1.88ms to calculate T2* decay from which LD was estimated as described elsewhere3,6,7. Since LD changes during the respiratory cycle, and to match the free-breathing MRE measurements, which is an average signal across the respiratory cycle, LD scans were performed at the mid-point of the respiratory cycle under a 16-seconds breathhold. Lung shear stiffness was calculated by using the 2D direct inversion algorithm (MRElab software, Mayo Clinic, Rochester, Minnesota, USA)8.Results
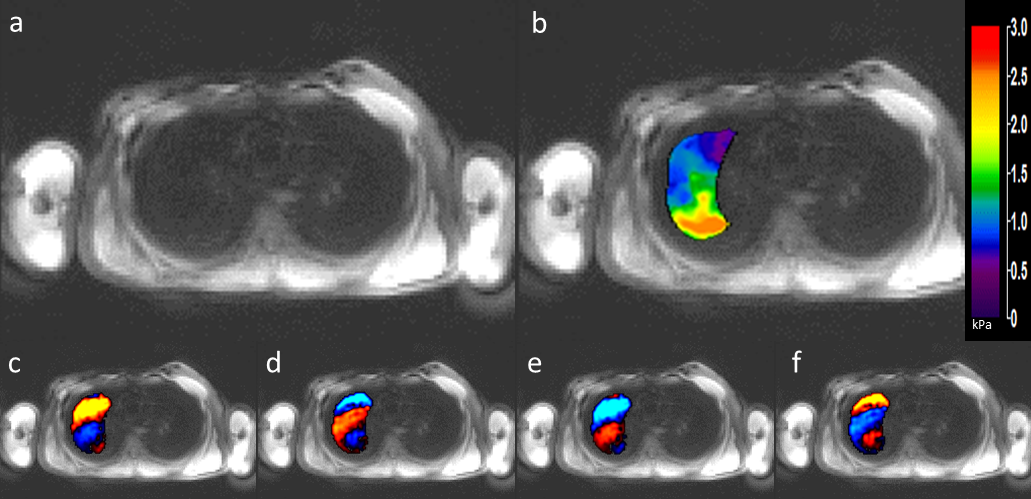
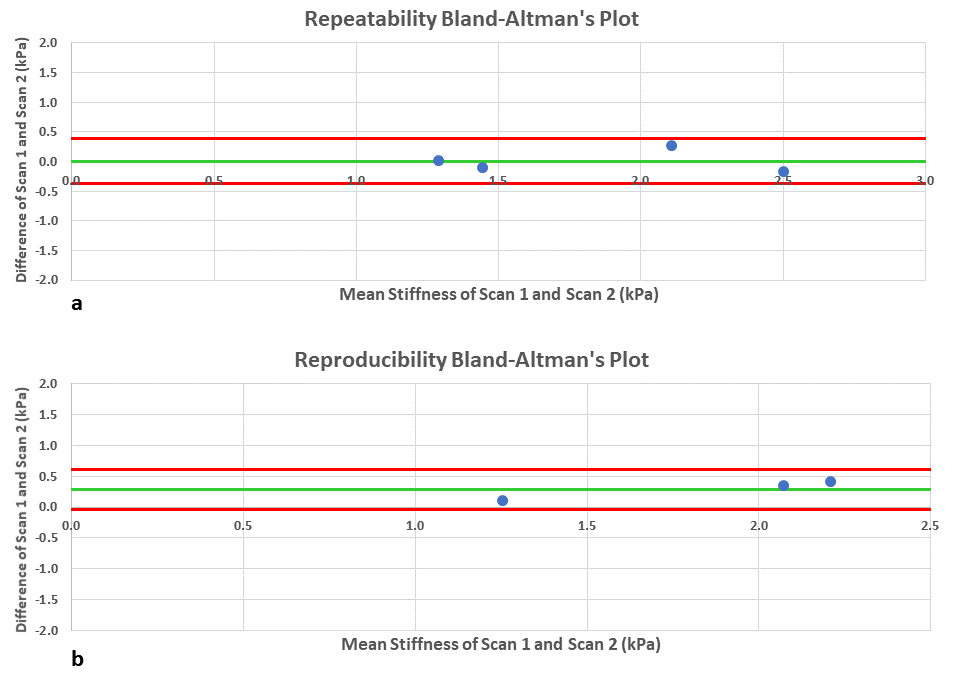
Figure 2 shows example magnitude images, 4 snapshots of wave images, and a stiffness map of the right lung. The wave images demonstrate excellent wave propagation during free breathing without any artifacts in the lungs. The stiffness map shows a mean shear stiffness of 1.21±0.48kPa for the whole lung after considering LD in this particular volunteer. The mean shear stiffness value for the whole right lung for all of the 5 volunteers was 1.9±0.51kPa and 8.87±1.44kPa with and without considering LD correction, respectively. Figure 3 shows Bland-Altman analysis demonstrating the repeatability and reproducibility of measurements obtained using the SS-DDS MRE sequence with low mean bias and a narrow confidence interval (repeatability: Bias = 0.01kPa; 95% CI from -0.39kPa to 0.40kPa; reproducibility: Bias = 0.29kPa; 95% CI from -0.05kPa to 0.62kPa).Discussion and Conclusion
This study demonstrated the feasibility of free-breathing MRE of the lungs for the first time. MRE-derived stiffness during free breathing was 1.9±0.51kPa and 8.87±1.44kPa with and without considering LD correction, respectively. Furthermore, this study showed good reproducibility and repeatability of the stiffness measurements under free breathing. Further studies are warranted in different disease states also to establish baseline stiffness values in healthy volunteers.Acknowledgements
We thank Department of Biomedical Technology, King Saud University, Riyadh, Kingdom of Saudi Arabia, for providing scholarship to F.Fakhouri and NIH-R01HL124096 for funding.References
1. Mariappan YK, Glaser KJ, Hubmayr RD, Manduca A, Ehman RL, McGee KP. MR elastography of human lung parenchyma: technical development, theoretical modeling and in vivo validation. J Magn Reson Imaging. 2011;33(6):1351-1361.
2. Fakhouri F, Kolipaka A, … HD-P, 2018 U. Magnetic Resonance Elastography Derived Stiffness As a Novel Biomarker in the Cystic Fibrosis Lung. St, Hoboken 07030-5774, Nj Usa.
3. Mariappan YK, Glaser KJ, Levin DL, et al. Estimation of the absolute shear stiffness of human lung parenchyma using 1H spin echo, echo planar MR elastography. J Magn Reson Imaging. 2014;40(5):1230-1237.
4. Meyer CH, Zhao L, Lustig M, et al. Dual-density and parallel spiral ASL for motion artifact reduction (PDF Download Available). Proc 19th Annu Meet ISMRM. 2011;64(2):3986. doi:DOI: 10.13140/RG.2.2.17527.62880
5. Lustig M, Pauly JM. SPIRiT: Iterative self-consistent parallel imaging reconstruction from arbitrary k-space. Magn Reson Med. 2010;64(2):457-471. doi:10.1002/mrm.22428
6. Holverda S, Theilmann RJ, Sá RC, et al. Measuring lung water: Ex vivo validation of multi‐image gradient echo MRI. J Magn Reson Imaging. 2011;34(1):220-224.
7. Theilmann RJ, Arai TJ, Samiee A, et al. Quantitative MRI measurement of lung density must account for the change in T 2* with lung inflation. J Magn Reson Imaging. 2009;30(3):527-534.
8. Manduca A, Oliphant TE, Dresner MA, et al. Magnetic resonance elastography: Non-invasive mapping of tissue elasticity. Med Image Anal. 2001;5(4):237-254. doi:10.1016/S1361-8415(00)00039-6
Figures