4098
Whole-Body MRI and PET/MRI at 1.5T and 3T MR System: Comparison of TNM Stage Assessment Capability with PET/CT in Non-Small Cell Carcinoma (NSCLC)1Division of Functional and Diagnostic Imaging Research, Department of Radiology, Kobe University Graduate School of Medicine, Kobe, Japan, 2Advanced Biomedical Imaging Research Center, Kobe University Graduate School of Medicine, Kobe, Japan, 3Canon Medical Systems Corporation, Otawara, Japan, 4Center for Radiology and Radiation Oncology, Kobe University Hospital, Kobe, Japan, 5Division of Radiology, Department of Radiology, Kobe University Graduate School of Medicine, Kobe, Japan
Synopsis
No one reported direct comparisons for TNM staging capability among whole-body MRI and PET/MRI at 1.5T and 3T systems and PET/CT in NSCLC patients. We hypothesize that whole-body MRI and PET/MRI at 1.5T and 3T MR systems have better potential for TNM stage assessment than whole-body FDG-PET/CT in NSCLC patients. The purpose of this study was to prospectively and directly compare TNM stage classification capability among whole-body MRI and PET/MRI at 1.5 and 3T MR systems and PET/CT in NSCLC patients.
Introduction
Accurate tumor staging is essential for choosing the appropriate treatment strategy for non-small cell lung cancer (NSCLC) patients. In 1990s, positron emission tomography (PET) or PET combined with CT (PET/CT) using 2-[fluorine-18]-fluoro-2-deoxy-D-glucose (FDG) were suggested as useful for TNM stag evaluation in NSCLC patients in routine clinical practice. Since 2007, whole-body magnetic resonance imaging (MRI) with diffusion-weighted imaging (DWI) at 1.5T or 3T systems and PET/MRI have been continuously testing in this setting (1, 2). Moreover, PET fused with MRI (PET/MRI) with FDG has been suggested as a new tool for TNM stage and postoperative recurrence evaluations since 2015 (3, 4). However, all PET/MRI has been generated by MRI at 3T MR system and not tested that at 1.5T system. No one reported direct comparisons for TNM staging capability among whole-body MRI and PET/MRI at 1.5T and 3T systems and PET/CT in NSCLC patients.
We hypothesize that whole-body MRI and PET/MRI at 1.5T and 3T MR systems have better potential for TNM stage assessment than whole-body FDG-PET/CT in NSCLC patients. The purpose of this study was to prospectively and directly compare TNM stage classification capability among whole-body MRI and PET/MRI at 1.5 and 3T MR systems and PET/CT in NSCLC patients.
Materials and Methods
104 pathologically diagnosed NSCLC patients (62 men, 42 women; mean age 71 years) prospectively underwent whole-body MRI at 1.5T and 3T systems, integrated PET/CT, and surgical, pathological and/ or more than 2-year follow-up examinations. Final diagnoses of T, N and M factors and clinical stage in each patient were determined according to all examination results by tumor board who were not included for image analyses in this study. All whole-body MRI including DWI were obtained by using a 3T MR system (Vantage Titan 3T, Canon Medical Systems) with multi-channel body and spine coils as having parallel imaging capability (Atlas SPEEDER, Canon Medical Systems) and a 1.5T MR system (Achieva, Philips Healthcare). All co-registered MR/PETs were generated by means of our proprietary software. The final TNM staging in each patient was determined based on tumor board reviewing all examination results. Then, T, N and M factors as well as tumor stage in each patient were prospectively assessed by all methods.
To evaluate agreements of all factors and stage between each method based on consensus reading and final diagnosis, kappa statistics were also performed. Diagnostic accuracy of each factor and clinical stage were also statistically compared each other by using McNemar’s test. Agreements were considered as poor for κ< 0.21, fair for κ = 0.21–0.40, moderate for κ = 0.41–0.60, substantial for κ = 0.61–0.80, and excellent for κ = 0.81–1.00. A p value < 0.05 was considered statistically significant for all statistical analyses.
Results
Representative case is shown in Figure 1 and 2. Agreements for each factor and stage on whole-body PET/MRI and MRI at 1.5T and 3T and PET/CT were significantly substantial or almost perfect (0.63≤κ≤0.93, p<0.0001). Accuracies of all factors and TNM staging are shown in Figure 3. On N factor assessment, accuracy of MRI at 3T system was significantly higher than that of PET/CT (p=0.02). On stage evaluation, accuracies of MRI at 3T and 1.5T systems and PET/MRI at 3T and 1.5T systems were significantly higher than that of PET/CT (MRI at 3T: p=0.0002, MRI at 1.5T: p=0.004, PET/MRI at 3T: p=0.001, PET/MRI at 1.5T: p=0.03).Conclusion
Whole-body MRIs and PET/MRIs at 1.5T and 3T systems have significantly better potential for N factor and clinical stage assessments than PET/CT in NSCLC patients.Acknowledgements
No acknowledgement found.References
1. Yi CA, Shin KM, Lee KS, et al. Radiology. 2008; 248(2): 632-642.
2. Ohno Y, Koyama H, Onishi Y, et al. Radiology. 2008; 248(2): 643-654.
3. Ohno Y, Koyama H, Yoshikawa T, et al. Radiology. 2015; 275: 849-861.
4. Ohno Y, Yoshikawa T, Kishida Y, et al. J Magn Reson
Imaging. 2017; 46(6): 1707-1717.
Figures
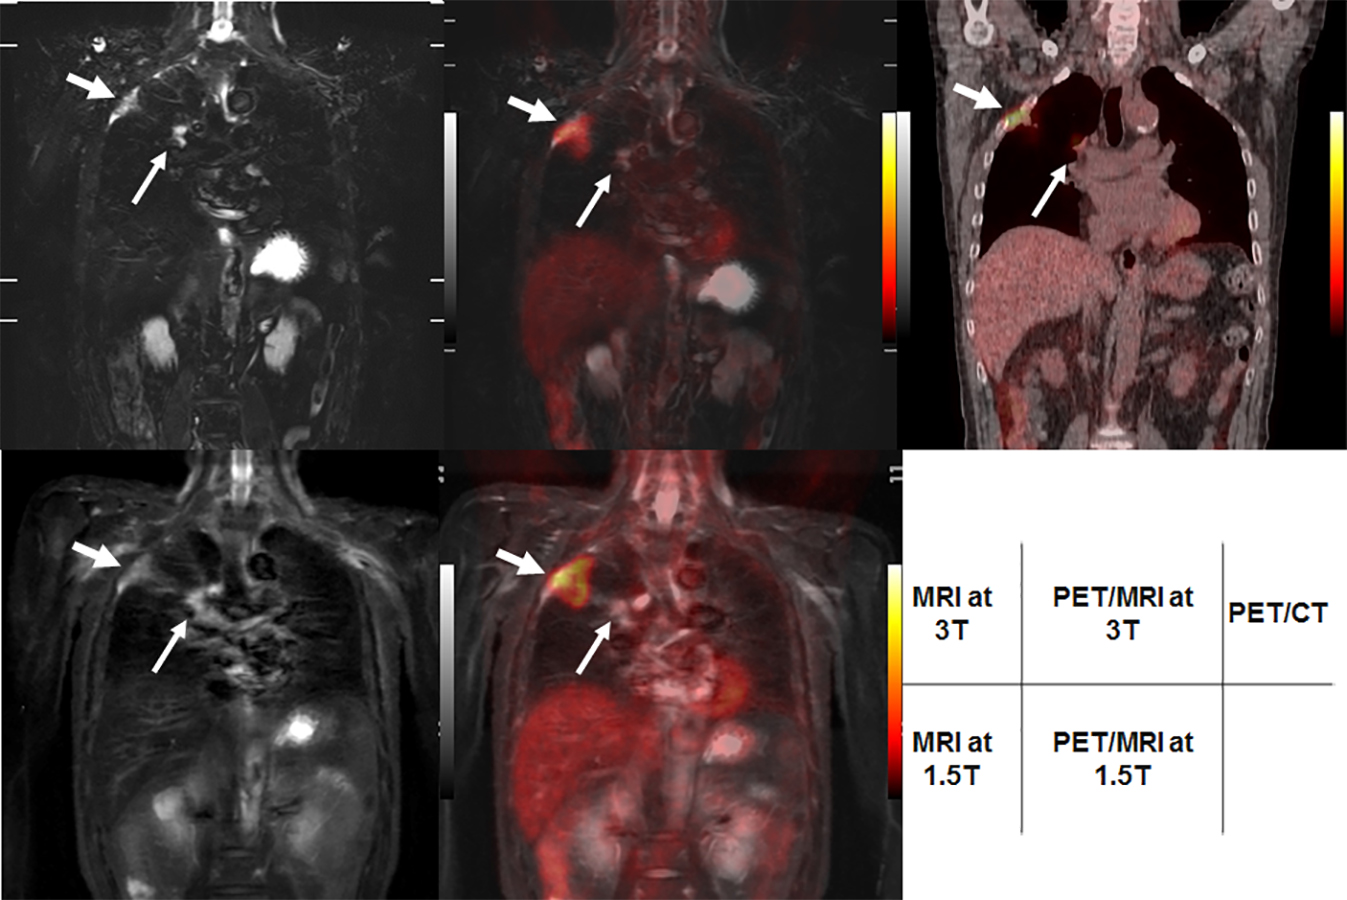
Figure 1. 62-year-old male patient with invasive adenocarcinoma with chest wall invasion (large arrow) and right hilar lymph node metastasis (small arrow) (pT3N1M0: pStage IIIA) .
STIR image and PET/MRI at both field strengths clearly demonstrate chest wall invasion and right hilar lymph node metastasis, although chest wall invasion and right hilar lymph node metastasis are not determined on PET/CT. This patient was accurately diagnosed on MRI and PET/MRI at 3T and 1.5T systems, and understaged on PET/CT.
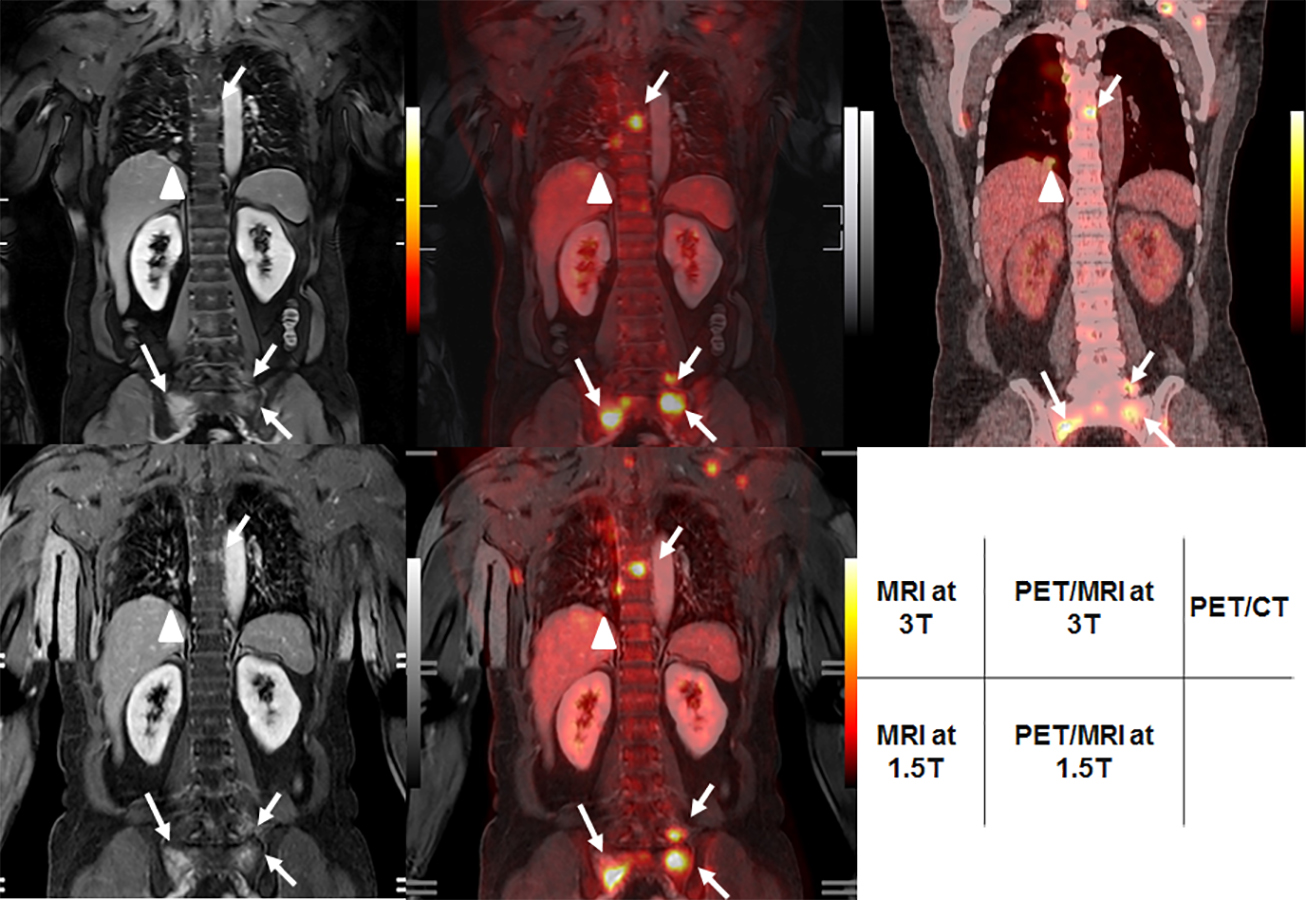
Figure 2. 57-year-old female patient with large cell carcinoma with multiple bone metastases (pT1cN1M1c: pStage IVB)
STIR image and PET/MRI at both field strengths and PET/CT clearly demonstrate primary lesion (arrow head) and multiple bone metastases (arrows). This patient was accurately diagnosed on all methods.
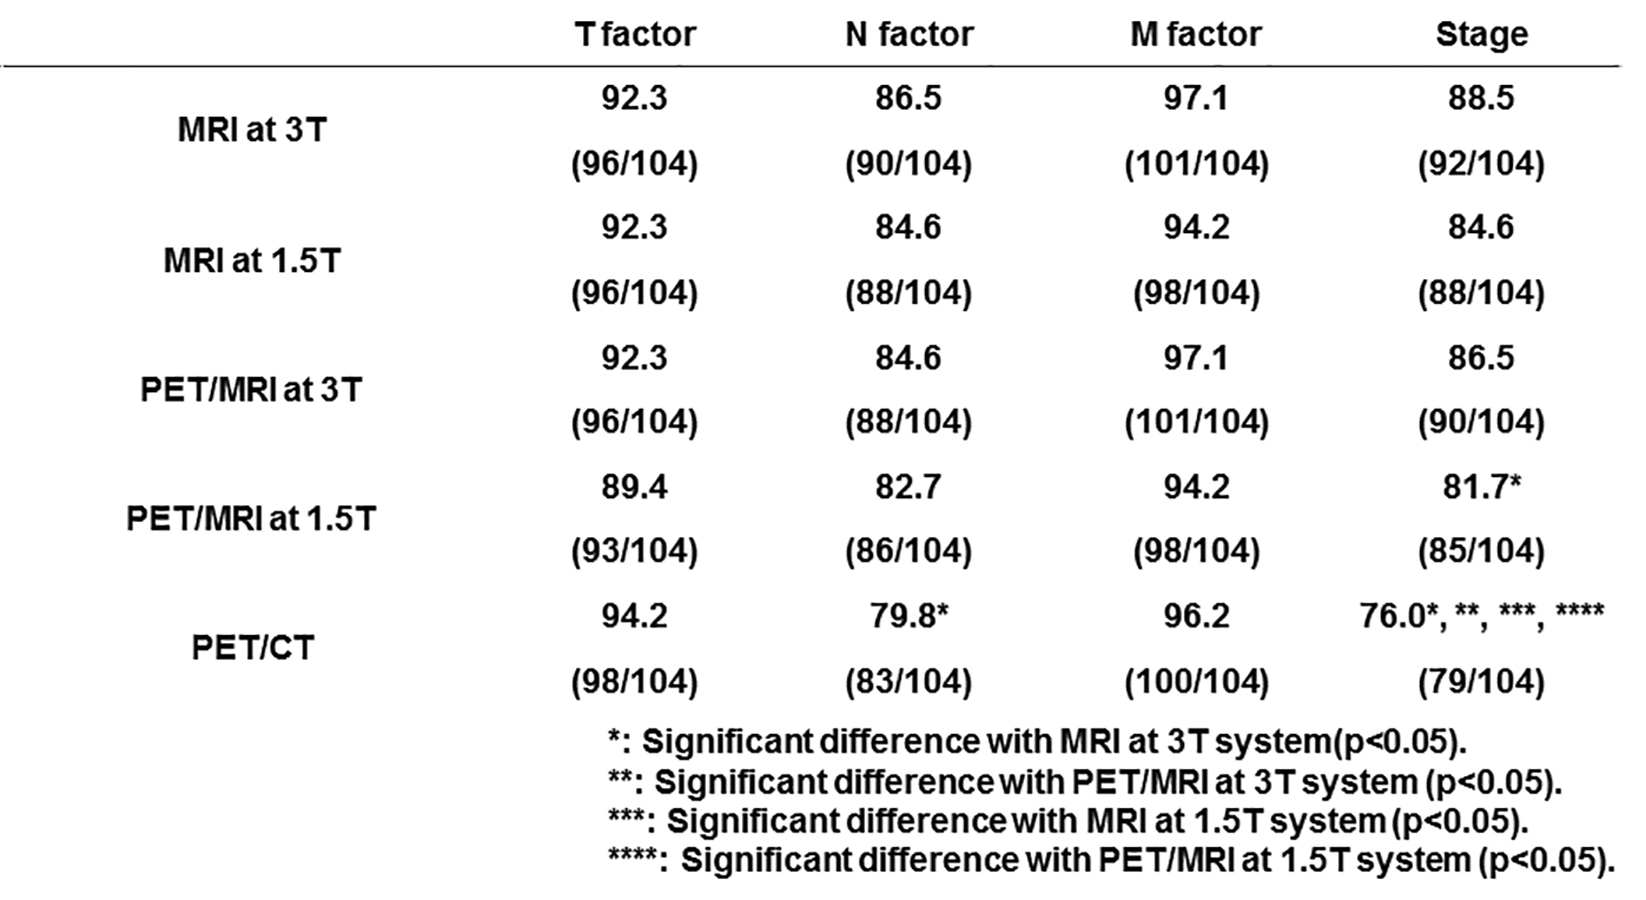
Figure 3. Comparisons of accuracy of each factor and stage among all methods.
On N factor assessment, accuracy of MRI at 3T system was significantly higher than that of PET/CT (p<0.05). On stage evaluation, accuracies of MRI at 3T and 1.5T systems and PET/MRI at 3T and 1.5T systems were significantly higher than that of PET/CT (p<0.05).