4096
Comparison of Therapeutic Effect Prediction among Dynamic Perfusion Area-Detector CT, Dynamic Perfusion MR Imaging and FDG-PET/CT in Small Cell Lung Cancer Patients with Limited Disease1Division of Functional and Diagnostic Imaging Research, Department of Radiology, Kobe University Graduate School of Medicine, Kobe, Japan, 2Advanced Biomedical Imaging Research Center, Kobe University Graduate School of Medicine, Kobe, Japan, 3Canon Medical Systems Corporation, Otawara, Japan, 4Center for Radiology and Radiation Oncology, Kobe University Hospital, Kobe, Japan, 5Division of Radiology, Department of Radiology, Kobe University Graduate School of Medicine, Kobe, Japan
Synopsis
No direct comparisons of therapeutic effect prediction have been performed among dynamic perfusion ADCT, dynamic perfusion MRI and FDG-PET/CT in small cell lung cancer (SLCLC) patients. We hypothesize that multiparametric approach by dynamic CE-perfusion ADCT, MRI and FDG-PET/CT can improve therapeutic effect prediction capability in SCLC patients, when compared with each modality assessment. The purpose of this study was to directly compare the capability for therapeutic outcome prediction among dynamics CE-perfusion ADCT and CE-perfusion MRI assessed by same mathematical method and FDG-PET/CT in SCLC patients assessed as limited disease (LD).
Introduction
During the last decade, some investigators have suggested that FDG-PET has a potential for therapeutic effect evaluation and/ or prediction of prognosis based on the glucose metabolism. On the other hands, perfusion matrix on dynamic first-pass contrast-enhanced (CE-) perfusion MRI or dynamic first-pass perfusion area-detector CT(ADCT) has been also suggested as one of the biomarkers for the prediction of therapeutic effect in non-small cell carcinoma (NSCLC) (1-5). Dynamic first-pass perfusion MRI as well as ADCT has been reported as a new technique for real whole tumor perfusion assessment in routine clinical practice. No direct comparisons of therapeutic effect prediction have been performed among dynamic perfusion ADCT, dynamic perfusion MRI and FDG-PET/CT in small cell lung cancer (SLCLC) patients.
We hypothesize that multiparametric approach by dynamic CE-perfusion ADCT, MRI and FDG-PET/CT can improve therapeutic effect prediction capability in SCLC patients, when compared with each modality assessment. The purpose of this study was to directly compare the capability for therapeutic outcome prediction among dynamics CE-perfusion ADCT and CE-perfusion MRI assessed by same mathematical method and FDG-PET/CT in SCLC patients assessed as limited disease (LD).
Materials and Methods
43 consecutive pathologically diagnosed SCLC patients (25 males and 18 females: mean age ± standard deviation [SD]: 67.1 ± 8.4 years) assessed as LD underwent dynamic CE-perfusion ADCT and MRI, FDG-PET/CT, chemoradiotherapy, and follow-up examinations. In each patient, therapeutic outcome was assessed according to RECIST guideline by tumor board. All patients were divided into following two groups: complete or partial response (CR+PR: responder, n=33) group and stable or progressive diseases (SD+PD: non-responder: n=10) group. All dynamic CE-perfusion MRI using parallel imaging technique (TR 2.9 ms/ TE 1.1 ms/ flip angle 12 degree, reduction factor 2) were obtained at a 3T system (Vantage Titan 3T, Canon Medical Systems Corporation), and all PET/CT examinations were performed by using standard technique on a PET/CT scanner (Discovery 600M, GE Healthcare). In each patient, total perfusion (TP) and tumor perfusions derived from pulmonary perfusion (PP) and systemic perfusion (SP) calculated from dynamic CE-perfusion MR data and SUVmax on PET/CT were assessed at each targeted lesion, and averaged to determine final values. All perfusion MR indexes were calculated by dual-input maximum slope methods.
To assess the difference of each index between responder and non-responder groups, Student’s t-test was performed. To compare the capability for distinguishing two groups, all indexes as having significant difference were assessed by ROC analysis. Then, diagnostic performances were compared each other by McNemar’s test. Finally, disease free and overall survivals between responders and non-responders assessed by each index were compared by Kaplan-Meier method followed by log-rank test.
Results
Representative case is shown in Figure 1. All indexes except TP had significant differences between responders and non-responders (p<0.05). Results of ROC analysis for distinguishing responders from non-responders by indexes as having significant difference between two groups are shown in Figure 2. Area under the curves (AUCs) of SP from ADCT (AUC=0.92) and MRI (AUC=0.92) were significantly larger than that of SUVmax on PET/CT (AUC=0.73: ADCT, p=0.04; MRI, p=0.04). Results of compared capability of each index for distinguishing responder from non-responder groups are shown in Figure 3. Sensitivities and accuracies of SP from dynamic CE-perfusion ADCT and dynamic CE-perfusion MRI were significantly higher than those of FDG-PET/CT (p<0.05). Results of compared disease free and overall survivals between responders from non-responders divided by each index are shown in Figure 4. Disease free survivals of TP and SP from both modalities and SUVmax as well as overall survivals of TP and SP from both modalities had significant difference between responders and non-responders (p<0.05).Conclusion
Dynamic first-pass CE-perfusion ADCT and MRI have good potentials for prediction of disease free and overall survivals and considered as at least as valuable as PET/CT in SCLC patients.Acknowledgements
No acknowledgement found.References
1. Ohno Y, Nogami M, Higashino T, et al. J Magn Reson Imaging. 2005 Jun;21(6):775-83.
2. Ohno Y, Koyama H, Yoshikawa T, et al. AJR Am J Roentgenol. 2012; 198: 75-82.
3. Ohno Y, Koyama H, Fujisawa Y, et al. Eur J Radiol. 2016; 85: 176-186.
4. Ohno Y, Fujisawa Y, Koyama H, et al. Eur J Radiol. 2017; 86: 83-91.
5. Yabuuchi H, Kawanami S, Iwama E, et al. Radiology. 2018; 286: 685-695.
Figures
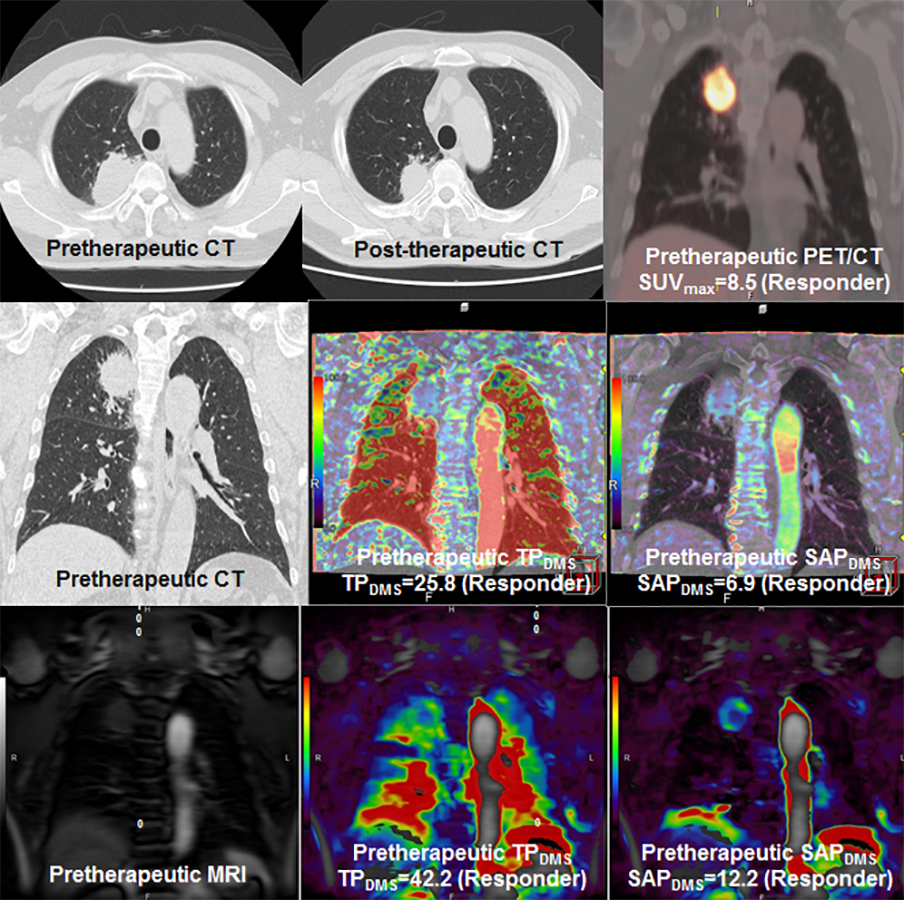
Figure 1. 65-year-old male patient with SCLC diagnosed as LD and assessed as responder (L to R in first line: pre- and post-therapeutic CT and pretherapeutic FDG-PET/CT; L to R in second line: pretherapeutic MPR image and TP and SP maps from dynamic CE-perfusion ADCT; L to R in third line: pretherapeutic original MR image and TP and SP maps from dynamic CE-perfusion MRI).
SUVmax was determined as 8.5. On ADCT, TP and SP were determined as 25.8 ml/100ml/min, and 6.9 ml/100ml/min. MRI determined TP and SP as 42.2 ml/100ml/min, and 12.2 ml/100ml/min. When applied feasible threshold values, this case was predicted as responder.
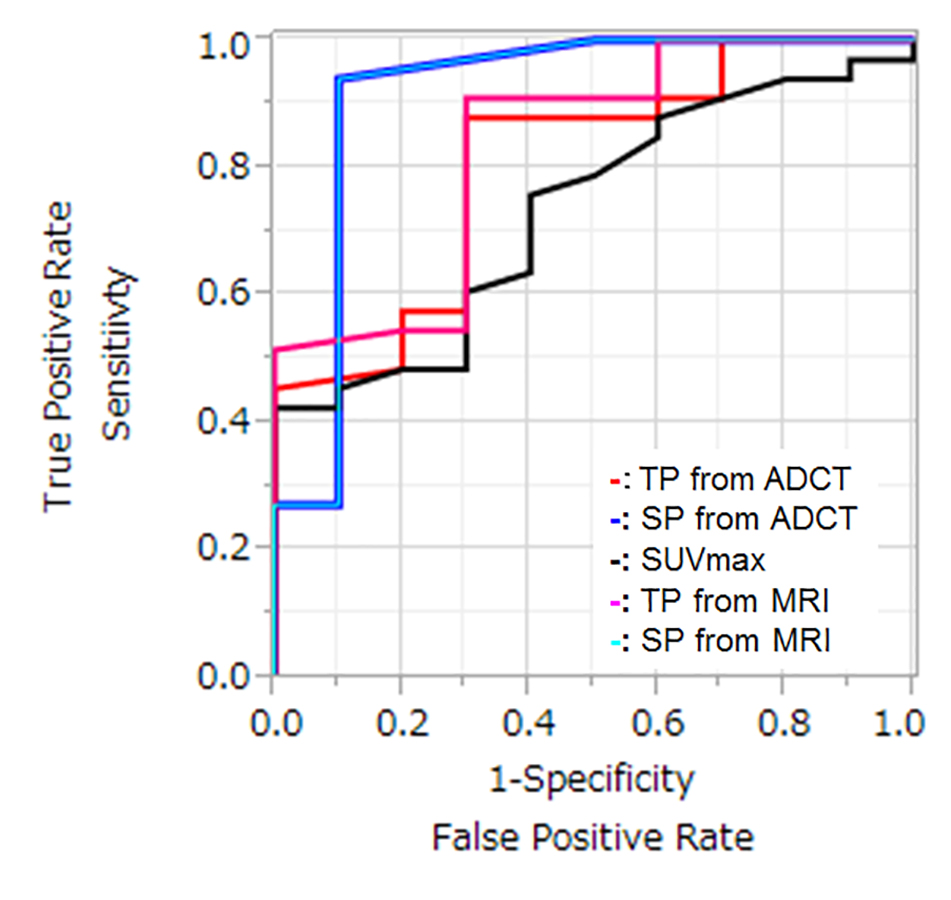
Figure 2. Results of ROC analysis among all indexes.
Area under the curves (AUCs) of SP from ADCT (AUC=0.92) and MRI (AUC=0.92) were significantly larger than that of SUVmax on PET/CT (AUC=0.73: ADCT, p=0.04; MRI, p=0.04).
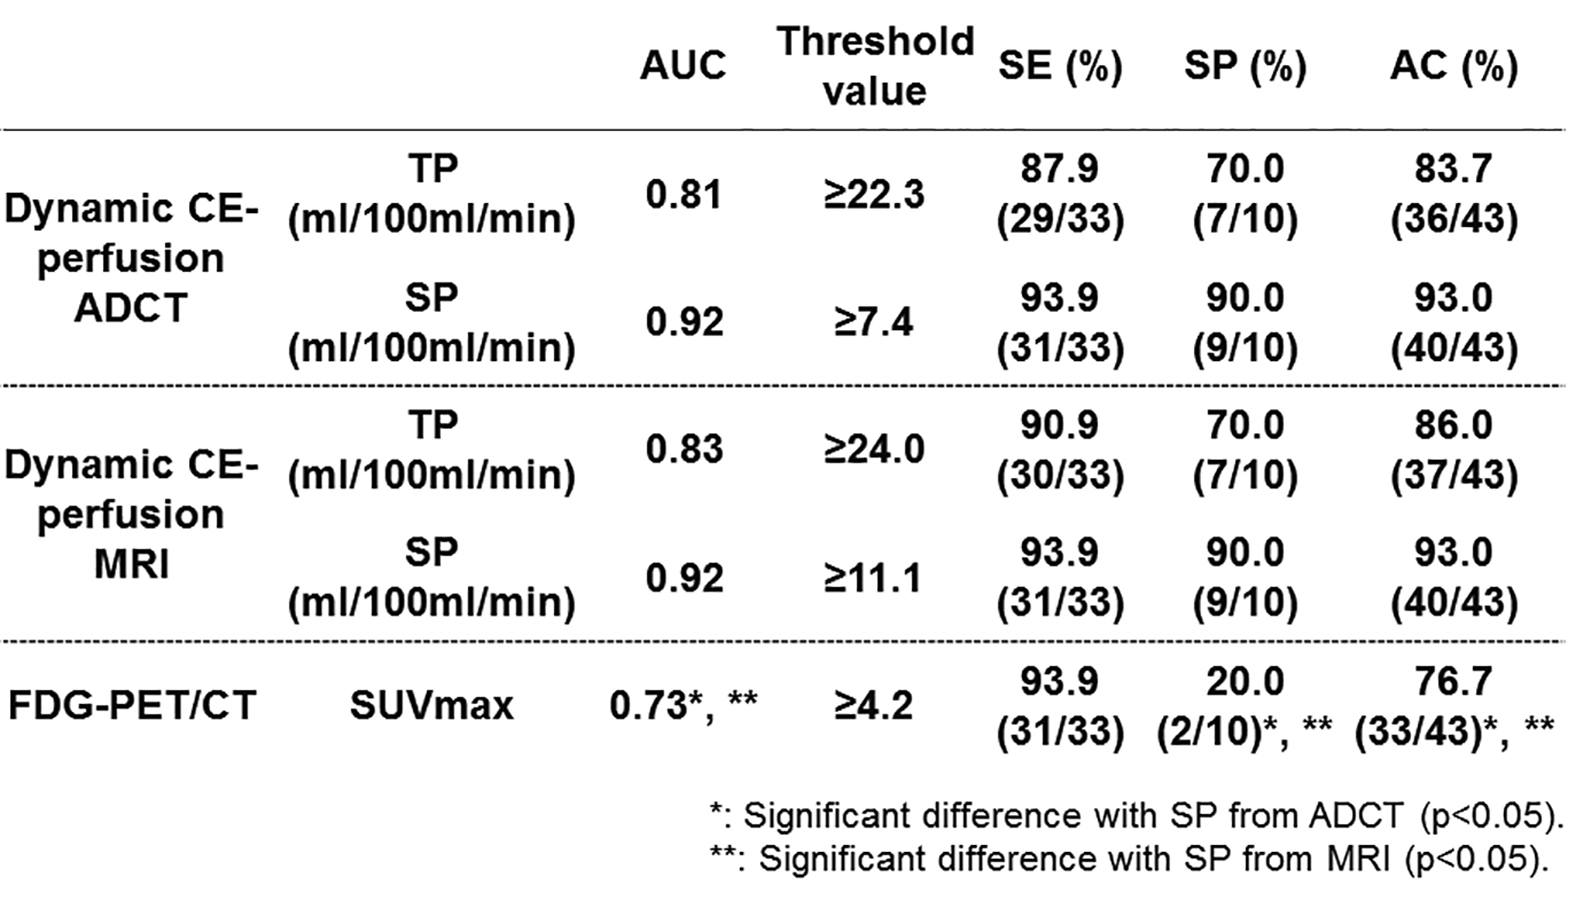
Figure 3. Comparison of differentiation capability of responders from non-responders among all methods.
Sensitivities and accuracies of SP from dynamic CE-perfusion ADCT and dynamic CE-perfusion MRI were significantly higher than those of FDG-PET/CT (p<0.05).
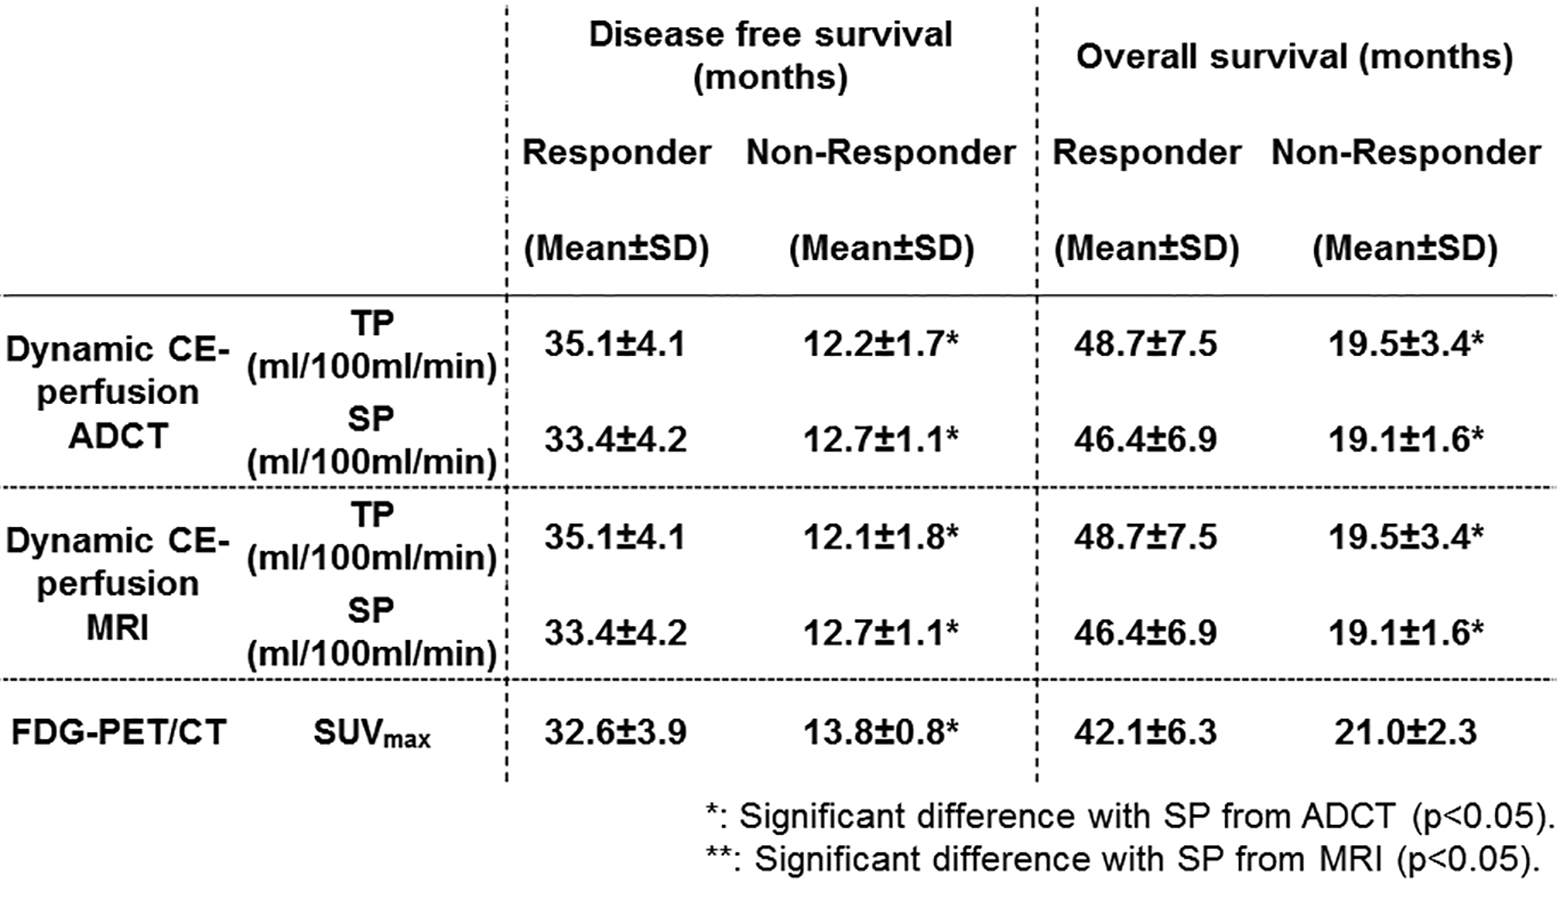
Figure 4. Results of compared disease free and overall survivals between responders from non-responders divided by each index.
Disease free survivals of TP and SP from both modalities and SUVmax as well as overall survivals of TP and SP from both modalities had significant difference between responder and non-responder groups (p<0.05).