4087
Comparison of 1.5T and 3T 2D UTE Breathhold Lung Imaging1Department of Internal Medicine II, Ulm University Medical Center, Ulm, Germany, 2AG Experimental Cardiovascular Imaging (ExCaVI), University of Ulm, Ulm, Germany
Synopsis
In this study a breathhold two-dimensional ultra-short TE (UTE) protocol was compared for imaging of the lung parenchyma and ventilation at 1.5T and 3T field strength. The resulting SNR values and parameter maps indicate a clear advantage for 3T. Proton fraction and SNR changes (anterior to posterior, expiration vs. inspiration) can be clearly assessed with both field-strength. Different resulting values for the lung and proton fractions need further attention.
Purpose
To investigate the potential benefit of 3T over 1.5T for ultrashort echo-time (UTE) for assessment of the lung parenchyma and ventilation.Introduction
Ultrashort echo-time imaging (UTE) has been applied for imaging of lung parenchyma, which as such is challenging due to the intrinsically low signal caused by the low proton density and short T2* values due to the frequent air-tissue interfaces in the lung parenchyma.1 The use of higher field strengths as such appears attractive for increasing the signal-to-noise ratio (SNR), but due to the decreasing T2* values, the potential advantage maybe lost. In this contribution UTE techniques are compared at 1.5T and 3T regarding SNR, and ventilation and proton fraction.Methods
Seven healthy volunteers (three female, four male) were examined on a 1.5T (Achieva 1.5T, Philips Healthcare, Best, The Netherlands) and 3T MR scanner (Achieva 3T, Philips Healthcare, Best, The Netherlands). A two-dimensional ultra-short echo-time (2D UTE) protocol (TE=0.38ms, TR=1.89ms, flip angle=3.5°, slice thickness = 20mm, tiny golden angle φ7=23.62814°) was applied to acquire three coronal slices (anterior, middle, posterior) in multiple breathholds (TACQ=5s per slice and respiratory phase).The signal intensity (SI) and the signal-to-noise ratio (SNR) were analysed to derive the fractional ventilation2 ($$$FV = \frac{SI_{EX} - SI_{IN}}{SI_{EX}}$$$) and proton fraction3 ($$$f_P = \frac{SI_{lung}}{SI_{muscle}} \cdot \exp\left( \frac{TE}{T2^*} \right)$$$) of the lung parenchyma. For T2* decay correction, T2*=0.74ms (3T) and T2*=2.11ms (1.5T) was used.4Results
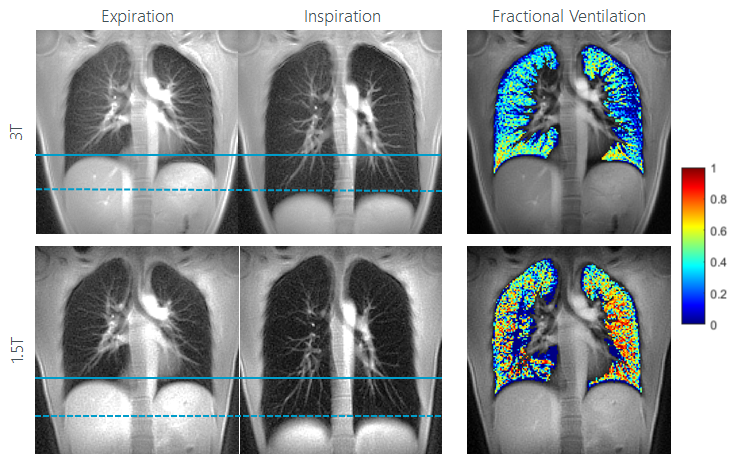
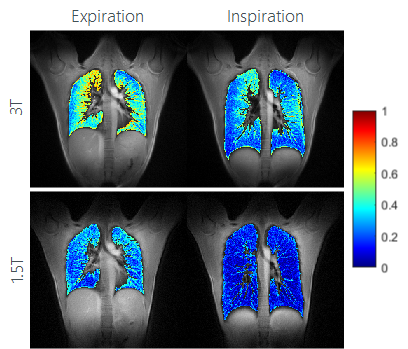
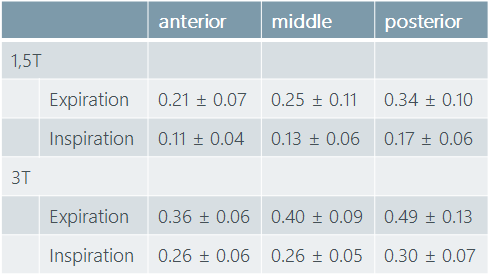
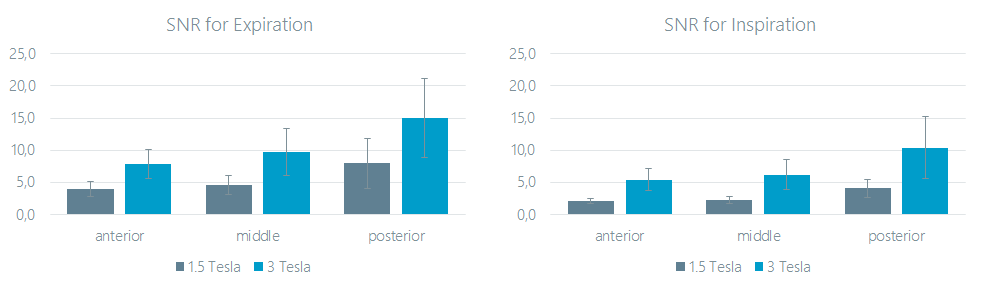
Differences in the lung parenchyma signal intensity between inspiration and expiration were observed at both field strength. Ventilation maps could successfully be obtained by the analysis of the signal intensity changes between inspiration and expiration (Figure 1). Proton fraction (density) could be quantified and clear differences between inspiration and expiration were observed (Figure 2). As shown in Table 1 proton density increases from anterior to posterior and a clear difference between the expiration and inspiration state can be appreciated. The SNR values on 3T were clearly superior over 1.5T, and a significant increases of SNR of up to almost 100% were observed at 3T (Figure 3). At both field strength, the steady increase in proton fraction and SNR from anterior to posterior can be clearly appreciated. Even though, perfect match between 1.5T and 3T cannot expected due to likely different respiratory amplitudes, an unexpected large difference between the ventilation fraction (Figure 1) as well as the proton fraction (Figure 2) was observed between the different field strengths.Conclusion
The study shows the feasibility of breathhold 2D UTE at 1.5T and 3T for the imaging of respiratory motion and lung ventilation. In direct comparison, 3T appears clearly advantageous with respect to SNR and the resulting parameter maps appear less noisy. Breathhold times can be kept below 5s, enabling scanning in cooperative patients.5 The differences between the derived proton fractions may be explainable by insufficient accuracy of the T2* relaxation time assumed for the respective correction, which should be done individually for each subjects and maybe separately for inspiration and expiration. Further, the low SNR values for inspiration at 1.5T may cause erroneous results for the ventilation fraction.Acknowledgements
The authors thank the Ulm University Center for Translational Imaging MoMAN for its support.References
1. TIBILETTI, Marta ; KJØRSTAD, Åsmund ; BIANCHI, Andrea ; SCHAD, Lothar R. ; STILLER,Detlef ; RASCHE, Volker: Multistage self-gated lung imaging in small rodents. In: Magneticresonance in medicine 75 (2016), Nr. 6, S. 2448–2454
2. KJØRSTAD, Åsmund ; CORTEVILLE, Dominique M. ; HENZLER, Thomas ; SCHMIDBINDERT,Gerald ; HODNELAND, Erlend ; ZÖLLNER, Frank G. ; SCHAD, Lothar R.: Quantitativelung ventilation using Fourier decomposition MRI; comparison and initial study.In: Magnetic Resonance Materials in Physics, Biology and Medicine 27 (2014), Nr. 6, S.467–476
3. HATABU, Hiroto ; ALSOP, David C. ; LISTERUD, John ; BONNET, Mathieu ; GEFTER, WarrenB.: T2* and proton density measurement of normal human lung parenchyma usingsubmillisecond echo time gradient echo magnetic resonance imaging. In: Europeanjournal of radiology 29 (1999), Nr. 3, S. 245–252
4. YU, Jiangsheng ; XUE, Yiqun ; SONG, Hee K.: Comparison of lung T2* during freebreathingat 1.5 T and 3.0 T with ultrashort echo time imaging. In: Magnetic resonancein medicine 66 (2011), Nr. 1, S. 248–254
5. LEDERLIN, Mathieu ; CRÉMILLIEUX, Yannick: Three-dimensional assessment of lungtissue density using a clinical ultrashort echo time at 3 tesla: a feasibility study in healthysubjects. In: Journal of Magnetic Resonance Imaging 40 (2014), Nr. 4, S. 839–847
Figures