4086
Self-Gated 2D UTE Lung Ventilation Imaging1Department of Internal Medicine II, Ulm University Medical Center, Ulm, Germany, 2AG Experimental Cardiovascular Imaging (ExCaVI), University of Ulm, Ulm, Germany
Synopsis
Deriving functional lung data by MRI is challenging, but initial studies have proven the applicability of multi-respiratory stage data for deriving fractional lung ventilation data. In this study a two-dimensional ultra-short TE protocol was used to acquire breathhold (expiration and inspiration) and free breathing date of the lung parenchyma. Lung proton density changes and respective fractional ventilation could be assessed with either techniques. Due to the shallow breathing, in the free-breathing approach differences resulted less pronounced as in the breathhold approach.
Purpose
To investigate the feasibility of deriving lung ventilation and parenchymal proton density data from self-gated ultra-short echo-time MRI.Introduction
Providing functional information of the lung by MRI is challenging due to the intrinsically low signal caused by the low proton density and short T2* values due to the frequent air-tissue interfaces in the lung parenchyma. Ultrashort echo time (UTE) techniques have proven applicable for imaging of short T2* tissue and have been successfully applied to lung imaging.1-4 Assessment of lung function by MRI is still in its infancy, but it has been proven that the assessment of fractional ventilation and perfusion by analysis of the MR signal changes over the cardiac and respiratory cycle5,6 appear promising. In this contribution the use of self-gated UTE in direct comparison with breathhold techniques for deriving lung ventilation and proton densities is investigated.Methods
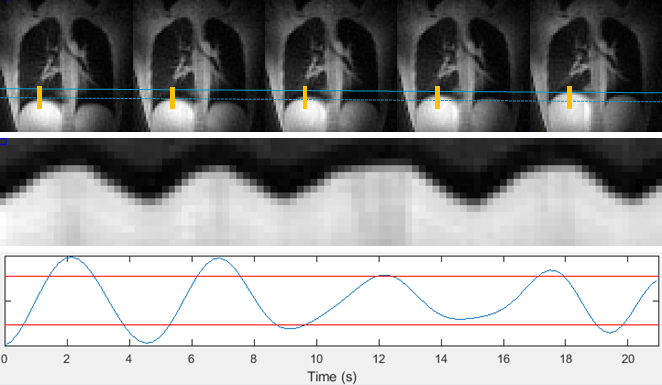
Seven healthy volunteers (three female, four male) were examined on a 3T MR whole-body system (Achieva, Philips Healthcare, Best, The Netherlands). A two-dimensional ultra-short echo-time (2D UTE) protocol (TE=0.38ms, TR=1.89ms, flip angle=3.5°, slice thickness=20mm, tiny golden angle φ7=23.62814°) was applied to acquire three coronal slices (anterior, middle, posterior) in multiple breathholds (TACQ=5s per slice and respiratory phase) and during free-breathing (TACQ=4.23min). The tiny golden angle acquisition yields a uniform coverage of the k-space for any number of projections. Sliding-window low-resolution images (np=200, temporal resolution ∆t≈380ms, Figure 1) were reconstructed from the free-breathing data and a respiratory gating signal derived from the lung-liver interface as suggested earlier.2 According to the gating signal data were sorted to inspiration (20% bottom values) or expiration (20% top values) as indicated in Figure 1. The signal intensity (SI) and the signal-to-noise ratio (SNR) were analysed to derive the fractional ventilation ($$$FV = \frac{SI_{EX} - SI_{IN}}{SI_{EX}}$$$)6 and proton fraction ($$$ f_P = \frac{SI_{lung}}{SI_{muscle}} \cdot \exp\left( \frac{TE}{T2^*} \right) $$$)3 of the lung parenchyma. For considering T2* decay during proton density calculation, a T2*=0.74ms7 was assumed.Results
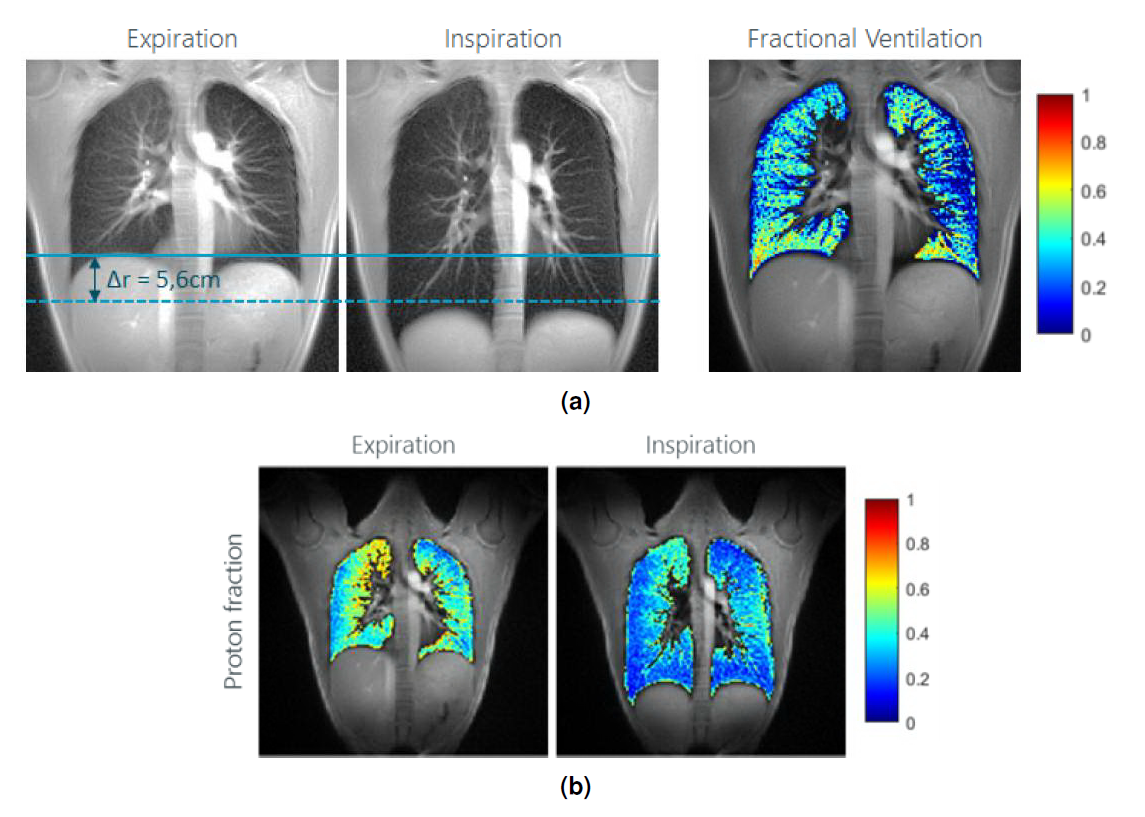
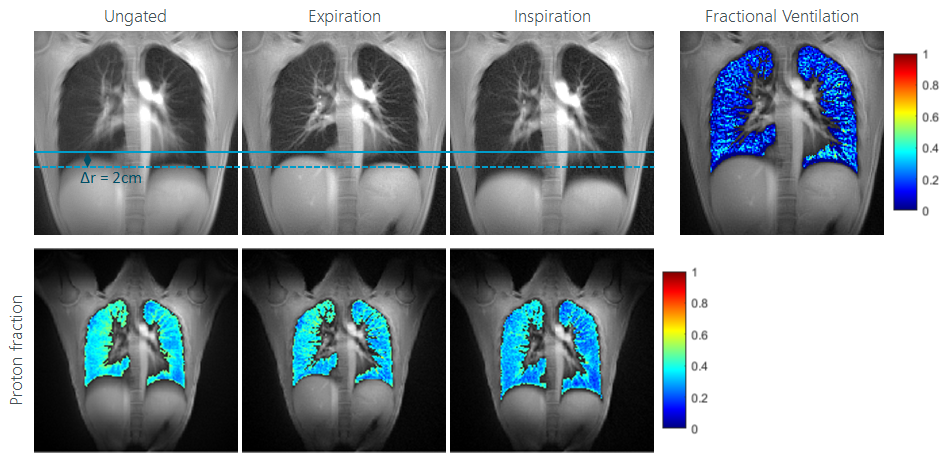
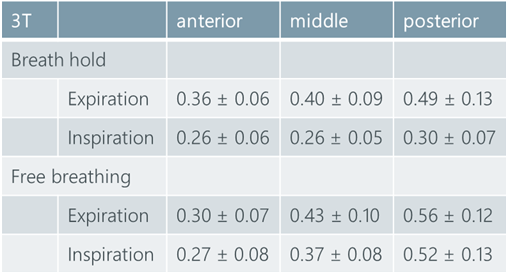
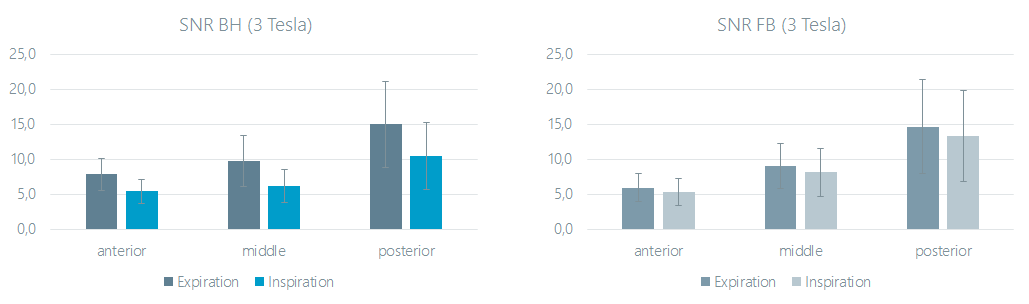
Differences in the lung parenchyma signal intensity between inspiration and expiration were observed for the BH approach as well as for the free-breathing approach. Ventilation maps could successfully be obtained by the analysis of the signal intensity changes between inspiration and expiration in either approach (Figure 2,3). The proton fraction (density) could be quantified and clear differences between inspiration and expiration were observed (Figure 2,3). As expected, fP steadily increases from anterior to posterior (Table 1), and clear differences between inspiration and expiration can be appreciated. In direct comparison, the free-breathing approach yields lower values for the fractional ventilation as well as proton density changes over the respiratory cycle. Analysis of the respiratory amplitude ∆r (difference between diaphragm position between inspiration and expiration) reveals a more than two-times larger value for the breathhold (∆rBH=5.6cm vs. ∆rFB=2cm) approach, indicating a more shallow breathing during free breathing. SNR values resulted slightly lower (Figure 4) for the free-breathing approach, but revealed a similar SNR increase from anterior to posterior.Conclusion
The study shows the feasibility of 2D UTE at 3T for the imaging of respiratory motion and respective changes of the lung parenchyma density. Fractional ventilation and proton density can be derived by the free-breathing (FB) as well as the breathhold (BH) approach. The acquisition time for both approaches should be applicable for clinical evaluation in cooperative patients.4 The multiple breathholds may be difficult in severely impaired patients and the free-breathing approach may be advantageous. However, due to the different breathing amplitudes, the fractional ventilation map as well as the proton densities resulted different between both approaches, and the self-gating approach may be less sensitive, which has to be proven in further clinical studies.Acknowledgements
The authors thank the Ulm University Center for Translational Imaging MoMAN for its support.References
1. TIBILETTI, Marta ; KJØRSTAD, Åsmund ; BIANCHI, Andrea ; SCHAD, Lothar R. ; STILLER,Detlef ; RASCHE, Volker: Multistage self-gated lung imaging in small rodents. In: Magneticresonance in medicine 75 (2016), Nr. 6, S. 2448–2454
2. TIBILETTI, Marta ; PAUL, Jan ; BIANCHI, Andrea ; WUNDRAK, Stefan ; ROTTBAUER,Wolfgang ; STILLER, Detlef ; RASCHE, Volker: Multistage three-dimensional UTE lungimaging by image-based self-gating. In: Magnetic resonance in medicine 75 (2016), Nr.3, S. 1324–1332
3. HATABU, Hiroto ; ALSOP, David C. ; LISTERUD, John ; BONNET, Mathieu ; GEFTER, WarrenB.: T2* and proton density measurement of normal human lung parenchyma usingsubmillisecond echo time gradient echo magnetic resonance imaging. In: Europeanjournal of radiology 29 (1999), Nr. 3, S. 245–252
4. LEDERLIN, Mathieu ; CRÉMILLIEUX, Yannick: Three-dimensional assessment of lungtissue density using a clinical ultrashort echo time at 3 tesla: a feasibility study in healthysubjects. In: Journal of Magnetic Resonance Imaging 40 (2014), Nr. 4, S. 839–847
5. VELDHOEN, Simon ; WENG, Andreas M. ; KNAPP, Janine ; KUNZ, Andreas S. ; STÄB,Daniel ; WIRTH, Clemens ; SEGERER, Florian ; HEBESTREIT, Helge ; MALZAHN, Uwe ;KÖSTLER, Herbert u. a.: Self-gated Non–Contrast-enhanced Functional Lung MR Imagingfor Quantitative Ventilation Assessment in Patients with Cystic Fibrosis. In: Radiology283 (2016), Nr. 1, S. 242–251
6. KJØRSTAD, Åsmund ; CORTEVILLE, Dominique M. ; HENZLER, Thomas ; SCHMIDBINDERT,Gerald ; HODNELAND, Erlend ; ZÖLLNER, Frank G. ; SCHAD, Lothar R.: Quantitativelung ventilation using Fourier decomposition MRI; comparison and initial study.In: Magnetic Resonance Materials in Physics, Biology and Medicine 27 (2014), Nr. 6, S.467–476
7. YU, Jiangsheng ; XUE, Yiqun ; SONG, Hee K.: Comparison of lung T2* during freebreathingat 1.5 T and 3.0 T with ultrashort echo time imaging. In: Magnetic resonancein medicine 66 (2011), Nr. 1, S. 248–254
Figures