4076
Novel Nanoparticle-enhanced T1-Mapping Enables Estimation of Placental Fractional Blood Volume in a Pregnant Mouse Model1Radiology, Baylor College of Medicine, Houston, TX, United States, 2Pediatric Radiology, Texas Children's Hospital, Houston, TX, United States, 3Pediatric Oncology, Baylor College of Medicine, Houston, TX, United States
Synopsis
Greater than 60% of placentae from low birth weight infants show signs of hypoxic or ischemic injury from vascular hypo-perfusion. Placental fractional blood volume (FBV) is indicative of perfusion and may be used as a marker of local ischemia. Non-invasive methods for the estimation of placental FBV are therefore of interest in the study of placental pathology. In this pre-clinical study, we investigated contrast-enhanced magnetic resonance imaging (MRI) for the estimation of placental FBV in a pregnant mouse model. A high T1 relaxivity blood-pool liposomal-gadolinium (liposomal-Gd) contrast agent, which does not permeate placental barrier in rodents, was used to calculate placental FBV.
Significance
Non-invasive methods for the estimation of placental fractional blood volume (FBV) are of great interest for characterizing vascular perfusion in placenta during pregnancy. In particular, magnetic resonance imaging (MRI) methods for FBV estimation at clinically relevant field strengths would be invaluable due to 3D imaging capabilities and lack of radiation. In this pre-clinical study, we investigated if a variable flip angle method with contrast-enhanced MRI utilizing a high T1 relaxivity liposomal gadolinium blood-pool contrast agent (liposomal-Gd)1,2 would enable accurate estimation of placental FBV in a pregnant mouse model. MRI-derived FBV was compared with contrast-enhanced computed tomography (CECT) derived FBV, where signal is linearly proportional to the concentration of iodine contrast agent. Previous studies have also demonstrated that unlike conventional Gd contrast agents, liposomal-Gd does not permeate placental barrier in pregnant rodent models1,2.Methods
In vivo studies were performed in pregnant C57BL/6 mice (8-10 feto-placental units per animal) on a 1T permanent magnet scanner at day 18 of gestation. Anatomical scans were captured with a T2-weighted fast spin-echo sequence (T2w-FSE) acquired with the following parameters: echo time (TE) = 80 ms, repetition time (TR) = 6816 ms, slice thickness = 0.8 mm, field of view = 80 mm, slices = 33, matrix = 256 x 250, in-plane resolution = 312.5 µm x 320 µm, number of excitations = 2, echo train length = 2, scan time ~ 6 min. T1-mapping was calculated using a variable flip angle study wherein pre-contrast and post-contrast images were acquired using a T1-weighted 3D gradient-recalled echo sequence (T1w-GRE) with the following parameters: TE = 3.5 ms, TR = 20 ms, flip angle (α) = [8°, 15°, 25°, 35°, 45°], slice thickness = 0.5 mm, field of view = 60 mm, slices = 48, matrix = 120 x 120 (0.5 mm isotropic voxels), scan time ~12 minutes. A high resolution T1w-GRE sequence (0.3 mm isotropic voxels, α=70°) was also acquired to better visualize placental margins. Post-contrast images were acquired following intravenous administration of liposomal-Gd (0.1 mmol Gd/kg). Placental T1 relaxation times (T1P) were calculated by fitting signal intensity (S) in placental tissue against flip angle at each of the five angles for both pre-contrast and post-contrast images according to a relation derived from the gradient recalled echo signal equation (Equation 1)2.
$$ S/sin(\alpha) = S/tan(\alpha)·exp(-TR/T1)+M_0(1-exp(-TR/T1)) $$
M0 describes the instrument scaling constant and proton density is assumed to be unchanged between measurements at variable flip angles. Placental tissue regions of interest in pre-contrast T1w-GRE images were found through comparison with T2w-FSE images. Signal intensity sampled in the inferior vena cava (IVC) was similarly used to calculate the T1 of circulating blood (T1IVC). T1 relaxation rate ($$$R1= 1/T1$$$) was then calculated for the placenta (R1P) and IVC (R1IVC). Placental FBV was calculated as the ratio of increase in relaxation rate between placenta and IVC according to the following equation: $$$FBV = Δ R1^P / Δ R1^{IVC}$$$. CECT was used for validation of MRI-derived FBV. CT scans were performed on a small animal micro-CT scanner. CT scans were acquired pre-contrast and after intravenous administration of a liposomal-iodinated agent (1.1 g I/kg). CT-derived placental FBV (FBVCT) was calculated as the ratio of signal enhancement in placenta to IVC.
Results
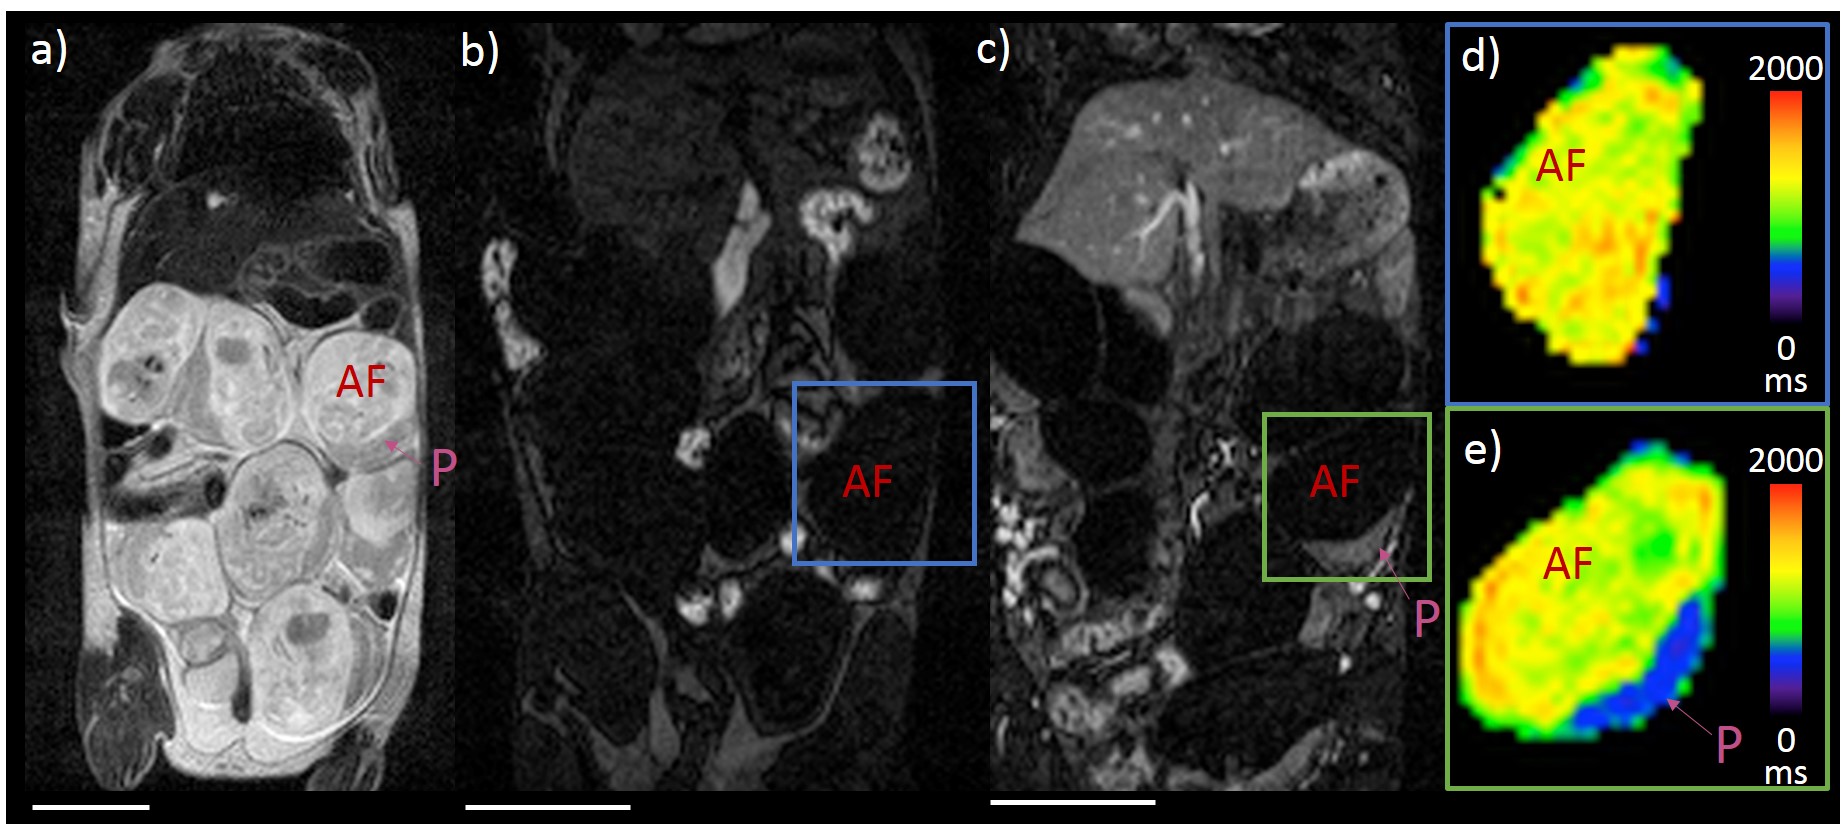
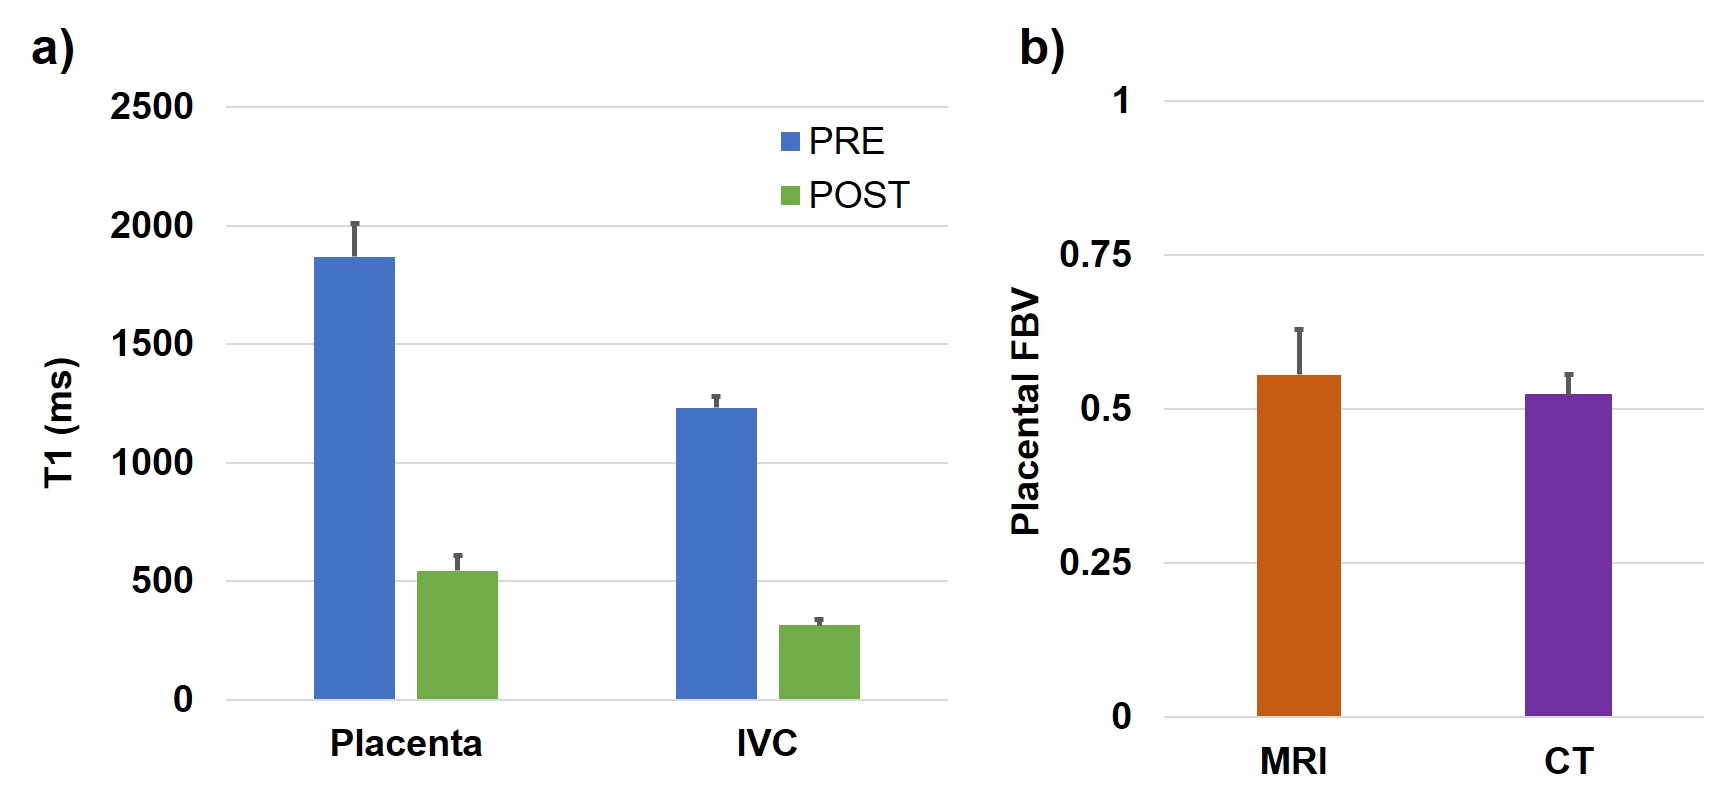
T2w-FSE anatomical images of mouse abdomen enabled identification of placenta and fetal compartment (Figure 1a). T1w-GRE images (α =45°) demonstrated uniform and stable signal enhancement in placenta and IVC in post-contrast images (Figure 1b,c). T1-mapping using variable flip angle T1w-GRE sequence showed significant decrease in T1 relaxation times in placenta, but not fetal compartment (Figure 1d,e). T1 relaxation times reduced nearly four-fold in the IVC (pre-contrast T1IVC = 1230 ± 50 ms; post-contrast T1IVC = 310± 25 ms) and three-fold in placenta (pre-contrast T1P = 1870 ± 150 ms; post-contrast T1P = 540 ± 70 ms) (Figure 2a). MRI-derived placental FBV was computed as 0.55 ± 0.07 and showed good agreement with CT-derived FBV (Figure 2b).Discussion and Conclusions
T1-mapping using a variable flip angle method with a liposomal-Gd blood pool contrast agent for MRI enabled accurate determination of placental fractional blood volume. The long circulating property of liposomal-Gd resulted in uniform vascular signal enhancement and shortened T1 relaxation times in IVC and placental tissue for a prolonged scanning period. Comparison with CT imaging demonstrated that CE-MRI using liposomal-Gd yields accurate measurement of FBV and therefore could serve as an alternative, radiation-free imaging technique for this purpose. Implementing a variable flip angle method at a clinically relevant field strength of 1T further demonstrates the potential viability of this approach in characterizing placental vascular perfusion during pregnancy.Acknowledgements
The authors acknowledge the Texas Children’s Hospital Small Animal Imaging Facility (SAIF) for micro-CT imaging. Financial support for this study was provided by National Institutes of Health (NIH) Grant No. R01 HD094347-01.References
[1] K.B. Ghaghada, Z.A. Starosolski, S. Bhayana, I. Stupin, C. V. Patel, R.C. Bhavane, H. Gao, A. Bednov, C. Yallampalli, M. Belfort, V. George, A. V. Annapragada, Pre-clinical evaluation of a nanoparticle-based blood-pool contrast agent for MR imaging of the placenta, Placenta. (2017). doi:10.1016/j.placenta.2017.06.008.
[2] A.N. Shetty, R. Pautler, K. Ghagahda, D. Rendon, H. Gao, Z. Starosolski, R. Bhavane, C. Patel, A. Annapragada, C. Yallampalli, W. Lee, A liposomal Gd contrast agent does not cross the mouse placental barrier, Sci. Rep. (2016). doi:10.1038/srep27863.
Figures