4073
Reliable assessment of apparent diffusion coefficient in normal and ventriculomegaly fetal brains1Centro Fermi - Museo storico della Fisica e centro studi e ricerche Enrico Fermi, Rome, Italy, 2SAIMLAL, Sapienza University of Rome, Rome, Italy, 3Radiological Sciences, Sapienza University of Rome, Rome, Italy, 4Physics, Sapienza University of Rome, Rome, Italy, 5Physics, CNR-Institute for Complex Systems, Rome, Italy
Synopsis
Ventriculomegaly (VM) is one of the most common disease in fetuses; however, DWI studies during gestation are scarce. In this work, DWI was performed in normal and VM fetal brains at different gestational ages (GA) and ADC was calculated. Denoising and artifacts corrections were used to improve signal-to-noise ratio and the reliability of measures. We found significant variations in ADC as GA increases, reflecting microstructural changes due to brain maturation. Moreover, ventricles dilatation measured on DWIs provided an accurate classification of VM. DWI with artifacts corrections could be a powerful tool to evaluate brain abnormalities and accurately diagnose VM.
Introduction
The sensitivity of diffusion weighted imaging (DWI) in detecting microstructural changes in cerebral tissues, non-invasively, suggests to establish a reliable prenatal DWI protocol to investigate fetal Ventriculomegaly (VM). VM is diagnosed in approximately 1 out of every 1000 live births[1], at any gestational age (GA), with a 36,7% probability of survival without disability [2]. Previous DWI studies in fetuses are limited and usually lack of appropriate pre-processing of raw data to improve the quality and reliability of the results. Fetal movement artifacts and poor resolution prevent the correct selection of small brain regions, affecting the reliability of Apparent Diffusion Coefficient (ADC) data. In this work, we investigated the ability of denoising DWI methods and artifacts corrections to assess un-biased ADC values in different regions of normal and VM fetal brains. Moreover, the ability of DWIs to classify VM and the variations in ADC as GA increases were evaluated.
Materials and Methods
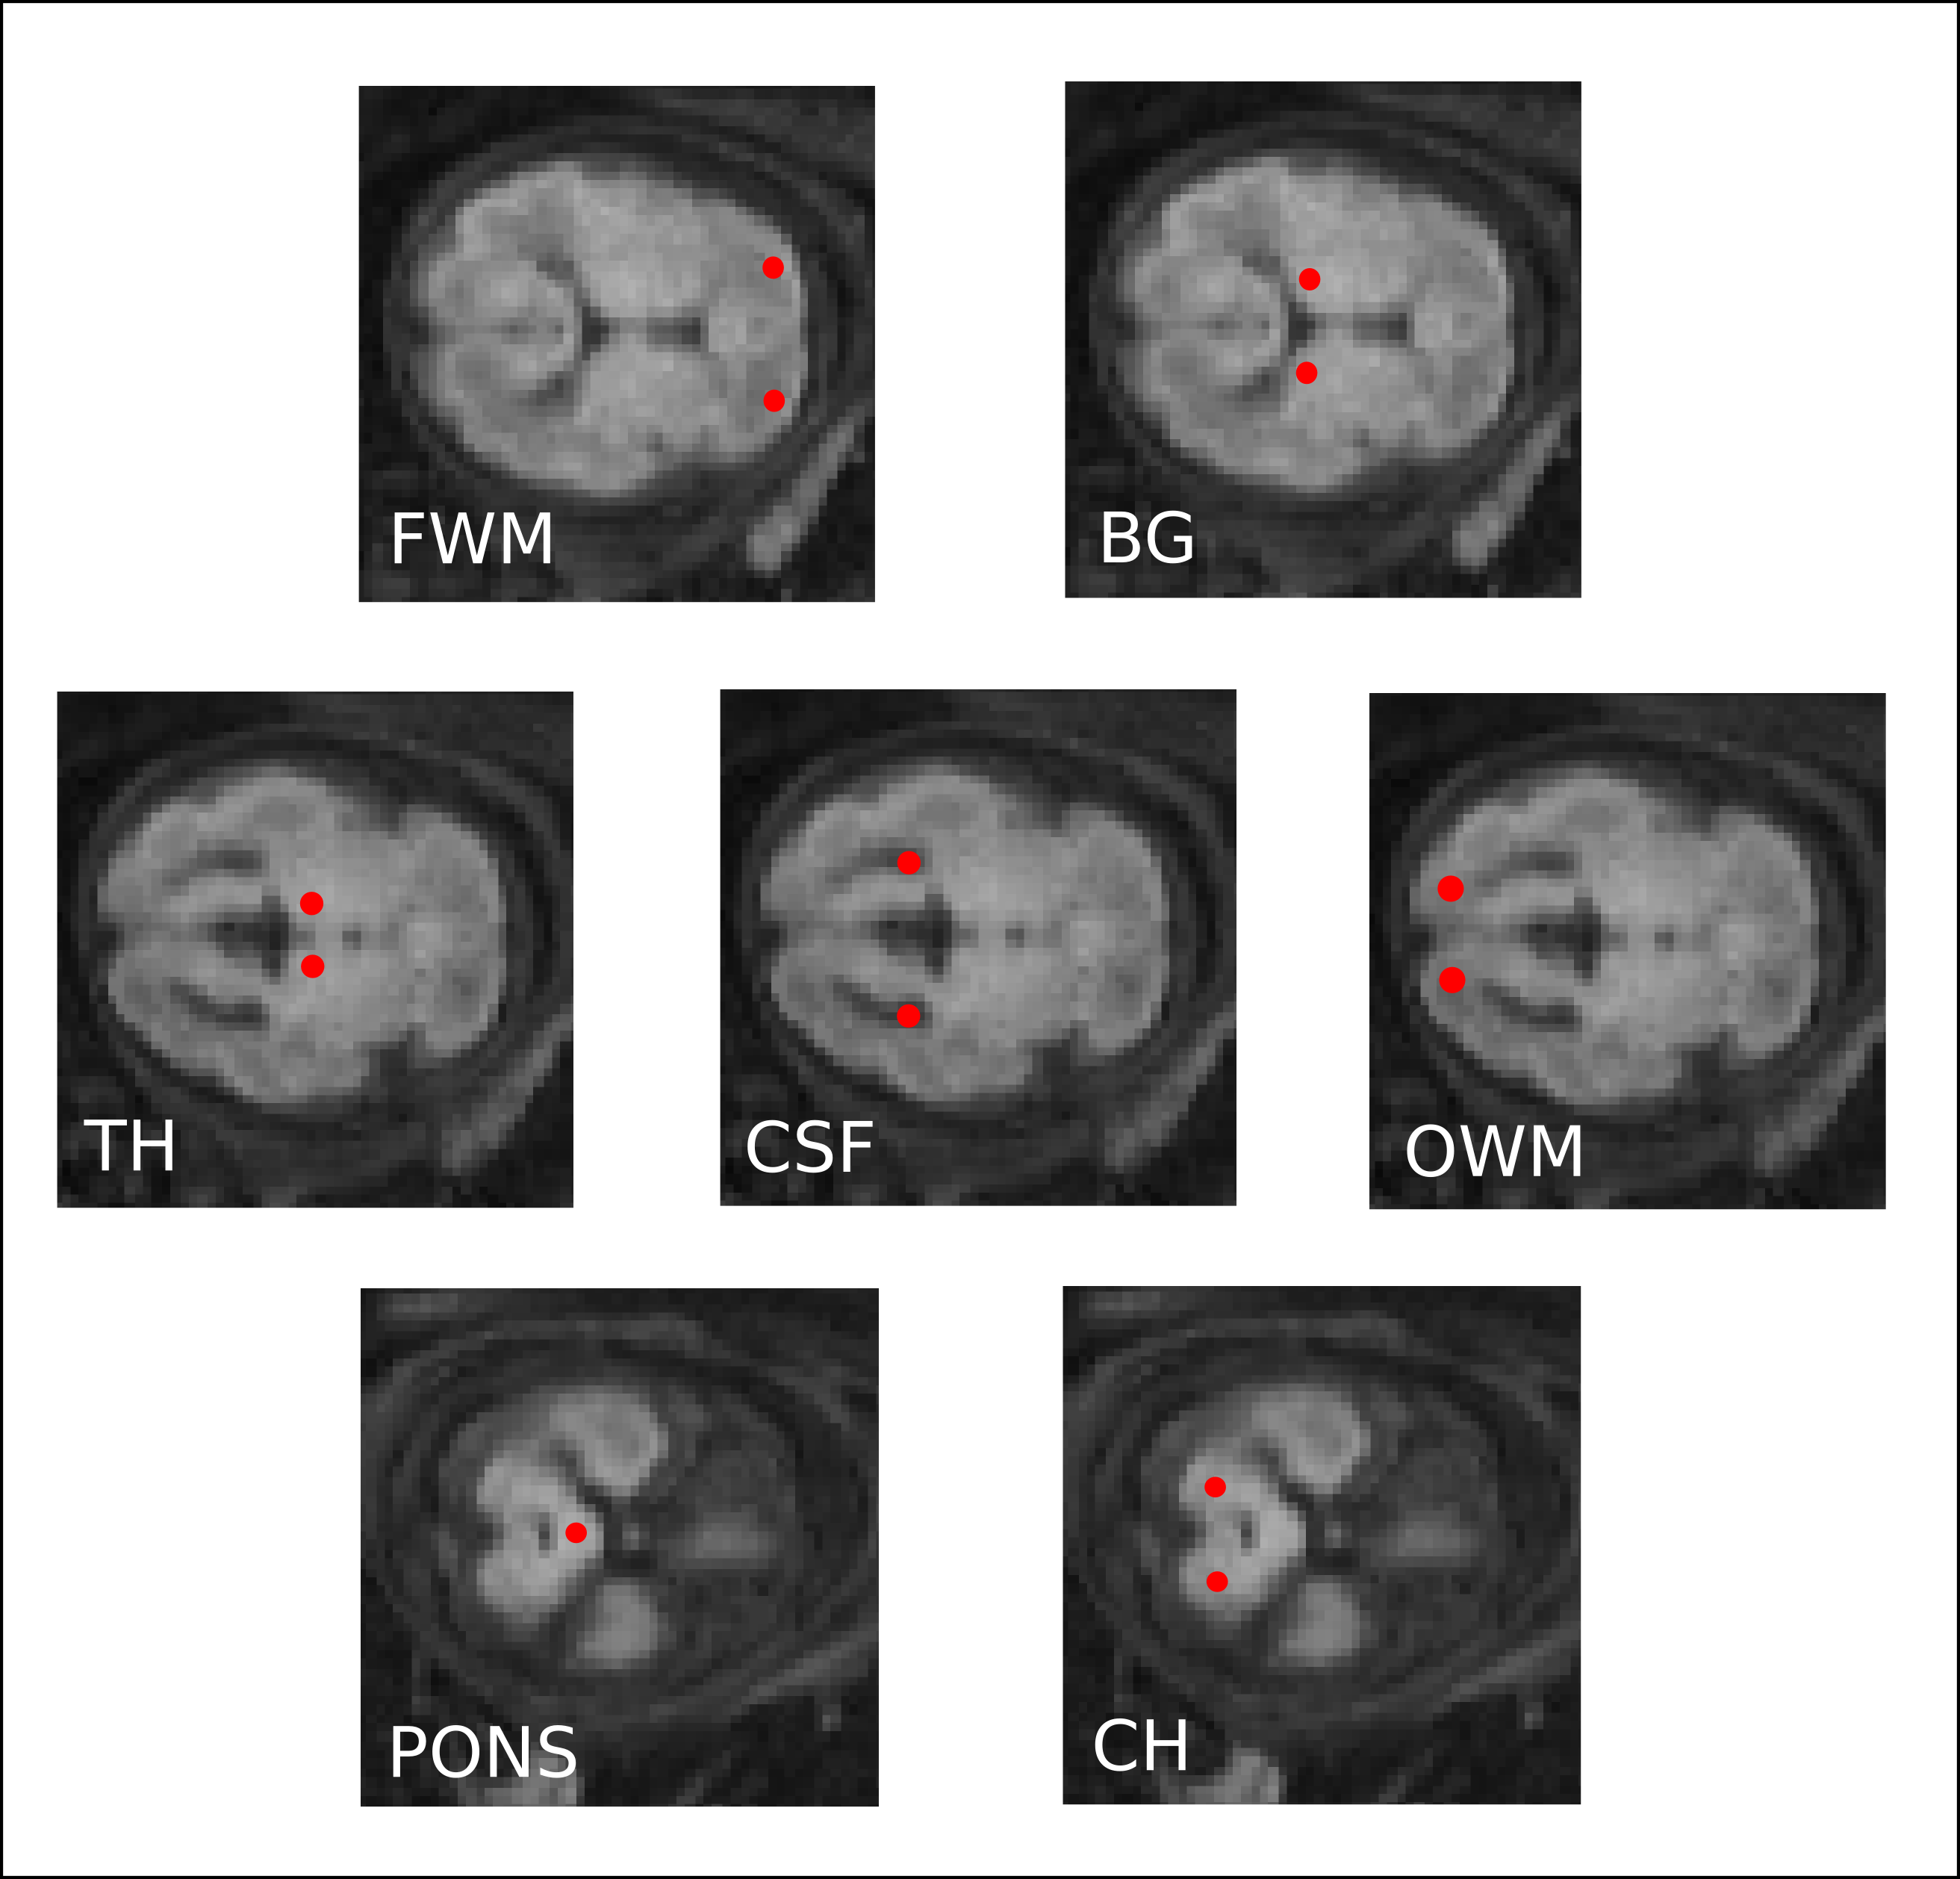
DWI was performed in 44 fetuses during the II and III trimester (GA range: 19-38 weeks.) at 1.5T (Siemens Avanto, Erlangen, Germany), without mother-fetal sedation. VM were diagnosed in 22 cases with ultrasound. The MRI protocol included a DW-Spin Echo EPI with TR/TE=4000/79; bandwidth=1628 Hz/px; matrix=192x192; FOV 379mm2. In-plane resolution=2x2mm2, slice-thickness=4mm, NSA=2, with b-values equal to 50,200,700 s/mm2 along the three (x, y, z) orthogonal axes. The minimum b-value was 50 s/mm2 to limit perfusion effects. Seven regions of interest (ROIs) were manually placed, as indicated by Fig. 1, in the Frontal White Matter (FWM), Occipital WM (OWM), Thalamus (TH), Basal Ganglia (BG) Cerebellum (CH), Pons and lateral ventricle Cerebral Spinal Fluid (CSF). All DWIs were denoised by dwidenoise tool [3], corrected for Gibbs-ringing artifacts [4] and for motion artifacts [5]. ADC was measured in each ROI through a fitting procedure developed in MATLAB and the goodness of fit was evaluated with the root mean squared error (RMSE). Dilatation of ventricles were measured with a semi-automatic algorithm in Matlab. Signal-to-noise ratio (SNR) of DWIs at each b value was also obtained to evaluate the reliability of estimated ADC values. Kruskal-Wallis' test was used to calculate the differences in ADC measured at the II and III trimester. Spearman’s test was used to evaluate the correlation between ADC values and GA.Results
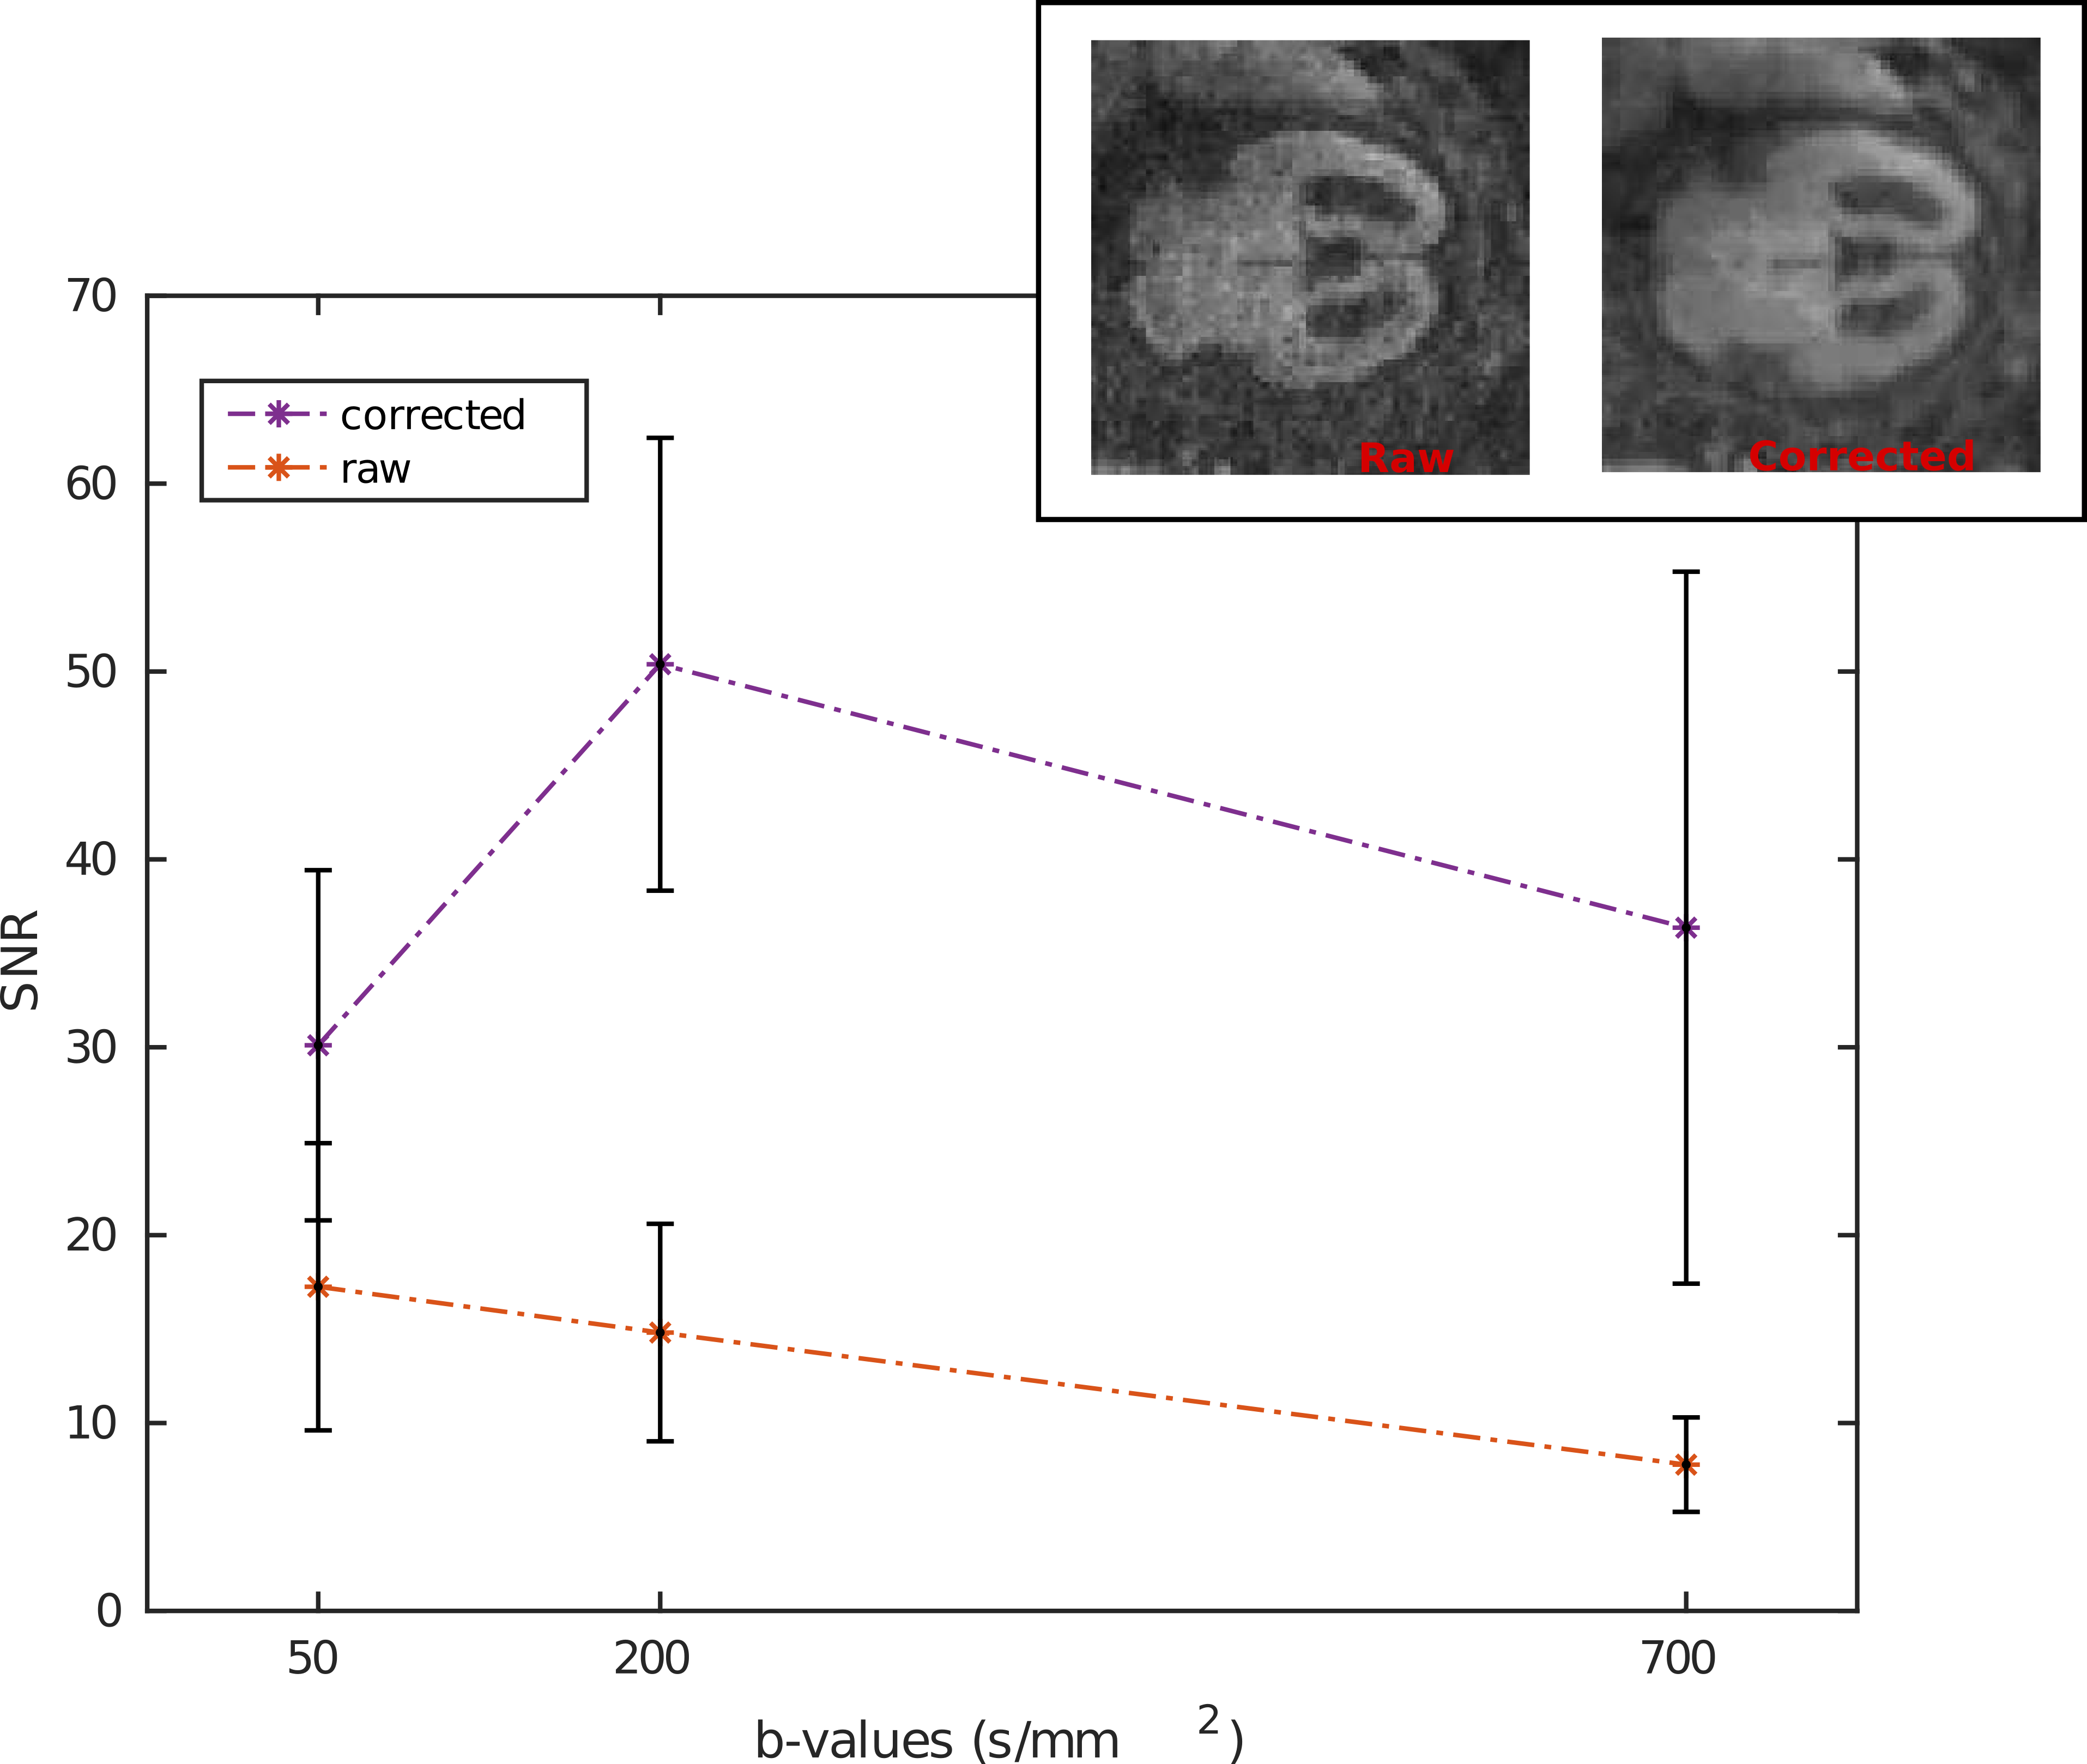
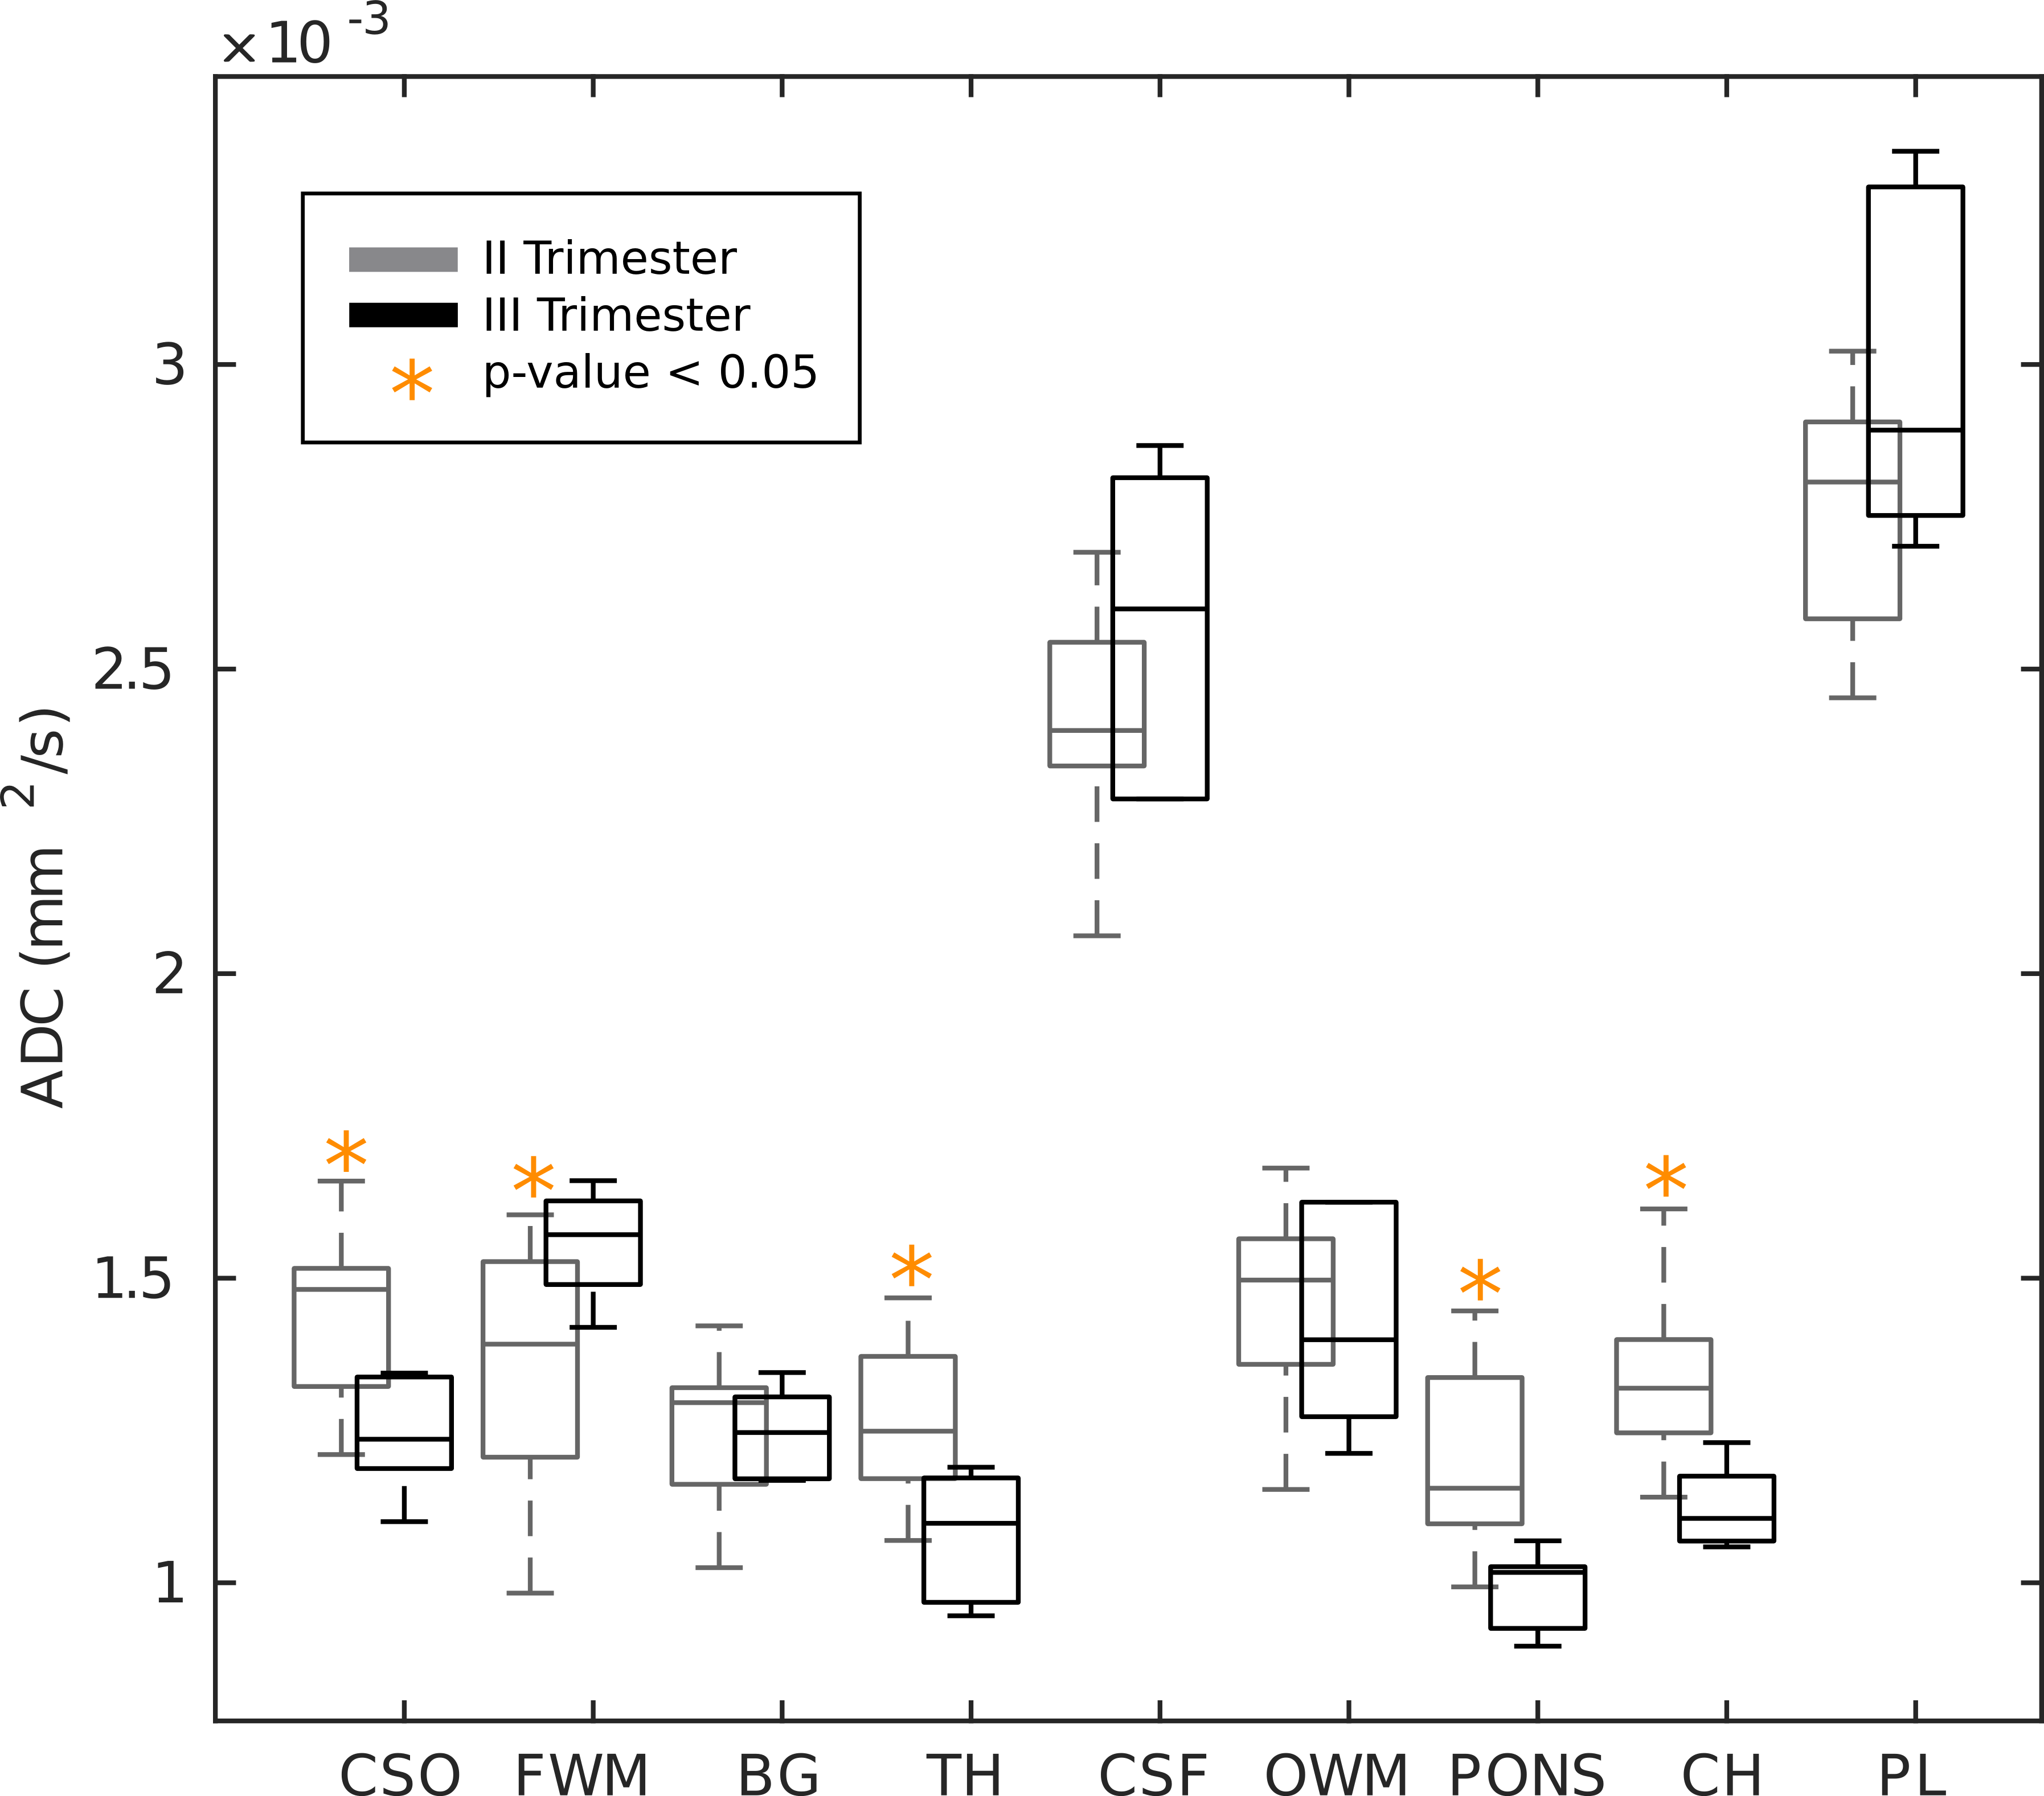
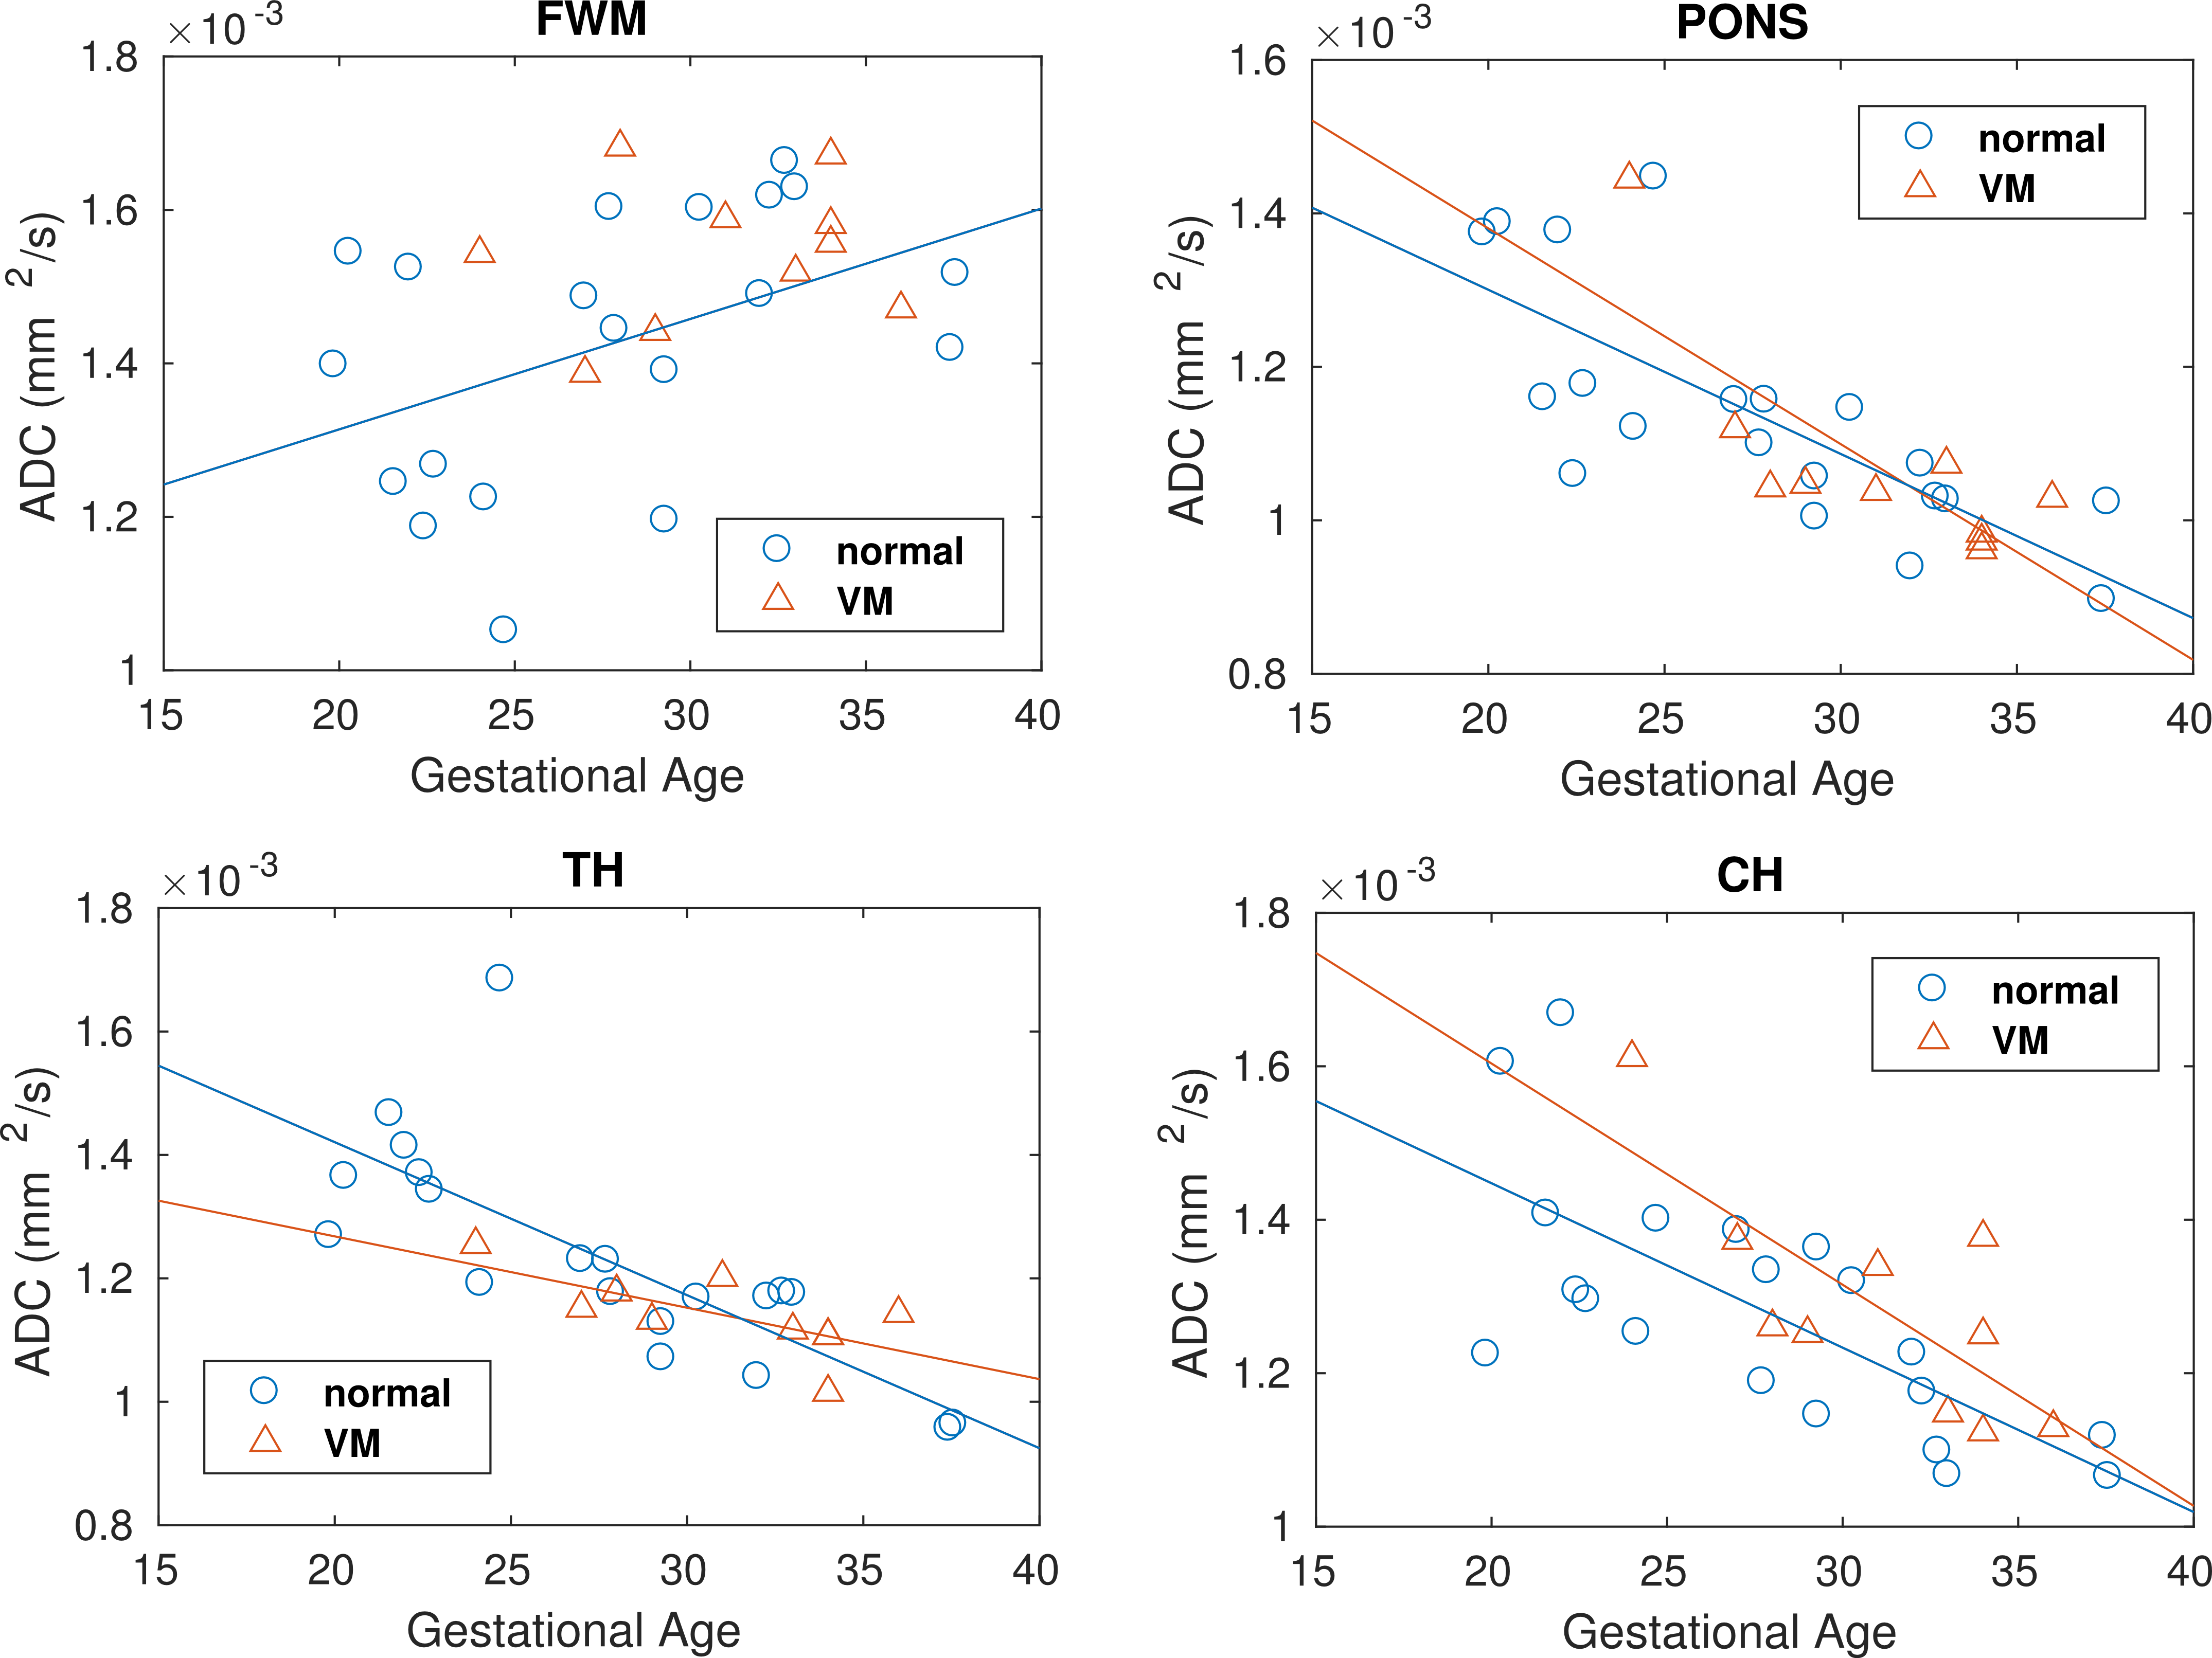
SNR significantly increased after noise and artifacts correction (p<0.02, Fig. 2). In normal fetuses, ADC mean values of CH, Pons, FWM and TH were significantly different between second and third trimester (p<0.01, Fig. 3). In partial agreement with literature [6-8], ADC values of normal fetuses in TH, CH and Pons showed significant negative correlations with GA (r=-0.84, -0.72, -0.80 respectively, p<0.001, Fig. 4), while a positive correlation was found between ADC and GA in FWM (r=0.44, p<0.05, Fig. 4). ADC measured in VM brains was significantly correlated with GA in TH, CH and Pons (r=-0.71, -0.75, -0.82 respectively, p<0.03, Fig. 4). ADC values in normal and VM ROIs were not significantly different. Finally, the area under the curve (AUC) of multi-class ROC analysis for VM classification was 0.89.Discussions and Conclusions
The routine of image correction provided a reasonable and fast method for improving the quality of DWI-images and providing an accurate identification of ROIs. Variations of ADC in healthy developing brains are in agreement with the normal progression of myelination that occurs from central to peripheral brain and from dorsal to ventral within a region [9]. We found no significant differences between ADC measured in normal and VM brains, unlike other studies [8,10] that used zero as minimum b-value, causing perfusion to affect ADC evaluation. Ventricles segmentation performed on DWIs enabled an accurate evaluation of their dilatation, providing a trustworthy classification of VM (AUC=0.89).
In conclusion, regional differences in fetal ADC values and their variations with GA reflected microstructural and physiological changes due to brain maturation. Moreover, DWI with semi-automatic algorithms for ventricles segmentation could be a fast and accurate diagnostic method for VM. Given the superiority of MRI in identifying CNS anomalies [11], these preliminary data may provide a comparison base for the evaluation of parenchymal CNS abnormalities in prenatal MRI diagnosis.
Acknowledgements
No acknowledgement found.References
[1] Pilu G. et al. Ultrasound of the fetal central nervous system. Current opinion in obstetrics & gynecology. 2000; 12:93–103.
[2] Carta S. et al. Outcome of fetuses with prenatal diagnosis of isolated severe bilateral ventriculomegaly: systematic review and meta-analysis. Ultrasound Obstet Gynecol. 2018 Aug;52(2):165-173.
[3] Veraart J. et al. Diffusion MRI noise mapping using random matrix theory. Magn. Res. Med. 2016; 76(5):1582-93.
[4] Kellner E et al. Gibbs‐ringing artifact removal based on local subvoxel‐shifts. Magnetic resonance in medicine 2016; 76(5):1574-1581.
[5] Jenkinson M. et al. Improved Optimisation for the Robust and Accurate Linear Registration and Motion Correction of Brain Images. NeuroImage, 17(2), 825-841, 2002.
[6] Schneider M.M. et al. Normative apparent diffusion coefficient values in the developing foetal brain. Am. J. Neuroradiol. 2009; 30(9):1799-1803.
[7] Han R. et al. Assessment of apparent diffusion coefficient of normal foetal brain development from gestational age week up to term age: a preliminary study. Foetal diagn. Ther. 2014;37(2):102-107.
[8] Yaniv G. et al. Region-specific changes in brain diffusivity in foetal isolated mild ventriculomegaly. Eur Radiol 2016; 26:840-848.
[9] Matsumoto J.A. et al. MRI Atlas of pediatric brain maturation and anatomy. Oxford University Press, 2017.
[10] Brouwer M.J. et al. Sequential Cranial Ultrasound and Cerebellar Diffusion Weighted Imaging Contribute to the Early Prognosis of Neurodevelopmental Outcome in Preterm Infants. PLoS One. 2014; 9(10): e109556.
[11] Barzilay E. et al. Fetal Brain Anomalies Associated with Ventriculomegaly or Asymmetry: An MRI-Based Study. American Journal of Neuroradiology February 2017, 38 (2) 371-375.
Figures